

Translate this page into:
Absorption of oenothein B nanoparticles constructed using casein phosphopeptide and chitosan
⁎Corresponding author. zs@zqu.edu.cn (Shuai Zhang)
-
Received: ,
Accepted: ,
This article was originally published by Elsevier and was migrated to Scientific Scholar after the change of Publisher.
Peer review under responsibility of King Saud University. Production and hosting by Elsevier.
Abstract
The Oenothein B (OEB) rich in eucalyptus is a kind of extremely development of prospects of antioxidant activity, but low oral bioavailability limits its application. The novel polyelectrolyte nanoparticle was designed for OEB delivery through the self-assembly of casein phosphopeptides (CPP) and natural active polysaccharides-chitosan (CS). The OEB nanoparticle with small particle size and high embedding rate were constructed to solve the problem of low oral bioavailability of OEB, and its stability as well as in vivo absorption were investigated. The storage stability analysis, digital inverted fluorescence microscopy and emission field scanning electron microscopy showed that the particle size and total amount of OEB nanoparticles did not vary significantly after 96 h of continuous storage at room temperature, and the particle size distribution was uniform, and the particles kept their integrity pH 1.2. The maximum release rate of OEB nanoparticles was only 0.72% in artificial gastric fluid and 21.77% in artificial intestinal fluid. It greatly reduces the risk of its decomposition and plays a better protective role. The results of in vivo absorption showed that OEB nanoparticle gavage mice did not detect OEB in blood and its metabolites except for OEB in gastric juice, indicating that OEB changes in vivo after release. Therefore, although OEB nanoparticles can effectively protect their decomposition in gastrointestinal fluid, it is best to achieve sustained release at the target location in order to improve the absorption and utilization effect.
Keywords
Oenothein B (OEB)
Casein phosphopeptides (CPP)
Chitosan (CS)
Nanoparticles
Encapsulation

1 Introduction
OEB is a bioactive ellagitannin which was initially isolated from the leaves of Oenothera erythrosepala (Oenotheraceae) in 1990. Numerous studies have reported that OEB has various biological functions, including antioxidant (Pei et al., 2019; Kiss et al., 2011; Yoshimura, 2014), anti-inflammatory (Tamura et al., 2019; Okuyama et al., 2021), antitumorl (Yoshida et al., 1990), antimicrobial (Miyamoto et al., 1993), immunomodulatory (Schepetkin et al., 2009; Ramstead et al., 2012), and hypoglycemic (Kawakami et al., 2014) effects. Due to the high cost of preparing OEB in large quantities and its low bioavailability in vivo (Cao et al., 2016; Wang et al., 2012), improving the delivery of OEB has become an important research focus.
Nanotechnology provides an effective solution to improve drug bioavailability (Ke et al., 2022; Haris et al., 2022). Due to their small size and structure, nanoparticles can be transported easily in the gastrointestinal tract. Therefore, in addition to improved solubility, increased drug stability and slow release, nanoparticles can also substantially enhance the tissue distribution and metabolism of active ingredients, improving functional effects and reducing toxic side effects (Siddiqui et al., 2012). Currently, several nanosized technologies have been applied in production, including microcapsules, microlipidic capsules, nanoemulsions, polyelectrolyte nanoparticles, and cubic liquid crystals (Meng et al., 2022; Allen et al., 2004; Krämer et al., 2004).
Casein phosphopeptides (CPP) are a class of phosphoserine-rich lactogenic bioactive peptides (Hartmann and Meisel, 2007) with a core structure of -Ser(P)-Ser(P)-Ser(P)-Glu-Glu-(Su et al., 2007), in which phosphoserine residues [-Ser(P)-] exist in clusters and are negatively charged in a weakly alkaline intestinal environment, preventing further degradation by digestive enzymes and keeping CPP stable in the intestine without further hydrolysis (Tenenbaum et al., 2022; Schipper et al., 1996; Sato et al., 1991; García-Nebot et al., 2010; Lou et al., 2011).
Chitosan (CS) is a rare cationic straight-chain polymer that can form polyelectrolyte complexes with water-soluble anionic macromolecules such as glycosaminoglycans, proteins or synthetic anionic compounds through electrostatic interactions (Janes et al., 2001). CS is often used as a nanocarrier to embed, protect and transport bioactive substances, with good embedding effect, and can effectively improve the stability of bioactive substances, delay their release time in vivo, and enable them to be transported to the target position to exert physiological effects.Thakur et al. (2016) develop tamoxifen- loaded chitosan-PLGA micelles, the developed nano-system was able to substantially load the drug and control the drug release. The nanocarriers were uptaken by MCF-7 cells, noticeably. The carrier was able to locate the drug in the interiors of rat skin in considerable amounts to that of the conventional product. Due to its good biodegradability and biocompatibility, CS is widely used in food and biomedicine(Qin et al., 2022; Esim et al., 2022).
Hu et al. (Hu et al., 2012) have used CPP and CS to electrostatically self-assemble and encapsulate epigallocatechin gallate into nanoparticles with good biocompatibility and bioavailability, which were then orally administered for chemoprevention. However, the nanoparticles have not been characterized in detail, and their absorption effect is also predicted by Caco-2 cell monolayers experiments. Lan et al. (2017) focused on the effects of different raw materials, pH, CPPs/CS ratio, crosslinker and other factors on the characteristics of OEB nanoparticle size, Count rate, particle dispersity index, and Release of the encapsulated OEB under simulated gastrointestinal conditions. In this work, the characteristics, morphological characteristics, encapsulation rate, drug load, storage stability, etc. of OEB nanoparticles were constructed by self-assembly using food-grade bioactive peptide-casein phosphopeptide and active polysaccharide-chitosan, and the characteristics, morphological characteristics, encapsulation rate, drug load, storage stability, etc. of OEB nanoparticles were discussed, and their absorption effects in vivo were studied.
2 Materials and methods
2.1 Materials
OEB of purity ≥ 99% was made in our laboratory. CPP of 92.5% purity was obtained from Greencream Biotech Co., Ltd. in Guangzhou. Its nitrogen/phosphorous content ratio is 3:1, and the average molecular weight is 2 kD. Chitosan (CS) with greater than 90% deacetylation degree was purchased from Shenbotai Biotechnology Co., Ltd in Shenzhen. Genipin (GP, 98% purity) was obtained from Kangbang Biotechnology Co., Ltd in Chengdu. Pepsin with enzymatic activity of 3000–3500 NF U/mg, trypsin with activity of 4 NF U/mg, α-amylase with activity of 10-20NF U/mg, and lipase with activity of 15–35 NF U/mg were all purchased from Qiyun Biotechnology Reagent Co., Ltd. in Guangzhou. All chemicals were of at least analytical grade.
Animal experiments: SPF grade healthy male KM mice, weight 25 ± 2 g, license number “scxk 2013–0002” were purchased from Guangzhou University of Traditional Chinese Medicine Laboratory Animal Center.
2.2 Methods
2.2.1 Preparation of OEB nanoparticles
The CS sample was dissolved in 0.5% glacial acetic acid solution to prepare a mother liquor (1%), stirred continuously for 48 h, then completely dissolved for later use. CPP and GP were dissolved in a small amount of NaCl (0.05 M) and ethanol solution (0.1%) to prepare transparent solutions (1%). OEB powder was dissolved into a mother liquor (1%) in a distilled water. All solutions were passed through a 0.45 µm filter before use. To form OEB nanoparticles, 6 mL CPP solution was added at room temperature into a 0.05 mol/L NaCl solution (82 mL) with pH 5.50 ± 0.05. After stirring, 2 mL OEB solution was added, stirred, after which 6 mL CS solution was added dropwise and stirred well. Finally, 4 mL GP solution was added as the cross-linking agent and mixed in with a magnetic stirrer for 4 h.
The different concentrations of the solution system have an effect on the size of the OEB nanoparticle. During the reaction, the mass ratio of CPP:OEB:CS:GP was controlled to be 3:1:3:2, and the total concentration of CPP and CS was lower than 3.0 mg/mL (Huang et al., 2017).
2.2.2 Characterization of nanocomplexes
2.2.2.1 Dynamic light scattering for particle size characterization
A small of the sample was placed in a cuvette, and the hydrodynamic diameter (Dh) for particle size) and dispersion number (PdI) of the nanocomplexes in water were determined using dynamic light scattering (DLS) method at 25 °C, and each sample was measured three times in parallel (Lan et al., 2017).
2.2.2.2 Electrophoretic mobility calculation of surface charge
The surface potential of the nanocomplexes was calculated by measuring the electrophoretic mobility of the samples after electrification with a rake electrode using a zeta potential meter (Hu et al., 2014; Chakraborty, 2010).
2.2.2.3 Encapsulation rate and drug loading capacity determination
-
Liquid phase analysis conditions (Klemmer et al., 2012):
Chromatographic column, DiamonilR2C18 column (250 × 4.6 mm, 5 μm); detector, Shimadzu SPD-10A; detection wavelength, 210 nm, 270 nm; flow rate, 1 mL/min; injection volume, 20 μL; mobile phase, A is acetonitrile, B is 0.2% formic acid water; elution procedure, 12% acetonitrile isocratic elution for 20 min. The OEB standard solution was detected, and the standard curve was plotted with the OEB concentration as the x-axis and the peak area as the y-axis, and the regression equation was y = 2 × 10⁷x + 147431 (R2 = 0.9965).
Calculations: The concentration of OEB in the supernatant was determined using HPLC following centrifugation of the prepared nano emulsion at 12,000 r/min for 30 min, while the OEB content in the sample was calculated based on the standard curve. Drug loading and encapsulation rates were obtained according to the following formula:
2.2.2.4 Observations using a digital inverted fluorescence microscope
The sample solution was spread evenly onto the center of the slide. 100 × oil lens was used to observe and image particle morphology using Axioskop 40 digital fluorescence microscope (ZEISS, Germany).
2.2.2.5 Morphology analysis method of emission field scanning electron microscope
The sample was uniformly distributed onto the front side of the single-crystal wafer, and then dried naturally for morphological observation under the S-4800 Cold Field Emission Scanning Electron Microscope (FESEM), Hitachi, Japan). The resolution was 1.0 nm (15 kV) or 1.0 nm (1 kV), the acceleration voltage was 0.5–30 kV with a 0.1 kV/step. A magnification of 20X to 800,000X was used. The beam intensity was 1 pA − 2nA. A3-axis motor drive stage with a movement range of 0–50 mm (X), 0–50 mm (Y), 1.5–30 mm (Z);at −5 - +70° (T) and R of 360° (R) were used. The maximum sample size was100 mm.
2.2.3 Storage stability testing of OEB nanoparticles
OEB nanosuspension (pH 1.2) were stored at room temperature and the particle size was measured by dynamic light scattering using a 90 Plus nanoparticle size and zeta potential meter (Brookhaven Instruments, USA) at 0.5, 1, 4, 12, 48, and 96 h to observe the change in particle size and to assess the stability of the particles.
2.2.4 In vitro release experiments of OEB nanoparticles
The lyophilized OEB 1.1381 g nanoparticle powder was prepared using 1 mL distilled water as the mother liquor, and 1990 μL of the prepared artificial simulated gastric and intestinal fluids (Pharmacopoeia Committee of the People's Republic of China, 2005) were added with 10 μL of OEB mother liquor to obtain an OEB equivalent concentration of 1.1 mg/mL in a 10 mL test tube to a volume of 2 mL. After mixing, and sealing, the solution was placed on a shaker in a constant temperature water bath at 37 °C. At each time point (10 min, 0.5 h, 3 h, 6 h, 8 h, 12 h, 18 h, and 24 h), 3 × 2 tubes of the corresponding test tubes were removed and centrifuged at 12,000 r/min for 10 min, and the supernatant was separated and filtered through a 0.45 µm microporous membrane. The OEB content in the supernatant after each centrifugation was determined by HPLC. The formula for calculating the cumulative percentage of OEB release (Q) at each time point is as follows. Q (%) = (V × C) / W × 100
where V is the total volume of drug release medium and nanosuspension in mL, C is the concentration of OEB that was measured in the centrifuged supernatant at each time point in mg/mL and W is the total mass of OEB in the nanosuspension in mg.
2.2.5 In vivo absorption and metabolism of OEB and OEB nanoparticles following oral gavage in mice
All experimental procedures involving animals were performed in strict compliance with the Animal Care and Use Guidelines and Regulations of the Ethics Committee of South China Agricultural University.
The release and metabolism of OEB and OEB nanoparticles in mice were investigated after the oral gavage route of administration. The concentration of OEB and its products in the samples were measured by HPLC (LC-10ATVP Plus, Shimadzu, Japan) to assess pharmacokinetic characteristics.
2.2.5.1 Experimental method and operation
180 healthy male mice, weighing 35 ± 5 g were randomly divided into 12 and 5 groups for treatment with OEB nanoparticle or just OEB, respectively. The blank control group for 0 and 12 h after oral gavage contained 9 mice in each group. Uniform saturated solutions of OEB or OEB nanoparticles were prepared in distilled water. The mice were divided into cages according to different sample collection times. Feces and urine were collected into centrifuge tubes every 4 h during that time period. Mice fasted for 12 h before the experiment with access to water. After gavage, blood samples were collected from the eyes in 1 mL of sodium heparin blood collection tubes under ether anesthesia at 0, 5 min, 15 min, 0.5 h, 1 h, 1.5 h, 2 h, 3 h, 4 h, 6 h, 8 h, 10 h, and 12 h. The samples were rapidly inverted and mixed, and then centrifuged at 3000 r/min for 10 min after standing for 10 min, and the plasma was separated and stored in a refrigerator at −20 °C. After completing blood collection, the mice were sacrificed by cervical dislocation and the stomach and small intestine (duodenum, jejunum, ileum and colon were taken out together) were dissected. The contents of the stomach, the stomach wall, intestinal contents and intestinal wall were collected into 10 mL centrifuge tubes, and the contents were scraped off with forceps to separate the contents from the wall. The collected gastric and intestinal contents were centrifuged at 3000 r/min for 10 min, and the supernatant was used for further analysis.
2.2.5.2 Determination of OEB in the gastric juice of mice
The stomach was cut open, the stomach contents were scraped off, and the stomach was washed with 2 mL of water and transferred to a 10 mL centrifuge tube for collecting the stomach contents. The contents were vortexed for 2 min, the gastric contents were quantified and centrifuged at 3000 r/min for 10 min. The entire supernatant was then taken, and 3 times the volume of methanol was added, vortexed for 1 min, left for 1 h and then centrifuged at 3000 r/min for 10 min, and the entire supernatant was taken. The supernatant was concentrated into a paste at 55 °C, washed with 1 mL of water and transferred to a 2 mL centrifuge tube, centrifuged at 12,000 r/min, and the supernatant was passed through a 0.45 µm filter membrane. 20 µL of the supernatant was taken for HPLC analysis. HPLC analysis conditions were 12% acetonitrile in formic acid water (0.2%) for isocratic elution for 12 min.
2.2.5.3 Determination of OEB in mouse intestinal fluid
The intestinal contents (including the mucosal layer of the intestinal wall) were scraped off with forceps, washed with 3 mL distilled water into a 10 mL centrifuge tube, centrifuged at 5000 r/min for 10 min, the entire supernatant was removed, 5 times the volume of methanol was added, vortexed well, and centrifuged at 3000 r/min for 10 min after 1 h of resting. The entire supernatant was concentrated into a paste at 55 °C, washed with 1 mL distilled water, and then transferred to a 2 mL centrifuge tube using a pipette. After centrifugation at 12,000 r/min, the supernatant was passed through a 0.45 µm filter membrane and 20 µL of the sample was taken for HPLC analysis. HPLC analysis conditions were 12% acetonitrile in formic acid water (0.2%) for isocratic elution for 25 min.
2.2.5.4 Determination of OEB in the blood of mice
The supernatant was separated and dried using nitrogen, then 200 µL of distilled water was added and centrifuged at 12,000 r/min for 10 min. 20 µL of the supernatant was used for HPLC analysis. HPLC analysis conditions were 12% acetonitrile in formic acid water (0.2%) for isocratic elution for 12 min.
2.2.5.5 Determination of OEB in mice urine
Urine was collected from mice at 6, 8, 12, 16, 20 and 24 h after gavage, and the supernatant was separated by centrifugation at 3000 r/min for 10 min. The supernatant was concentrated to 1 mL with 4 times the volume of supernatant in methanol, centrifuged at 3000 r/min for 10 min, and the supernatant was concentrated into an extract under reduced pressure at 50 °C, dissolved with 1 mL of water and vortexed, then passed through 0.45 µm microporous organic filter membrane to obtain the urine sample solution. A blank urine sample solution was prepared in the same way. 12,000 r/min centrifugation was performed for 10 min, and 20 µL of the supernatant was taken into the sample for HPLC.
2.2.5.6 Determination of OEB in mice feces
The feces were collected at 6, 8, 12, 16, 20 and 24 h after gavage, added 3 mL of distilled water and extracted twice, vortexed for 1 min, centrifuged at 3000 r/min for 10 min, extracted the supernatant, added 4 times the volume of supernatant in methanol, centrifuged at 3000 r/min for 10 min, extracted the supernatant, concentrated under reduced pressure at 50 °C into an extract, added 1 mL of water and vortexed, centrifuged at 12,000 r/min for 10 min, and extracted 20 µL of supernatant into the sample for HPLC detection.
2.2.6 Data processing
SPSS22.0 statistical software was used for data processing. Data are expressed as mean ± standard deviation (SD), and the differences between treatments were compared by t-test and one-way ANOVA.
3 Results and analysis
3.1 Characteristics of OEB nanoparticles
With CPP/CS as the wall material, the OEB particles were embedded to form stable nanoparticles, and their particle size, PdI, surface potential, envelope rate and drug load were 219.4 ± 2.3 nm, 0.254, 20.7 ± 1.7 mV, 95.82%, and 19.33%, respectively.
3.2 Morphology analysis of OEB nanoparticles
3.2.1 Analysis of DFM results
DFM (100X) observations of various samples under different conditions are shown in Fig. 1. CPP and CS can form complex carrier particles after assembly (Fig. 1a, 1b, 1d). As shown in Fig. 1e-h, as concentration increases, the degree of aggregation of polyelectrolyte complexes becomes larger, and the particles are crosslinked into larger aggregates. As shown in Fig. 1c, d and i, spinning after loading OEB formed more pellets and uniform particles. Fig. 1i and 1 k suggest that the crosslinking of GP affects the dispersibility of particles. As Fig. 1i and 1j, suggest, BSPN particles are unstable at pH 1.2, and the pellets depolymerize, while GBSPN still maintains good particle integrity at pH 1.2 after GP crosslinking, and particle depolymerization is not significantly reduced (Fig. 1k-l). In short, the size of the complexes that form in the system is more uniform in the nanoparticle range, and the particle distribution is more uniform with significantly improved particle stability in the gastric acid environment after GP crosslinking (Li et al., 2014; Grahame, 1947; Touyama et al., 1994; Touyama et al., 1994).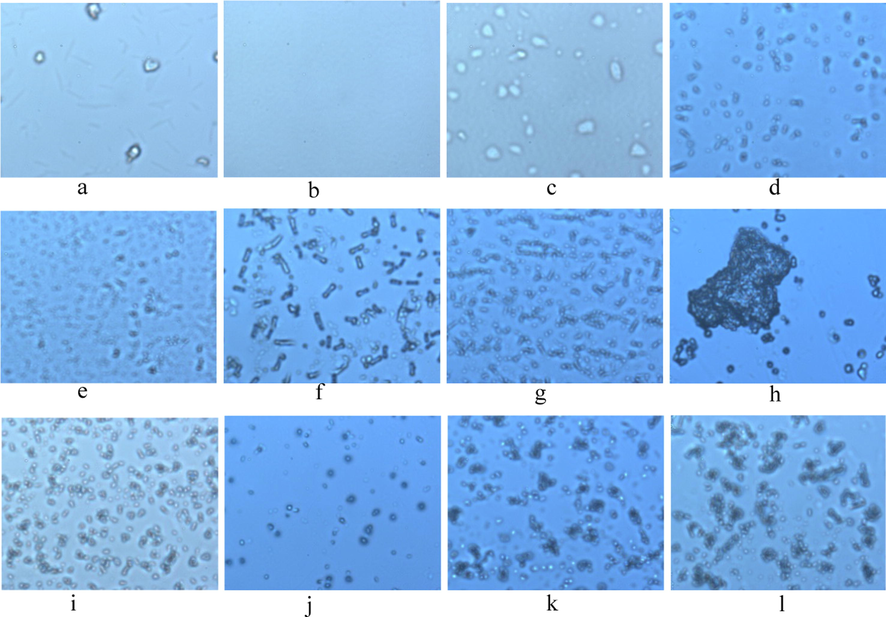
Digital inverted fluorescence microscope (100X) observations of different samples a. CPP, b. CS, c. OEB, d. SPN (1.2 mg/mL), e. SPN (3.0 mg/mL), f. SPN (5.0 mg/mL), g. SPN (10.0 mg/mL), h. SPN (20.0 mg/mL), i. BSPN (pH5.5),j. BSPN (pH1.2)), k. GBSPN (pH5.5), l. GBSPN (pH1.2). SPN:CS-CPPs nanoparticles, BSPN:OEB-loaded CS-CPPs nanoparticles, GBSPN:OEB-loaded CS-CPPs nanoparticles Cross-linked with Genipin.
3.2.2 Analysis of SEM results
The SEM characterization results of OEB nanoparticles at pH 5.5 and pH 1.2 before and after GP crosslinking are shown in Fig. 2. Our data suggest that there are different degrees of adhesion and accumulation between the particles in the sample, and a large number of agglomerates are clearly visible, while the number of particles is reduced when the pH of the system is gradually reduced. The SEM characterization of OEB nanoparticles at pH 5.5 and pH 1.2 before and after GP crosslinking are shown in Fig. 2, and there are varying degrees of adhesion and accumulation between the particles in the sample, a large number of agglomerates are clearly visible, and the number of particles is reduced when the pH of the system is gradually reduced. Comparing a and b in Fig. 2, it is easy to find that when pH is reduced to 1.2 which is close to the gastric microenvironment, the number of particles is significantly reduced, and the complex is basically depolymerized. Fig. 2c and 2d demonstrate that the addition of GP reduces the depolymerization of the particles as pH decreases, and that there are still a large number of pellets at pH 1.2. Interestingly, SEM images of OEB nanoparticles after GP crosslinking (Fig. 2c) demonstrate that in addition to some of the particles scattered in the bottom layer of the front of the monocrystalline silicon wafer, a large number of hybrid crosslinking networks formed by aggregation between particles floating on the surface in line with what has been previously reported (Chen et al., 2004; Khan et al., 2014). Therefore, the crosslinking of GP can significantly improve the stability of OEB nanoparticles at low pH, and has a good protective effect on maintaining a large number of OEB nanoparticles with good particle integrity in the gastric acidic environment. GP crosslinking with OEB nanoparticles also causes the color of the solution to change from light blue to bluish black, which changes with GP concentration and crosslinking time as also reported in literature (Nikolic and Djonlagic, 2001; Yuan et al., 2007).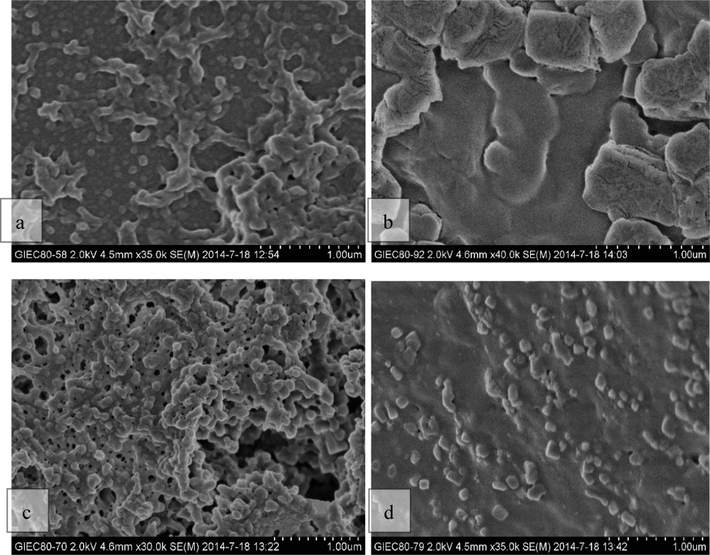
SEM diagram of OEB nanoparticles at different pH values before and after GP crosslinking non-crosslinkeded sample - pH 5.5, (b) non-crosslinkeded sample - pH 1.2, (c) GP crosslinked sample - pH 5.5, (d) GP crosslinked sample - pH 1.2.
3.3 Storage stability test results of OEB nanoparticles
The particle sizes within the nanosuspension prepared as described in 2.2.1 are shown in Table 1. There is no obvious difference in the particle size and total amount of OEB nanoparticles after continuous storage for 96 h, and the particle size distribution remains uniform. As storage time increases, the particle size also increases mildly with an increase of 50 nm within 48 h, and an increase of 100 nm within 96 h. The solution remains clear without aggregation. This shows that the OEB nanosuspension only has good storage stability for a certain period.
Rest time /h
Particle size /nm
PdI
CR /kcps
0.5
219.4 ± 2.3
0.235
650.2
1.0
258.5 ± 2.2
0.236
617.4
4.0
263.5 ± 3.6
0.213
599.8
12
271.6 ± 5.0
0.200
501.5
24
265.3 ± 1.2
0.226
479.6
48
266.6 ± 1.8
0.251
579.4
96
310.7 ± 10.8
0.265
584.5
3.4 Results of in vitro release studies of OEB nanoparticles
The change curve of OEB nanoparticles over time in simulated gastrointestinal fluid is shown in Fig. 3(a). In the simulated gastric juice, the release rate in the first 6 h is relatively fast, reaching 0.72%, while the cumulative release amount is relatively small (only within 1%). In the simulated intestinal fluid, the maximum drug release (21.77%) is reached at 12 h, after which the drug release decreases. The release rate of OeB itself in simulated gastrointestinal fluid is relatively high(Lan et al., 2017) indicating that the encapsulated OeB can be better protected through GI tract. The reason for the increase in the release rate in intestinal fluid is that the pH value in intestinal fluid is higher than that of the preparation method, which affects the agglomeration of CPP/CS complexes, and part of OEB is released, but no significant changes in particles are found in the whole process, indicating that the complex is not depolymerized. The amount of drug release in the simulated gastrointestinal fluid decreased after 18 h, which suggests that free OEB released thereafter was bound to the pepsin or trypsin in the medium (Cao et al., 2016).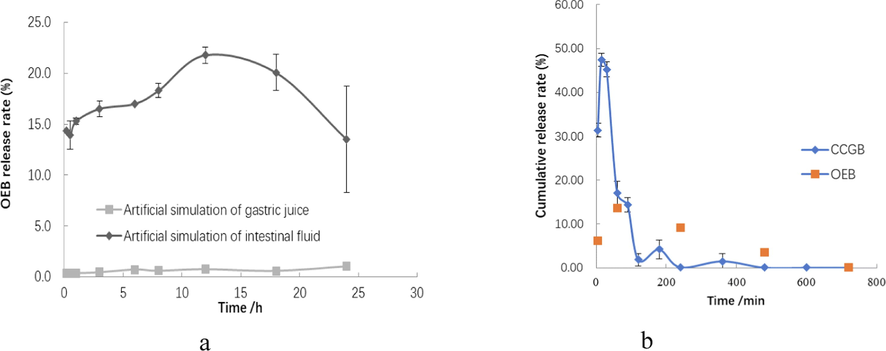
(a)Release profiles of OEB nanoparticles in artificially simulated gastrointestinal fluid; (b) Release curve of OEB over time in gastric juice following OEB nanoparticle administration.
3.5 Results of in vivo absorption and metabolism following the administration of OEB or OEB nanoparticles
Using KM mice, the release behavior and metabolism of OEB nanoparticles were investigated following an oral gastric dosing route, where the concentration of OEB in different tissue-like gastric contents, small intestine contents, plasma, urine and feces was determined by high performance liquid chromatography (HPLC), and the release mechanism of OEB was discussed.
3.5.1 Analysis of the contents of gastric juice in mice
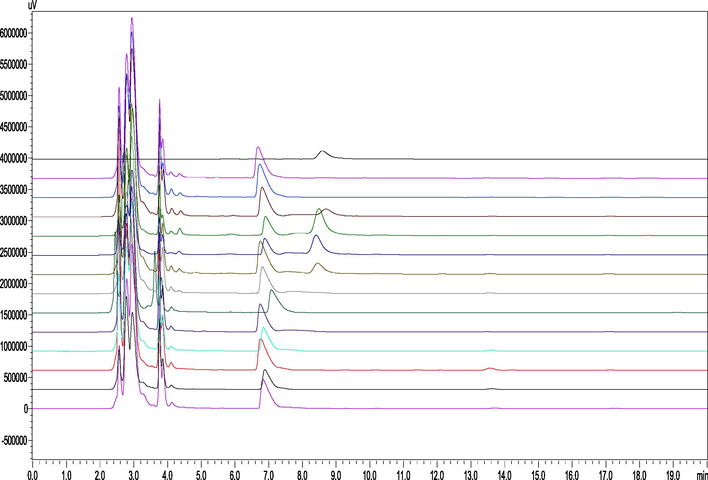
OEB release rate in gastric juice is shown in Fig. 3(b), which demonstrates that the cumulative release rate of OEB in the stomach was the largest (up to 47.39%) at 15 min following administration, after which the OEB release gradually decreased to only 0.12% at 4 h. As shown in Fig. 4, HPLC analysis was performed on each sample after different times following gastric lavage, and compared with the control group, it was seen that no new peaks of other substances were detected except for OEB. OEB content in gastric juice increased over time and then decreased to almost zero after 720 min. Comprehensive analysis shows that OEB can be slowly released from GBSPN in the stomach, but due to the slow release effect of CPPs/CS polyelectrolyte, OEB can be decomposed, and the loss rate after nanometerization is significantly reduced (Cao et al., 2016).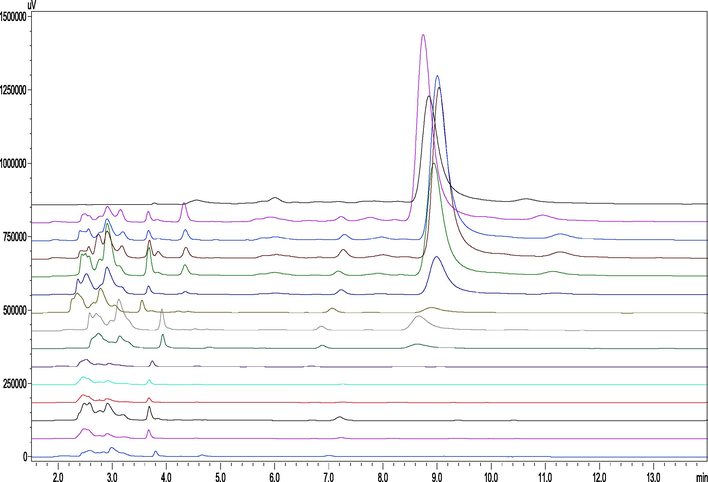
HPLC analysis of gastric juice at different times after OEB nanoparticles are administered to mice (From top to bottom, the OEB standards were 5, 15, 30, 60, 90, 120, 240, 360, 480, 600, and 720 min after gastric GBSPN, and the blank control group, respectively).
3.5.2 Analysis of material changes in mouse intestinal fluid
OEB release rate (or residue rate) in small intestinal fluid after different times in OEB and its nanoparticle gavage KM mice is shown in Fig. 5. The release rate of GBSPN in the small intestine after 30 min of gastric lavage reached 11.97%, and the release rate after 60 min was up to 55.62%, after which it began to decrease to reach 0.05% at 180 min. The OEB control group was not detected in the small intestine. Measurements in the small intestine for the OEB control group as well as in vitro stability analyses reveal that OEB may have degraded under the action of pancreatin, so OEB that’s released could not remain stable in the small intestinal environment in the form of a prototype compound. HPLC analysis of small intestine tissue samples of GBSPN are shown in Fig. 6, which reveal that there are no obvious new component peaks, except for the change in OEB content, which is inconsistent with the stability of OEB under the action of pancreatin, and is speculated to be related to the content of OEB and enzyme concentration.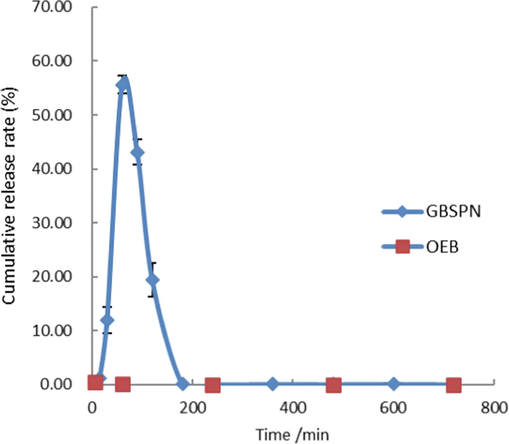
The release curve of OEB nanoparticles over time in the mouse small intestinal fluid.
HPLC analysis of intestinal fluid at different times after OEB nanoparticle gastric filling in mice (From top to bottom, the OEB standards were 5, 15, 30, 60, 90, 120, 240, 360, 480, 600, and 720 min after gastric GBSPN, and the blank control group, respectively).
3.5.3 Analysis of the results of substance changes in the blood of mice
As shown in Fig. 7(a), HPLC analysis of plasma samples at different time points showed no OEB presence in plasma and no new component peaks, indicating that OEB failed to enter the blood in the form of prototype compounds. The OEB control was not detccted in mouse blood. However, whether OEB nanoparticles can enter and be released into the bloodstream needs to be further studied.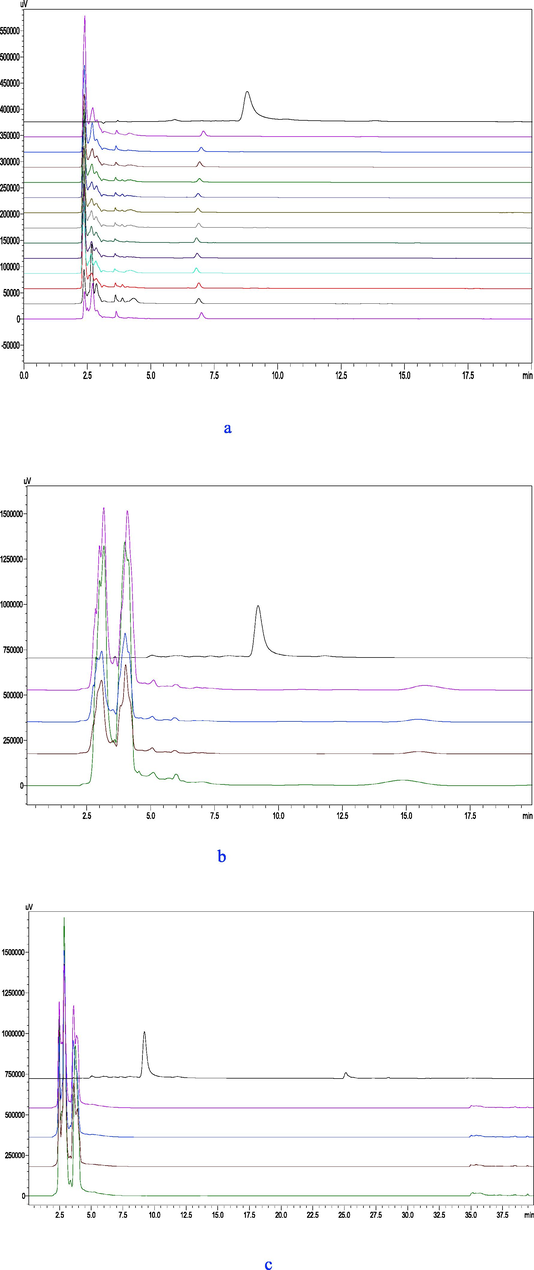
HPLC analysis of different parts at different times after OEB nanoparticle administration to mice. (a) Plasma (From top to bottom, the OEB standards were 5, 15, 30, 60, 90, 120, 240, 360, 480, 600, and 720 min after gastric GBSPN, and the blank control group, respectively);(b) Urine(From top to bottom, the OEB standards were 720, 600, and 480 min after gastric GBSPN, and the blank control group, respectively); (c) feces (From top to bottom, the OEB standards were 720, 600, and 480 min after gastric GBSPN, and the blank control group, respectively).
3.5.4 Analysis of substance changes in mouse urine
HPLC analysis reveals that OEB and its metabolites were not detected in mouse urine after gastric GBSPN (Fig. 7[b]). The urine of mice in the gastric OEB experimental group demonstrated new component peaks in the urine of the OEB group, however the determination of its metabolic mechanism and metabolites needed further study.
3.5.5 Analysis of substance changes in mouse feces
HPLC analysis reveals that OEB were not detected in mouse feces after gastric GBSPN (Fig. 7[c]). The feces of mice in the gastric OEB experimental group demonstrated new component peaks of the OEB group. Following gastric lavage, mice feces were collected every 4 h for observation, and the blue-black residues found in the feces indicated that the GBSPN sample for gavage could not be fully digested and absorbed in mice related to the degree of crosslinking and the dose of gastric filling. To select the appropriate amount of crosslinker to material ratio, it is not only necessary to consider their stability in the gastrointestinal tract, but also to take their digestion and absorption mechanisms into account. The OEB control was not detected in mouse feces.The in vivo release results of GBSPN can be used to guide the preparation of GBSPN.
4 Conclusions
Prepared by this study method, the nanoparticle size is 310 nm, the surface of the particles is up to 20 mV, the encapsulation rate is as high as 95.82%, and the drug load is 19.33% when centrifuged for 30 min, exhibiting good stability in pH greater than 4 and within 96 h. OEB nanoparticles achieve sustained release in artificial simulated gastric/intestinal fluid, and the highest release rate is only 0.72% in gastric juice and 21.77% in intestinal fluid, which reduces the risk of decomposition.Mouse gastric irrigation experiments of OEB and OEB-NP showed that OEB will still change in the body after being released from GBSCN, indicating that OEB is extremely unstable in the body and easy to decompose, and it is speculated that OEB cannot enter blood vessels through the gastrointestinal wall, but indirectly exerts its functional activity through metabolites. To maximize its oral utilization, sustained release can be designed at the target location.
Acknowledgments
This work was supported by the funds provided by the Natural Science Foundation of Chongqing City (Grant No. cstc2019jcyj-msxmX0263), and the Science and Technology Program of Guangdong Province of China (Grant No. 2020B121202014).
Declaration of Competing Interest
The authors declare that they have no known competing financial interests or personal relationships that could have appeared to influence the work reported in this paper.
References
- Drug delivery systems: entering the mainstream. Science. 2004;303:1818-1822.
- [CrossRef] [Google Scholar]
- Preparation and in vitro and in vivo stability of oenothein B from Eucalyptus Leaves. Chem. Ind. For. Prod.. 2016;36:112-118.
- [CrossRef] [Google Scholar]
- Study of cadmium-humic interactions and determination of stability constants of cadmium-humate complexes from their diffusion coefficients obtained by scanned stripping voltammetry and dynamic light scattering techniques. Anal. Chim. Acta. 2010;659:137-143.
- [CrossRef] [Google Scholar]
- A novel ph-sensitive hydrogel composed of n, o-carboxymethyl chitosan and alginate cross-linked by genipin for protein drug delivery. J. Control. Release. 2004;96:285-300.
- [CrossRef] [Google Scholar]
- Chitosan-coated bovine serum albumin nanocarriers mediate efficient delivery of methotrexate in breast cancer therapeutics. J. Drug Deliv. Sci. Technol.. 2022;77:103906
- [CrossRef] [Google Scholar]
- Milk versus caseinophosphopeptides added to fruit beverage: Resistance and release from simulated gastrointestinal digestion. Peptides. 2010;31:555-561.
- [CrossRef] [Google Scholar]
- The electrical double layer and the theory of electrocapillarity. Chem. Rev.. 1947;41:441-501.
- [CrossRef] [Google Scholar]
- Nanotechnology-A new frontier of nano-farming in agricultural and food production and its development. Sci. Total Environ.. 2022;857:159639
- [CrossRef] [Google Scholar]
- Food-derived peptides with biological activity: from research to food applications. Curr. Opin. Biotechnol.. 2007;18:163-169.
- [CrossRef] [Google Scholar]
- Nanochemoprevention by encapsulation of (-)-epigallocatechin-3-gallate with bioactive peptides/chitosan nanoparticles for enhancement of its bioavailability. Chem. Commun.. 2012;48:2421-2423.
- [CrossRef] [Google Scholar]
- Genipin-structured peptide-polysaccharide nanoparticles with significantly improved resistance to harsh gastrointestinal environments and their potential for oral delivery of polyphenols. J. Agric. Food Chem.. 2014;62:12443-12452.
- [CrossRef] [Google Scholar]
- Effect of coacervation conditions on the viscoelastic properties of N. O-carboxymethyl chitosan-gum Arabic coacervates. Food Chem.. 2017;228:236-242.
- [CrossRef] [Google Scholar]
- Polysaccharide colloidal particles as delivery systems for macromolecules. Adv. Drug Deliv. Rev.. 2001;47:83-97.
- [CrossRef] [Google Scholar]
- Inhibitory effects of pomegranate extracts on recombinant human maltase-glucoamylase. J. food sci.. 2014;79:H1848-H1853.
- [CrossRef] [Google Scholar]
- Trends and patterns in cancer nanotechnology research: A survey of NCI's caNanoLab and nanotechnology characterization laboratory. Adv. Drug Deliv. Rev.. 2022;191:114591
- [CrossRef] [Google Scholar]
- Genipin cross-linked nanocomposite films for the immobilization of antimicrobial agen. ACS Appl. Mater. Interfaces. 2014;6:15232-15242.
- [CrossRef] [Google Scholar]
- Oenothein B's contribution to the anti-inflammatory and antioxidant activity of Epilobium sp. Phytomedicine. 2011;18:557-560.
- [CrossRef] [Google Scholar]
- Complex coacervation of pea protein isolate and alginate polysaccharides. Food Chem.. 2012;130:710-715.
- [CrossRef] [Google Scholar]
- Dendritic polyamines: simple access to new materials with defined treelike structures for application in nonviral gene delivery. ChemBioChem.. 2004;5:1081-1087.
- [CrossRef] [Google Scholar]
- Rational design of food-grade polyelectrolyte complex coacervate for encapsulation and enhanced oral delivery of oenothein B. Food Funct.. 2017;8:4070-4080.
- [CrossRef] [Google Scholar]
- Understanding complex coacervation in serum albumin and pectin mixtures using a combination of the Boltzmann equation and Monte Carlo simulation. Carbohydr. Polym.. 2014;101:544-553.
- [CrossRef] [Google Scholar]
- Antibacterial activity and mechanism of action of chitosan solutions against apricot fruit rot pathogen Burkholderia seminalis. Carbohydr. Res.. 2011;346:1294-1301.
- [CrossRef] [Google Scholar]
- Advances in chitosan-based microcapsules and their applications. Carbohydr. Polym.. 2022;300:120265
- [CrossRef] [Google Scholar]
- Antitumor activity and interleukin-1 induction by tannins. Anticancer Res.. 1993;13:37-42.
- [CrossRef] [Google Scholar]
- Synthesis and characterization of biodegradable poly (butylene succinateco-butylene adipate)sJ. Polym. Degrad. Stabbil.. 2001;74:263-270.
- [CrossRef] [Google Scholar]
- Oenothein B, a bioactive ellagitannin, activates the extracellular signal-regulated kinase 2 signaling pathway in the mouse brain. Plants. 2021;10:1030.
- [CrossRef] [Google Scholar]
- Oenothein B inhibits human non-small cell lung cancer A549 cell proliferation by ROS-mediated PI3K/Akt/NF-κB signaling pathway. Chemico-Biological Interactions. 2019;298:112-120.
- [CrossRef] [Google Scholar]
- Pharmacopoeia Committee of the People's Republic of China, 2005. Chinese pharmacopoeia, 71&158.
- Properties and in vitro digestibility of starch encapsulated in chitosan-sodium phytate capsules. Food Hydrocoll.. 2022;135:108127
- [CrossRef] [Google Scholar]
- Oenothein B, a cyclic dimeric ellagitannin isolated from Epilobium angustifolium, enhances IFNγ production by lymphocytes. PloS One. 2012;7:e50546.
- [Google Scholar]
- Characterization of phosphopeptide derived from bovine β-casein: an inhibitor to intra-intestinal precipitation of calcium phosphate. Biochim. Biophys. Acta (BBA)- Protein Struct. Mol. Enzymol.. 1991;1077:413-415.
- [CrossRef] [Google Scholar]
- Immunomodulatory activity of oenothein B isolated from Epilobium angustifolium. J. Immunol.. 2009;183:6754-6766.
- [CrossRef] [Google Scholar]
- Chitosans as absorption enhancers for poorly absorbable drugs. 1: Influence of molecular weight and degree of acetylation on drug transport across human intestinal epithelial (Caco-2) cells. Pharm. Res.. 1996;13:1686-1692.
- [CrossRef] [Google Scholar]
- Impact of nanotechnology in cancer: emphasis on nanochemoprevention. Int. J. Nanomedicine. 2012;7:591-605.
- [CrossRef] [Google Scholar]
- Pancreatic hydrolysis of bovine casein: Identification and release kinetics of phosphopeptides. Food chem.. 2007;104:276-286.
- [CrossRef] [Google Scholar]
- Oenothein B, dimeric hydrolysable tannin inhibiting HCV invasion from Oenothera erythrosepala. J. Nat. Med.. 2019;73:67-75.
- [CrossRef] [Google Scholar]
- Identification, production and bioactivity of casein phosphopeptides-A review. Food Res. Int.. 2022;157:111360
- [CrossRef] [Google Scholar]
- Chitosan-modified PLGA polymeric nanocarriers with better delivery potential for tamoxifen. Int. J. Biol. Macromol.. 2016;93(Pt A):381-389.
- [CrossRef] [Google Scholar]
- Studies on the blue pigments produced from genipin and methylamine. I. Structures of the brownish-red pigments, intermediates leading to the blue pigments. Chem. Pharm. Bull.. 1994;42:668-673.
- [CrossRef] [Google Scholar]
- Studies on the blue pigments produced from genipin and Methylamine. II. On the formation mechanisms of brownish-red intermediates lead-ing to the blue pigment formation. Chem. Pharm. Bull.. 1994;42:1571-1578.
- [CrossRef] [Google Scholar]
- Antioxidant activity of polyphenol extracts from leaves of E. grandis× E. urophylla Guanglin No. 9. Food Sci.. 2012;33:20-24.
- [CrossRef] [Google Scholar]
- Macroring hydrolyzable tannin dimer with antitumor activity, and accompanying dimers from Woodfordia fruticosa flowers. Chem. Pharm. Bull.. 1990;38:1211-1217.
- [CrossRef] [Google Scholar]
- Structure elucidation of antioxidative polyphenols and their biological properties. J. Pharm. Soc. Jpn.. 2014;134:957-964.
- [CrossRef] [Google Scholar]
- The effect of cross-linking of chitosan microspheres with genipin on protein release. Carbohydr. Polym.. 2007;68:561-567.
- [CrossRef] [Google Scholar]


