

Translate this page into:
Ac conductivity, electric modulus analysis, dielectric behavior and Bond Valence Sum analysis of Na3Nb4As3O19 compound
⁎Corresponding author at: Laboratoire de Matériaux, Cristallochimie et Thermodynamique Appliquée, Faculté des Sciences de Tunis, Université de Tunis El Manar, 2092 El Manar II, Tunis, Tunisia. c.fatouma@yahoo.fr (Saïda Fatma Chérif)
-
Received: ,
Accepted: ,
This article was originally published by Elsevier and was migrated to Scientific Scholar after the change of Publisher.
Peer review under responsibility of King Saud University.
Abstract
The Na3Nb4As3O19 compound is synthesized by solid state reaction method and characterized by X-ray diffraction. The structure is described as a three-dimensional anionic framework having two kinds of tunnels where sodium cations are located. The framework of the title compound is thus of open character and the motion of sodium cations through the tunnels seems to be feasible. This factor led us to study the ionic conduction. In this work, we present the dielectric and electrical properties of Na3Nb4As3O19 compound by using the complex impedance spectroscopy technique, in the frequency range 0.01 – 13000 kHz. The conductivity measurements of the obtained ceramic are studied over a temperature range from 300 to 620 °C. The real and imaginary parts of the dielectric constant were found to decrease with frequency and to increase with temperature. The values of the frequency of the maximum of the imaginary part of the modulus and of the impedance are different indicating a non-Debye type of relaxation process. The values of the activation energy (Ea) calculated by different methods are in conformity. The Bond Valence Sum (BVS) model is used to identify the conduction pathways for the monovalent cations, allowing a better correlation between the electrical and the structural data. It suggests that the most probable sodium conduction pathway is along c-direction.
Keywords
Dielectric properties
Modulus analysis
Ac conductivity
BVS analysis

1 Introduction
The arsenates compounds containing a monovalent cation have attracted researchers due to their physical properties and their potential applications in several domains. They can exhibit ionic conduction properties, magnetic performances … (Ben Amor et al., 2008; Ben Smida et al., 2015; Chérif et al., 2011, 2012; Falah et al., 2015; Marzouki et al., 2014; Ouerfelli et al., 2007, 2015). Add to this, materials with open framework built up from polyanion groups like AsO4 are considered as cationic conductor compounds in positive electrode in lithium batteries. In particular, LiCoAsO4 arsenate with olivine structure (Arroyo-de Dompablo et al., 2006) shows interesting electrochemical properties. Where, Li-ions was reversibly deinserted / inserted from/into material at average voltages of 4.8 and 4.6 V respectively. In addition, the delithiated material maintaining the olivine structural framework.
For this reason, we have investigated the Na – Nb – As – O systems in which, at the best of our knowledge, only five materials were synthesized: Na2AsNbO6 (Hizaoui et al., 1999), Na3As2NbO9 (Hizaoui et al., 1999), NaAsNb2O8 (Harrison et al., 1994), NaAsNb4O13 (Bestaoui et al., 1998) and Na3Nb4As3O19 (Chérif et al., 2012). Four of these compounds exhibit a three dimensional framework characterized by the presence of tunnels in which sodium cations are located. Only the first one have a layer structure where Na+ cations are located between the covalent [NbAsO6]2− layers in hexagonal channels. For the last one, it was synthesized in a single-crystal form via a solid state reaction at 800 °C (Chérif et al., 2012). The structural study showed that the arsenate presents two types of tunnels where Na+ cations are located. The concept of bond valence can be successfully used to simulate cations migration in the crystal bulk. In this case, the BVS model offers a useful tool to relate the novel crystal structure to its ionic conductivity properties.
The present work is devoted in the first part to study the electrical and dielectric properties of Na3Nb4As3O19 at the temperature range 300 – 620 °C and in the frequency domain of 0.01 – 13000 kHz and in the second part to simulate the transport pathway of sodium ions by using the Bond Valence Sum model (BVS).
2 Experimental details
All chemicals were commercially available and were used without any further purification. The characteristics of the used chemicals for the preparation of the studied compound in forms of monocrystals or polycrystalline powders are collected in Table 1.
The used chemicals
Purity (%)
Manufacturers
Na2CO3
≥ 99,5
Sigma-aldrich
As2O5
99
Merck
Nb2O5
≥ 99,9
Fluka
Single crystals and the polycrystalline powder of the title compound were obtained by a solid state reaction as mentioned in previous works (Chérif et al., 2012, 2019).
The Na3Nb4As3O19 compound was characterized by single crystal X-ray diffraction. It crystallizes in the orthorhombic system, space group C2221 with a = 13.014(2) Å, b = 24.170(3) Å, c = 5.0880(9) Å and Z = 4. Add to this, it was characterized by X-ray powder diffraction technique using a PAN-analytical X’Pert PRO X-ray diffractometer equipped with copper anticathode (λKα = 1.5406 Å). Fig. 1 shows the X-ray diffraction patterns of the calcined powder recorded at room temperature and the calculated one. All the reflection peaks of the XRD pattern were indexed and lattice parameters refined using Celref 3.0 program (Altermatt and Brown, 1987). The best agreement was found in an orthorhombic system (C2221 space group) and the refined least squares lattice parameters are: a = 13.015(2) Å, b = 24.175(4) Å and c = 5.0857(1) Å which are in good agreement with the literature (Chérif et al., 2012).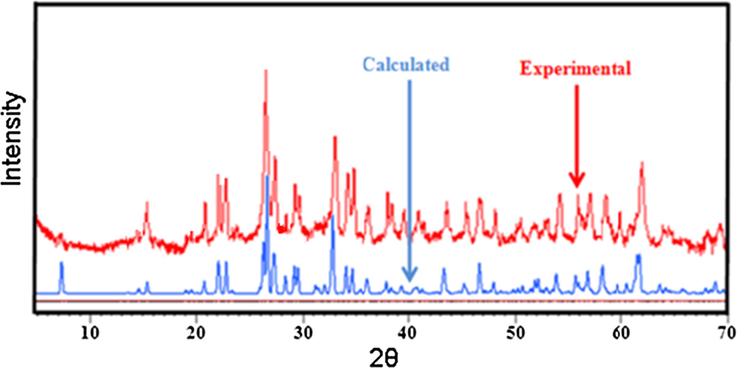
Calculated and experimental powder X-ray diffraction patterns of Na3Nb4As3O19.
The electrical measurements were carried with a Hewlett-Packard 4192-A automatic bridge monitored by a HP microcomputer in the frequency range 0.01–13000 kHz at (300 – 620 °C) temperature range. More details concerning the preparation of the samples are given in previous work (Chérif et al., 2019). In order to study the electric properties of this compound, we have modeled the complex impedance spectra using Zview software (ZView Version 3.1c, 1990 - 1997) and the best fit is obtained when employing an equivalent electrical circuits formed by a parallel combination of bulk resistance and CPE; which is the non-ideal capacitor usually known as constant phase element (Anantha and Hariharan, 2005).
Bond Valence Sum Vi(x, y, z) is calculated for a grid of points (x, y, z) starting from Na1, Na2, Na3, Na4, Na5, Na6, Na7 and Na8 crystallographic positions (4a, 4a, 4a, 4a, 8c, 8c, 8c and 8c respectively) as determined by X-ray diffraction. Analysis occurred along initial migration directions such as [1 0 0], [0 1 0] and [0 0 1] towards crystallographic sites, following the lowest bond valence sum Vi(x, y, z). Points in this valence map with the lowest Vi(x, y, z) values correspond to stable positions; the highest values are associated with bottlenecks.
3 Results and discussion
3.1 Impedance spectroscopy analysis
The electrical properties of Na3Nb4As3O19 compound have been investigated using complex impedance spectroscopy.
Fig. 2 shows the variation of real part of the impedance (Z′) with frequency at different temperatures. We note that the value of Z′ decreases with rise of both frequency and temperature which suggests an increase in the ac conductivity (Saif and Poopalan, 2011).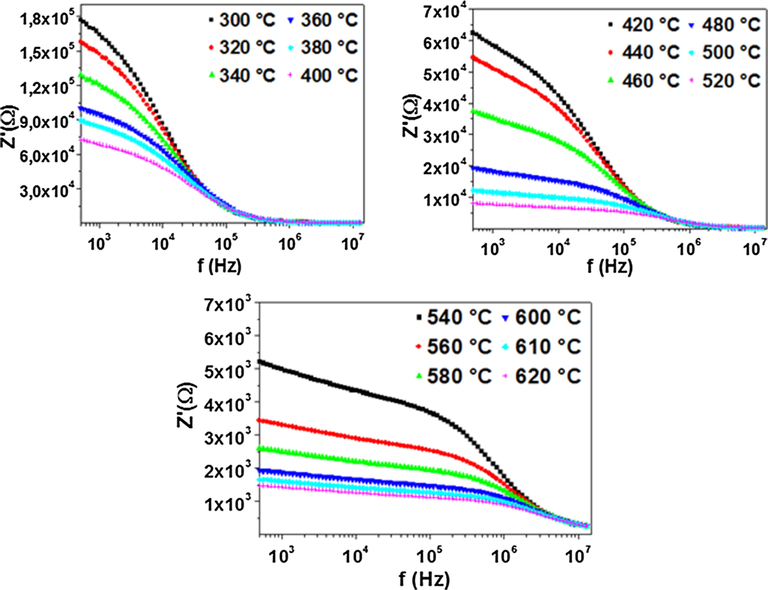
Frequency dependence of real part of the impedance at different temperatures.
At low frequency, the values of Z′ decrease with rise in temperature showing behavior similar to that of semiconductors (Suman et al., 2006). However, for all temperatures and at high frequency, the Z′ values merge and then become independent of frequency, this is may be due to the release of space charge resulting from the reduction in barrier properties of the material (Postnikov et al., 1970).
The variation of the imaginary part of the impedance (- Z″) as a function of frequency at different temperatures is shown in Fig. 3. We observe the presence of one broad asymmetric peak at each temperature, the Z″ values increased with the frequency, reached a maximum (- Z″max) and then decreased. Add to this, - Z″max values shifted to higher frequency when the temperature rises. This is an indication of the temperature dependency of the relaxation time in such polycrystalline sample (Mhamdi et al., 2014).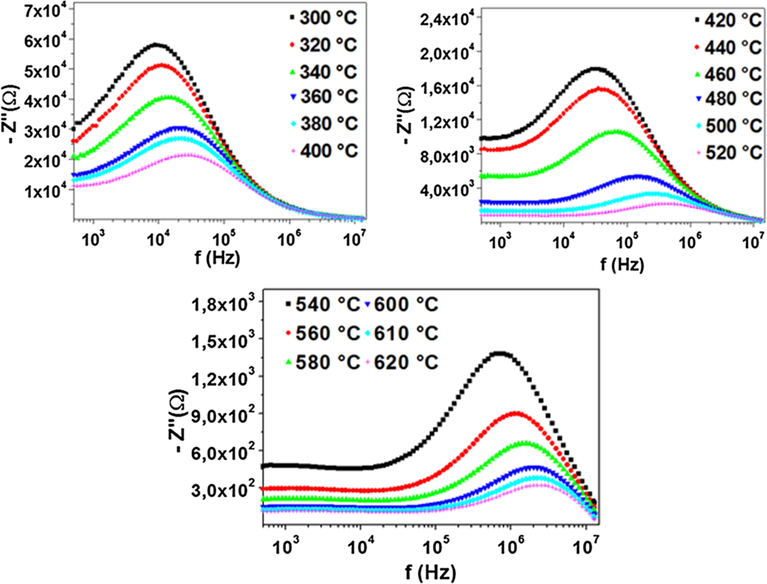
Variation of the imaginary part of the impedance as a function of frequency at several temperatures.
The normalized spectra of the imaginary part of impedance (Z″ / Z″max) as a function of frequency are represented in Fig. 4. The presence of a single relaxation peak indicates a thermally activated process that passes though a maximum at τ which is the relaxation time (Liu et al., 2008, 2009; Dang et al., 2016, 2017). τ is calculated using the formula (1):
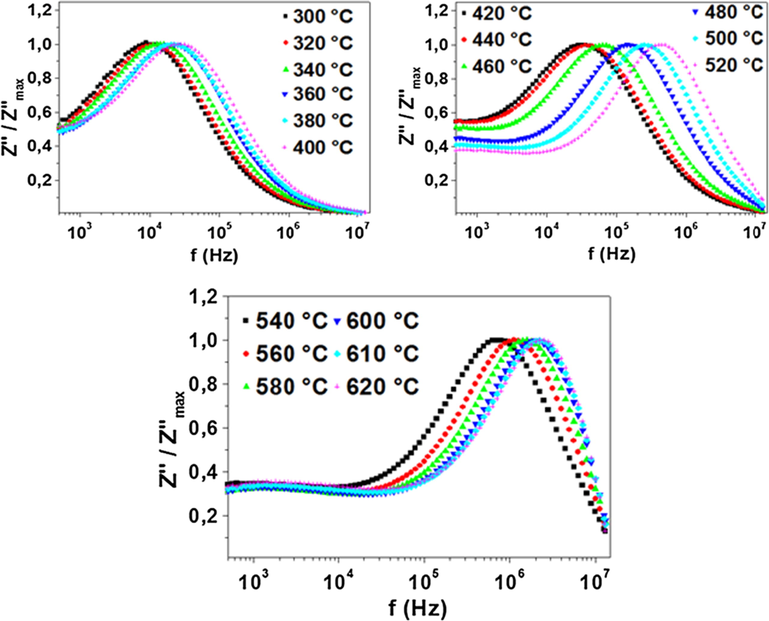
Normalized imaginary part of impedance Z″ / Z″max for Na3Nb4As3O19 compound as a function of frequency at the temperature range 300 – 620 °C.
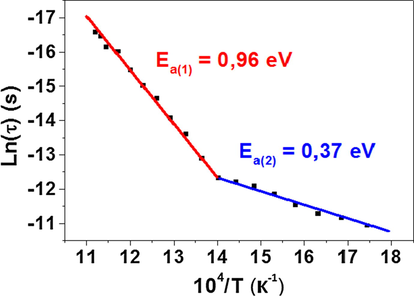
Arrhenius plot of Ln (τ) versus 104 / T.
The activation energies were calculated from the slope and were found to be: Ea(1) = 0.96 eV and Ea(2) = 0.37 eV at high and low temperatures respectively. It is noteworthy that the activation energy values deduced from relaxation time are equal to those inferred from conductivity analysis (Chérif et al., 2019).
3.2 Dielectric study
The dielectric response in a solid material can be described by expressing the relative dielectric constant as a complex quantity made up of a real and an imaginary components: ε* = ε′ – j ε″, where ε′ and ε″ are respectively the real and imaginary part of the dielectric constant, representing the amount of energy stored in a dielectric material as polarization and the energy loss, while applying an electric field (Hassan et al., 2012; Xie et al., 2019, 2020; Shi et al., 2019).
The real part of the dielectric constant (ε′) can be calculated from complex impedance data by using the relation (3):
The imaginary part of the dielectric constant (ε″) can be obtained by the Eq. (4):
Fig. 6 shows the frequency dependence of ε′ at different temperatures from 300 to 620 °C.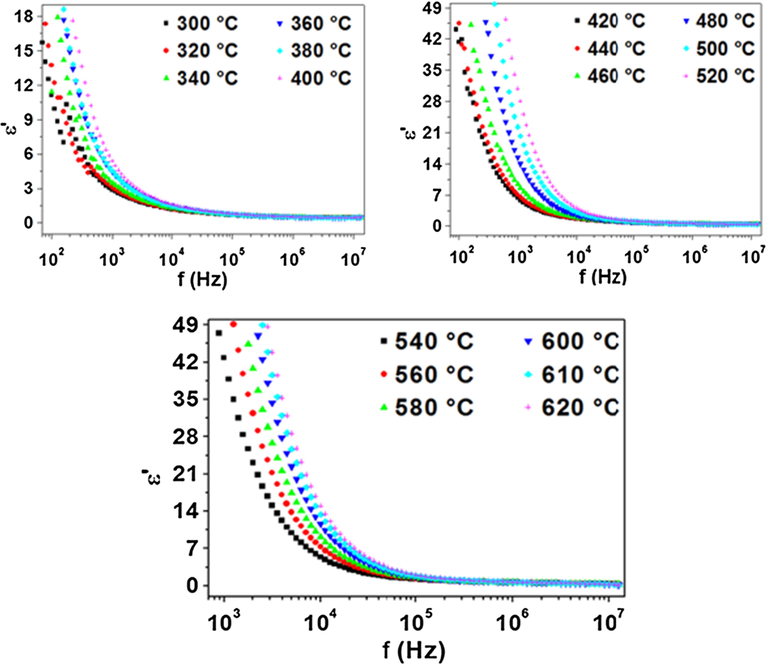
Frequency dependence plot of real part of dielectric constant.
First, at constant temperature, the dielectric constant decreases with the increase of frequency. This behavior can be assigned to the fact that, at low frequencies, all types of polarizations contribute to the dielectric constant value, as deformational polarization (electronic, ionic) and relaxation (orientation and interfacial). We note that, at low frequencies, the orientation and interfacial polarizations are very important. Add to this, for all temperatures, the ε′ values merge at higher frequency, this is may be due to electronic and ionic polarizations which are temperature independent. At high frequency, ε′ reached a constant value due to interfacial polarization.
Second, at constant frequency, the dielectric constant increases with the increase of temperature. This behavior can be explained by the fact that the dipoles cannot orient themselves at low temperatures. When the temperature increased, the orientation of dipoles is facilitated, which tends to an increase in dielectric constant value.
Fig. 7 shows the frequency dependence of ε″ at different temperatures from 300 to 620 °C. ε″ decreases by increasing frequency, at constant temperature and increases by increasing temperature at constant frequency. The imaginary part of dielectric constant consists of the contribution for the dc conduction at low and moderate frequencies. When the temperature increases the conductivity increases which leads to the high value of the dielectric constant, ε″. This is in agreement with the relation (5):
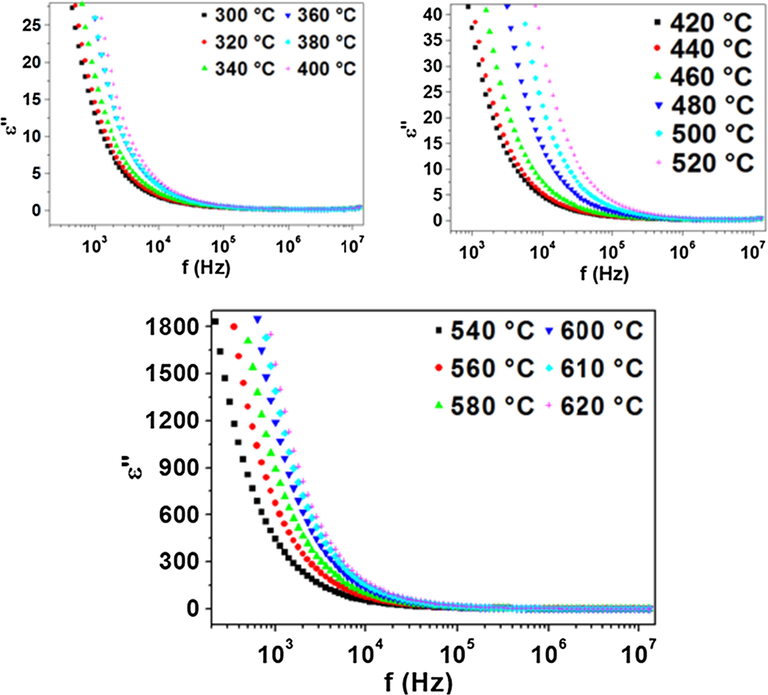
Frequency dependence plot of imaginary part of dielectric constant.
3.3 Electrical modulus analysis
The electrical modulus formalism is used to study the electrical relaxation mechanism in ion conducting materials (Mtioui et al., 2015). The advantage of this formalism is that the electrode polarization effects are suppressed.
The electrical modulus can be expressed using the relation (Soares et al., 2006) (6):
The real and the imaginary parts of the complex electrical modulus were calculated using the following expressions: M′ = – ωC0Z″ and M″ = ωC0Z′.
Fig. 8 shows the frequency dependence of the real part of electric modulus (M′) at different temperatures. It was observed that, at low frequencies, M′ approaches to zero at all temperatures which indicates that electrode polarization makes a negligible contribution (Chatterjee and Gupta, 2012). However, at higher frequencies, M′ displays a maximum value. The dispersion in between these frequencies may be due to the conductivity relaxation process (Dutta et al., 2008). A continuous dispersion on increasing frequency may be due to the short range mobility of charge carriers (Behera et al., 2007).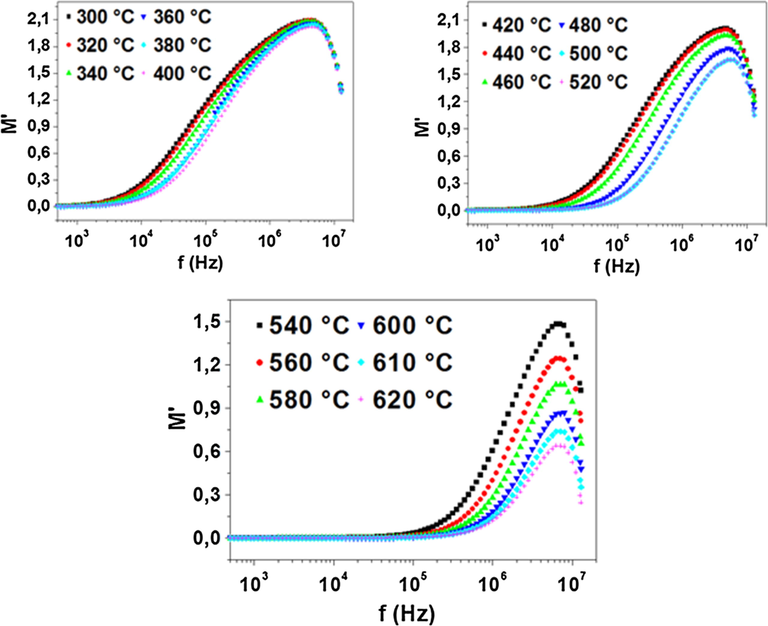
Frequency dependence of real part of electric modulus.
The variation of the imaginary part of electric modulus (M″) as a function of frequency at several temperatures is shown in Fig. 9. The plots of this figure are characterized by the presence of relaxation peak. The peak shifts toward to higher frequency as the temperature is raised. The observed asymmetry in peak broadening indicates the spread of relaxation time with different time constant which supports the non-Debye type of relaxation in the material (Kaur et al., 2016).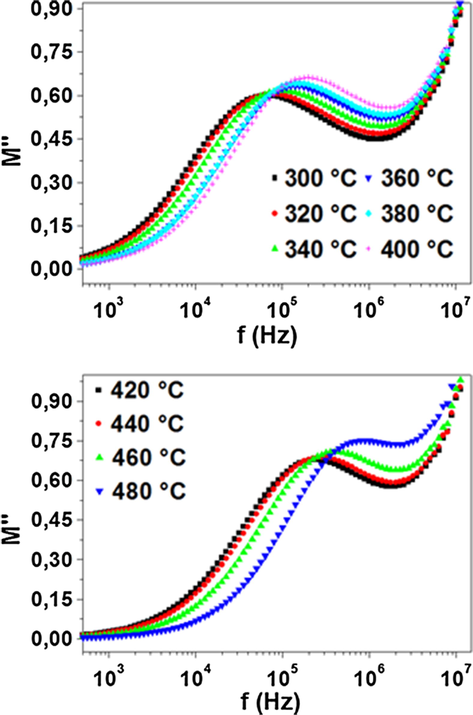
Frequency dependence of the imaginary part of electric modulus.
The value of the peak frequency fmax has been determined for each temperature, the variation of Ln(fmax) as a function of temperature is shown in Fig. 10. It appears to satisfy the Arrhenius law governed by the relation (7):
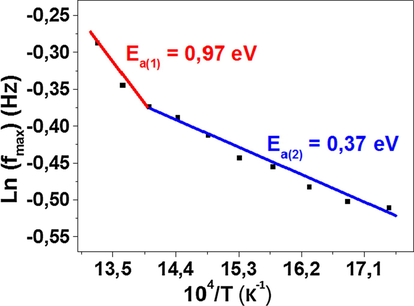
The variation of Ln(fmax) versus 104 / T.
Values of Ea calculated from conductivity and from the modulus spectra are close, suggesting that the mobility of the charge carrier is probably due to a hopping mechanism (Sahoo et al., 2013; Ren et al., 2019).
Fig. 11 shows the frequency response of – Z″ and M″ at T = 300 °C. For an ideal Debye type relaxation with long-range movement of charge carriers, the fmax values of both impedance and modulus plots at any temperature should coincide. From these plots, this is not the case for our sample, thus a non-Debye relaxation is confirmed with short-range movement of charge carriers (Cao and Gerhardt, 1990).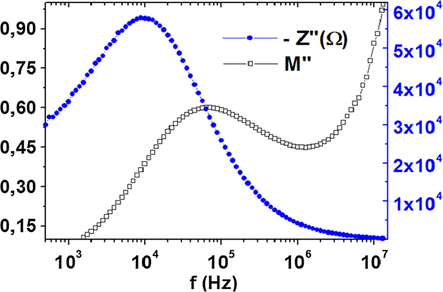
Frequency response of M″ and – Z″ at 300 °C.
3.4 Electrical conductivity analysis
Ac conductivity measurement is an important tool for studying the ionic transport properties of materials. It’s calculated using the following relation (8):
Fig. 12 shows the frequency dependence of the ac conductivity for Na3Nb4As3O19 at different temperatures. It exhibits the typical behavior of ionic materials: the conductivity is found to be frequency independent in the low frequency (dc plateau) which increases with the increase of the frequency. The phenomenon of the conductivity dispersion is generally analyzed using the Jonscher’s universal power law (Jonscher, 1991) (9):
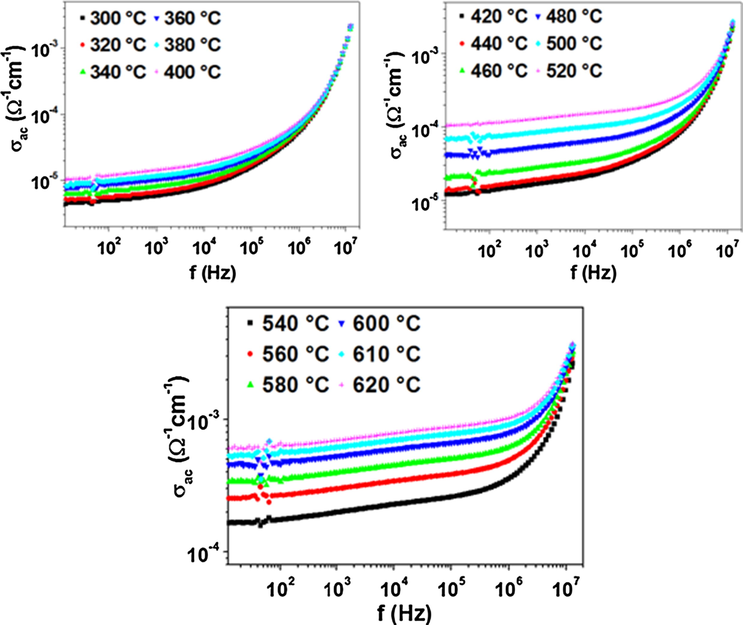
Frequency dependence of the ac conductivity at various temperatures in a log-log scale.
Using the value of the conductivity at 100 Hz, as presented in Fig. 13, it was found that the conductivity exhibits a thermally activated behavior (Khan and Hogarth, 1991) in accordance with the Arrhenius relation (Hummel, 1998) (10):
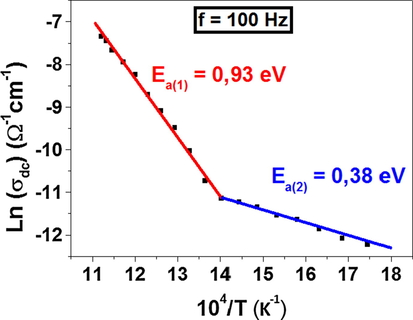
The variation of Ln(σdc) versus 104 / T.
There are two linear regions with two different slopes. The values of Ea have been determined from the slope of two straight lines of two different temperature regions. The obtained values are: Ea(1) = 0.93 eV and Ea(2) = 0.38 eV at high and low temperatures respectively.
3.5 Conduction pathway proposed from Bond valence Sum
The BVS (Brown, 1987) model finds one of its applications in the correlation between crystal structure and its ionic conductivity properties. It allows to identify the mobile species and to propose conduction mechanisms. This model was used with success to determine the migration pathways of different species such as lithium ion in Li2/3-xLa3xTiO3 (Mazza et al., 2002), LiLa(PO3)4 (Ferhi et al., 2012), sodium ion in NaCo2As3O10 (Ben Smida et al., 2015), Na4Co5.63Al0.91(AsO4)6 (Marzouki et al., 2013), Na3.5Cr1.83(AsO4)3 (Fakhar Bourguiba et al., 2014), NaLuP2O7 (Béjaoui et al., 2014), Ag1.6Na1.4Al2(AsO4)3 (Fakhar Bourguiba et al., 2012), NaHoP2O7 (Béjaoui et al., 2013), silver ion in Ag3Nb(NbO)2O4(AsO4)2 (Ben Amor et al., 2008), Ag1.6Na1.4Al2(AsO4)3 (Fakhar Bourguiba et al., 2012) and potassium ion in KFeAs2O7 (Ouerfelli et al., 2007).
The variation of the valence as a function of the distance traveled by Na+ cations in our compound Na3Nb4As3O19 is reported in Fig. 14. The BVS analysis shows that the initial valence of Na1, Na2, Na3, Na4, Na5, Na6, Na7 and Na8 cations is respectively 0.96, 1.03, 1.06, 1.11, 0.78, 0.78, 0.76 and 0.75 v.u (valence unit). This value is relatively high for Na4 which shows that the mobility of this cation should be low compared to the other cations. Furthermore, the mobility of all cations is easy along the [0 0 1] direction, the direction of the tunnels. Indeed, the maximum valence reached according to this direction for Na1, Na2, Na3, Na4 and Na5 cations is respectively 1.18, 1.34, 1.17, 1.34 and 0.78 v.u for migration distance in the order of 10 Å. For Na6, Na7 and Na8, the maximum valence is 0.8 v.u for migration distance in the order of 8, 8.8 and 9.5 Å respectively.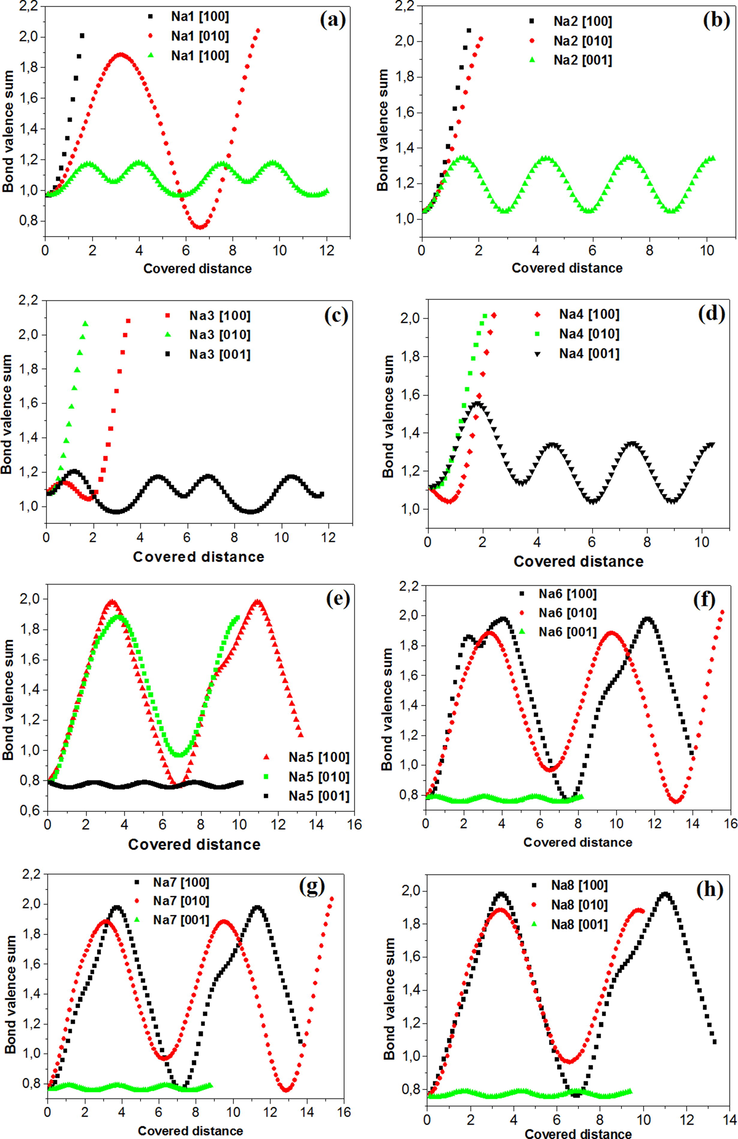
Bond valence sum for sodium ions: (a) Na1, (b) Na2, (c) Na3, (d) Na4, (e) Na5, (f) Na6, (g) Na7 and (h) Na8 versus the covered distance.
Along [1 0 0] and [0 1 0] directions, the Na2, Na3 and Na4 ions motion seems difficult and the cations reach quickly bottlenecks: Vumax attains a value more than 2 v.u for short distances which does not exceed 2 Å. The same finding was observed for Na1 cation along a cell direction.
For Na5, Na6, Na7 and Na8 cations, their mobility is not easy along [1 0 0] and [0 1 0] directions: these cations reach quickly bottlenecks: Vumax attains a value more than 1.8 v.u for migration distance in the order of 11 Å. The same finding of Vumax was observed for Na1 cation along b cell direction, but for migration distance in the order of 3 Å.
BVS analysis was in agreement with the suggestions derived from the data of structural study. In fact, the most probable conduction pathway is hence along [0 0 1] direction: direction of the two kinds of tunnels where Na+ cations are located. The BVS modeling results can materialize the migration paths in the probable directions. These pathways are shown in Fig. 15.![Schematic representation of the sodium conduction pathways along the [0 0 1] direction.](/content/184/2020/13/6/img/10.1016_j.arabjc.2020.04.003-fig15.png)
Schematic representation of the sodium conduction pathways along the [0 0 1] direction.
4 Conclusion
This work covers some physical properties of Na3Nb4As3O19 compound obtained via a solid state reaction at 800 °C. Dielectric relaxation, modulus behavior and conduction mechanism have been investigated in terms of both temperature and frequency. The non-coincidence of peaks corresponding to modulus and impedance indicates deviation from Debye-type relaxation. The values of the activation energy of the compound (calculated from both impedance and modulus spectra) are very similar, suggesting that the relaxation process may be attributed to the same type of charge carriers. On the basis of BVS analysis, we can conclude that the transport properties in this material appear to be due to Na+ ions movement along c direction. The movement along [1 0 0] and [0 1 0] directions seems to be difficult.
Acknowledgements
This work is supported by the Ministry of Higher Education and Scientific Research of Tunisia.
References
- Ac conductivity analysis and dielectric relaxation behaviour of NaNO3-Al2O3 composite. Mater. Sci. Eng, B. 2005;121:12-19.
- [Google Scholar]
- Novel olivine and spinel LiMAsO4 (M = 3d-metal) as positive electrode materials in lithium cells. Solid State Ionics. 2006;177:2625-2628.
- [Google Scholar]
- Study of complex impedance spectroscopic properties of LiBa2Nb5O15 ceramics. Mater. Chem. Phys.. 2007;106(2):193-197.
- [Google Scholar]
- Ionic conduction, bond valence analysis of structure–property relationships of NaHoP2O7. J. Solid State Chem.. 2013;204:224-232.
- [Google Scholar]
- Crystal structure, physical properties and bond valence analysis of NaLuP2O7. Solid State Sci.. 2014;31:46-53.
- [Google Scholar]
- Etudes physico-chimiques des arséniates de niobium Ag3Nb(NbO)2O4(AsO4)2 et NaCa1.5(NbO)2O2(AsO4)2, simulation des chemins de conduction ionique. J. de la Société Chimique de Tunisie.. 2008;10:83-92.
- [Google Scholar]
- Synthesis, structural and electrical properties of a new cobalt arsenate NaCo2As3O10. J. Solid State Chem.. 2015;221:132-213.
- [Google Scholar]
- Crystal structure of the arsenate NaNb4O9AsO4. A framework structure with diffusion pathways. Euro. J. Solid State Inorg. Chem.. 1998;35:473-482.
- [Google Scholar]
- Recent developments in the bond valence model of inorganic bonding. Phys. Chem. Miner.. 1987;15:30-34.
- [Google Scholar]
- Calculation of various relaxation times and conductivity for a single dielectric relaxation process. Solid State Ionics. 1990;42:213-221.
- [Google Scholar]
- Nanocomposite films dispersed with silica nanoparticles extracted from earthworm humus. J. Non-Cryst. Solids.. 2012;358:3355-3364.
- [Google Scholar]
- Synthesis, structural study, IR spectroscopy characterization and ionic behavior of Ag0.62K0.38Nb4AsO13. J. de la Société Chimique de Tunisie.. 2011;13:179-190.
- [Google Scholar]
- Synthesis, crystal structure and properties of a new compound, K8Nb7As7O39. Jordan J. Chem.. 2012;7:401-412.
- [Google Scholar]
- Conductivity study by complex impedance spectroscopy of Na3Nb4As3O19. Arab. J. Chem.. 2019;12:3309-3315.
- [Google Scholar]
- Dielectric relaxation behavior and mechanism of Y2/3Cu3Ti4O12 ceramic. J. Adv. Dielectr.. 2017;88:320-329.
- [Google Scholar]
- Influence of interface point defect on the dielectric properties of Y doped CaCu3Ti4O12 ceramics. J. Adv. Dielect.. 2016;6(1):1650009.
- [Google Scholar]
- Ac conductivity and dielectric relaxation in ionically conducting soda-ime-silicate glasses. J. Non-Cryst. Solids.. 2008;354:3952-3957.
- [Google Scholar]
- Le nouvel arséniate Ag1. 6Na1.4Al2(AsO4)3: synthèse, études structurale et électrique, simulation des chemins de conduction ionique. J. de la Société Chimique de Tunisie.. 2012;14:201-211.
- [Google Scholar]
- Crystal Structure, Charge-Distribution and Bond-Valence-Sum Investigations of a Novel Arsenate Na3.5Cr1.83(AsO4)3. J. Adv. Chem.. 2014;10(9):3160-3170.
- [Google Scholar]
- Synthesis, crystal structure and ionic conductivity of a new open-framework arsenate K0.405Bi0.865AsO4. J. Alloys Compd.. 2015;653:321-326.
- [Google Scholar]
- Synthesis and crystal structure of NaNb2AsO8. J. Solid State Chem.. 1994;113:367-372.
- [Google Scholar]
- Structural and frequency dependent dielectric properties of Fe3+ doped ZnO nanoparticles. Mater. Res. Bull.. 2012;47:3952-3958.
- [Google Scholar]
- Synthèse et structure cristalline de Na3NbO(AsO4)2. J. Solid State Chem.. 1999;144:53-61.
- [Google Scholar]
- Electronic Properties of Materials. New York: Springer; 1998.
- A new understanding of the dielectric relaxation of solids. J. Mater. Sci.. 1991;16:2037-2060.
- [Google Scholar]
- AC Impedance Spectroscopy, Conductivity and Optical Studies of Sr doped Bismuth Ferrite Nanocomposites. Int. J. Electrochem. Sci.. 2016;11:4120-4135.
- [Google Scholar]
- The behaviour of SiOx/SnO thin dielectric films in an alternating electric field. J. Mater. Sci.. 1991;26:17-22.
- [Google Scholar]
- Effects of Na/K evaporation on electrical properties and intrinsic defects in Na0.5K0.5NbO3 ceramics. Mater. Chem. Phys.. 2009;117:138-141.
- [Google Scholar]
- Dc-bias-field-induced dielectric relaxation and ac conductionin CaCu3Ti4O12 ceramics. Phil. Mag.. 2008;4:537-545.
- [Google Scholar]
- Structure, sintering and electrical properties of new ionic conductor Ag4Co7(AsO4)6. J. Alloys Compd.. 2014;586:74.
- [Google Scholar]
- Étude physico-chimiques du monoarséniate mixte Na4Co5,63Al0,91(AsO4)6 et simulation des chemins de conduction. Ann. Chim. – Sci. Mat.. 2013;38:117-129.
- [Google Scholar]
- Modeling Li-ion conductivity in fast ionic conductor La2/3-xLi3xTiO3. Solid State Ionics. 2002;149(1–2):81-88.
- [Google Scholar]
- Study of nickel doping effects on structural, electrical and optical properties of sprayed ZnO semiconductor layers. J. Alloys Compd.. 2014;582:810-822.
- [Google Scholar]
- Thermal behavior and dielectric and vibrational studies of Cs2(HAsO4)0.32(SO4)0.68·Te(OH)6. Ionics. 2015;21:411-420.
- [Google Scholar]
- Synthesis, crystal structure and electrical properties of a new iron arsenate Na2.77K1.52Fe2.57(AsO4)4. J. Alloys Compd.. 2015;651:616-622.
- [Google Scholar]
- The iron potassium diarsenate KFeAs2O7 structural, electrical and magnetic behaviors. J. Solid State Chem.. 2007;180:2942-2949.
- [Google Scholar]
- Internal friction in ferroelectrics due to interaction of domain boundaries and point defects. J. Phys. Chem. Solids.. 1970;31:1785-1791.
- [Google Scholar]
- Dielectric relaxation behavior induced by lithium migration in Li4Ti5O12 spinel. J. Alloys Compd.. 2019;793:678-685.
- [Google Scholar]
- Frequency and temperature dependent electrical characteristics of CaTiO3 nano-ceramic prepared by high-energy ball milling. J. Adv. Ceram.. 2013;2(3):291-300.
- [Google Scholar]
- Effect of the film thickness on the impedance behavior of sol-gel Ba0.6Sr0.4TiO3 thin films. Phys. B. 2011;406:1283-1288.
- [Google Scholar]
- Design and performance of doped carbon nanotube-bases thermoelectric devices. J. Alloys Compd.. 2019;804:262-271.
- [Google Scholar]
- Dielectric behavior of polyaniline synthesized by different techniques. Eur. Polym. J.. 2006;42:676-686.
- [Google Scholar]
- Complex impedance studies of tungsten–bronze electroceramics: Pb2Bi3LaTi5O18. J. Mater. Sci.. 2006;41(2):369-375.
- [Google Scholar]
- ZView Version 3.1c Scribner Associates, Inc. Written by Derek Johnson, (1990 - 1997).
- Tunneling-induced negative permittivity in Ni/MnO nanocomposites by a bio-gel derived strategy. J. Mater. Chem. C. 2020;8:3029-3039.
- [Google Scholar]
- Targeted double negative properties in silver/silica random metamaterials by precise control of microstructures. Res. Article. 2019;2019:1021368.
- [Google Scholar]


