

Translate this page into:
Activated carbon blended with grape stalks powder: Properties modification and its application in a dye adsorption
⁎Corresponding author. r-davarnejad@araku.ac.ir (Reza Davarnejad)
-
Received: ,
Accepted: ,
This article was originally published by Elsevier and was migrated to Scientific Scholar after the change of Publisher.
Peer review under responsibility of King Saud University.
Abstract
In this study, activated carbon was blended with grape stalks powder to adsorb methylene blue (MB) dye with various concentrations from a wastewater. For this purpose, five independent variables involving pH (2–13), contact time (5–270 min), grape stalks powder dosage (0.1–10 g/l), methylene blue initial concentration (20–300 mg/l), and activated carbon dosage (0.1–10 g/l) for methylene blue adsorption were studied. The Central Composite Design (CCD) under Response Surface Methodology (RSM) was applied to estimate the independent variables effects on the methylene blue adsorption. The pseudo- first order, pseudo-second order, Elovich and intraparticle diffusion models were employed to study the adsorption kinetics and isotherm. The Langmuir, Freundlich, Temkin and Dubinin-Radushkevich isotherm models were applied to investigate the adsorption isotherm. It was concluded that the intraparticle diffusion isotherm and pseudo-second order kinetic models could show the best results. Furthermore, some data such as physical adsorption (by analyzing FTR and applying some standard equations) and mean free energy (E) were discovered in this research. Finally, activated carbon blended with grape stalks powder as an effective bio-adsorbent for the methylene blue reduction from a wastewater was introduced.
Keywords
Adsorption
Biomass
Methylene blue
Wastewater

1 Introduction
The toxic substances into the lakes, rivers, currents, oceans and other aquatic ecosystems which are associated with dissolution, deposition and sedimentation on the beds affect the water quality. The pollutants may affect groundwater resources, as well (Maučec et al., 2018; Arami et al., 2005; Zhu et al., 2004; Ayyappan et al., 2005).
Dyes as the organic materials are the most commonly used in the various applications such as ink production and textile industries (Jadhav and Singhal, 2013; Moussavi and Khosravi, 2011), rubber and plastics (Barros et al., 2014), cosmetics (Dahlan et al., 2017), paper industry (Abbott et al., 2015), leather industry (Huang et al., 2015), tannery (Krishni et al., 2014), food processing (Datta et al., 2013), and pharmaceutical industry (Royer et al., 2009). In fact, dyes can reduce light penetration and assist the photosynthesis process in the water resources (Royer et al., 2009; Lima et al., 2008). Therefore, dyes have negative effects on the water quality (Royer et al., 2010; Brookstein, 2009; de Lima et al., 2007; Carneiro et al., 2010).
The cationic dyes generally are in the form of hydrochloric compounds such as terphenyls, thiazines, oxazines and azines. One of the most important of cationic dyes is methylene blue (C16H18N3SCl) which belongs to the thiazines (Han et al., 2008; Wang et al., 2005; Xiao et al., 2015). However, this widely uses to various industries but, it cases the several diseases. Therefore, the dyes removal recently is one of the great environmental challenges (Gupta et al., 2004; Tsai et al., 2009; Sen et al., 2011).
Some methods used in the dyes removal from wastewater are oxidation, photochemical degradation, ion exchange, reverse osmosis, ion exchange, membrane filtration, conventional coagulation and chemical precipitation (Dawood and Sen, 2012; Mahmoodi et al., 2011; Ciardelli et al., 2001). Most of them are expensive and produce hazardous materials. Adsorption process is low cost, efficient and easy in design and operation (Yagub et al., 2012; Mahmoodi, 2015; Saadati and Makvandya, 2016).
Activated carbon is widely used due to having high adsorption capacity. Currently, abundant, low-cost and efficient bio-adsorbents such as agricultural wastes have been encouraged for wastewater treatment (Mahmoodi, 2015; Zietzschmann et al., 2016; Malik, 2004; Bulut and Aydın, 2006; Guo et al., 2012; Baccar et al., 2013). Activated carbon and related materials such as graphene and carbon nanotubes were used in many adsorption processes due to having active surfaces. Another advantage of activated carbon and its derivatives is its participation during activation process of peroxide oxidants such as H2O2, persulfate and peracetic acid. The activation process can strongly produce the reducing free radicals. So, they are widely used as catalysts support which can effectively degrade some organic pollutants in aqueous environments (Xue et al., 2018a,b).
Grape stalks are an agricultural waste which is abundantly found in Iran and some countries. Since, they are containing several functional groups such as tannins, resins, tartrate, potassium and organic acids (Portinho et al., 2017), they can be blended with activated carbon without further processing to modify its properties. Furthermore, grape stalks have several functional groups. In fact, they make them more applicable for the cationic dyes (such as methylene blue) adsorption and was used in this research. Furthermore, various parameters such as initial methylene blue concentration, initial solution pH, contact time and adsorbent dosage were considered. Moreover, the applied bio-adsorbent was characterized and its functional groups were carefully studied by Fourier Transform Infrared Spectroscopy (FTIR). The Scanning Electron Microscope (SEM) was applied to consider its morphology during the adsorption process. UV–Vis spectrophotometer was used to investigate the methylene blue percentage in a wastewater (before and after adsorption process).
2 Materials and methods
2.1 Chemicals and instrumentation
The grape stalks were washed, dried, grinded and powdered. Then, the produced powder was analyzed by Tyler standard screens (with mesh of 100 µm). The solutions with concentrations of (20–300 mg/l) were prepared by dissolving methylene blue [supplied by Merck Co. with molar mass of 319.86 g.mol−1 (anhydrous)] in the distilled water. All of the batch tests were done in a beaker with volume of 250 cm3. pH was set by 0.1 M HCl and 0.1 M NaOH, and controlled by a pH-meter (model: Lutron 206, Taiwan). The adsorbent with various dosages was used for different solutions at various times, pHs and at ambient temperature (25 ± 0.5 °C). The experiments were initially designed by Design-Expert software (version: 11). After each run, the solid phase was separated by the cellulose nitrate filter [Whatman, England (S&S 5891)]. A standard solution of methylene blue was made to find maximum adsorption [during scanning a range of wavelengths (400–700 nm)]. The UV–Vis spectrophotometer (model: SPECORD 250, Czech) showed a maximum peak at 664 nm. The methylene blue concentrations (before and after each run) were determined by the UV–Vis spectrophotometer at 664 nm. A calibration chart was provided (adsorption versus methylene blue concentration data) to find each sample concentration.
Fourier Transform Infrared apparatus (FTIR spectrometer, Unicam 5000, Japan) was employed to study the functional groups of adsorbents. Morphology of the adsorbents was also analyzed by scanning electron microscope (model: AIS2100, Seron Technology). It uses a focused beam of high-energy electrons to generate a variety of signals at the surface of solid specimens.
Finally, the methylene blue removal percentage was calculated by some routine equations as reported in the literature (Chowdhury and Saha, 2010; Olivella et al., 2011).
2.2 Experiments design and statistical analysis
Central Composite Design (CCD) is one of the most common techniques from the Responses Surface Methodology (RSM). It is a useful and practical method for designing, minimizing and considering the experiments. This method has a good potential to predict response(s) and optimize the operating conditions (Davarnejad et al., 2018; Konicki et al., 2017; Peng et al., 2014; Gusmão et al., 2012; Pang et al., 2017; Rahimdokht et al., 2016).
Table 1 shows five independent variables in four surfaces including pH, time (min), grape stalks powder dosage (g/l), initial concentration of methylene blue (MB) (mg/l) and activated carbon dosage (g/l). Then, the regression analysis was done to determine the response model coefficients and standard error by applying the Design of Expert software. The process response and variables can be modeled by a quadratic equation. The quality of the fitness of the model equation is assessed by R2 and adjusted R2. The adjusted R2 modifies the value of R2 for the sample amount and the number of expressions in the model.
Variable
Levels
−1
0
+1
pH
2.00
7.50
13.00
MB initial concentration (mg/l)
20.00
160.00
300.00
grape stalks powder dosage (g/l)
0.10
5.05
10.00
Contact time (min)
5.00
137.50
270.00
Activated carbon dosage (g/l)
0.10
5.05
10.00
2.3 Adsorption studies
The percentage removal of methylene blue at ambient temperature and adsorbent mass of 9 g was measured at different initial methylene blue solution concentrations based on the following equation:
The equilibrium amount of adsorbed methylene blue was investigated according to the following equation:
2.4 Adsorption kinetics
Adsorption kinetic models are used to inspect the rate of adsorption process and specify rate-controlling step. In the present study, the kinetic data from batch studies were analyzed by pseudo-first order, pseudo-second order, Elovich and intraparticle diffusion kinetic models. The MB adsorption was determined according to the following relation:
3 Results and discussion
3.1 FT-IR analysis
In order to recognize the characteristics of the adsorbent functional groups, the infrared spectroscopy (FT-IR) was performed. According to FT-IR test, the grape stalks powder is containing many active functional groups which are properly able to adsorb the ionic dyes. Fig. 1(a) and (b) show the functional groups of the grape stalks powder and the blends of the grape stalks powder with activated carbon before adsorption process (Davarnejad et al., 2018; Konicki et al., 2017).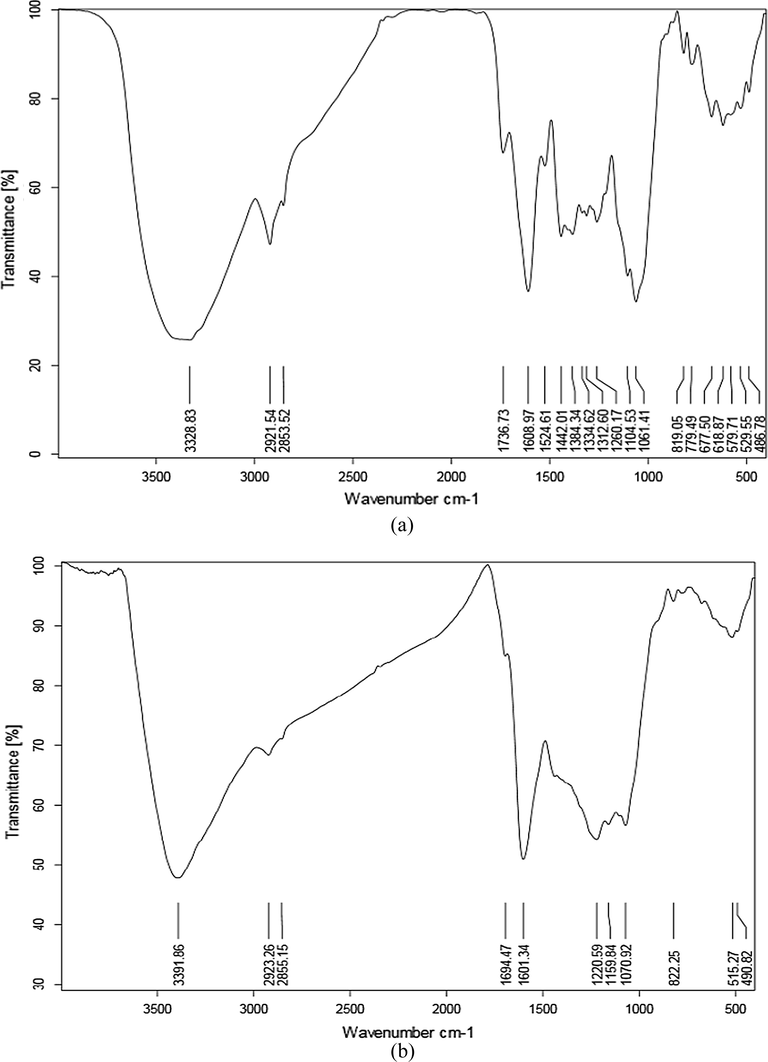
The peaks in the wavelengths of 3328 and 3411 cm−1 are related to hydroxyl group (–OH) and the spectrums from the wavelength of 2853 and 2920 cm−1 are related to the functional group of -C-H (aromatic rings). The wavelengths of 1601 and 1736 cm−1 belong to the functional groups of amines and carbonyl group (C = O), respectively. FT-IR analysis after adsorption process indicates that there are some changes in the adsorption peaks. Fig. 2(a) and (b) show functional groups change in the pure grape stalks powder and grape stalks powder blended with activated carbon after the MB adsorption (Davarnejad et al., 2018; Konicki et al., 2017). As shown in these figures, an increment in the wavelengths of peaks affects methylene blue removal. Since there were no considerable changes in the peaks during the adsorption process, it is concluded that the process may be as a physical one.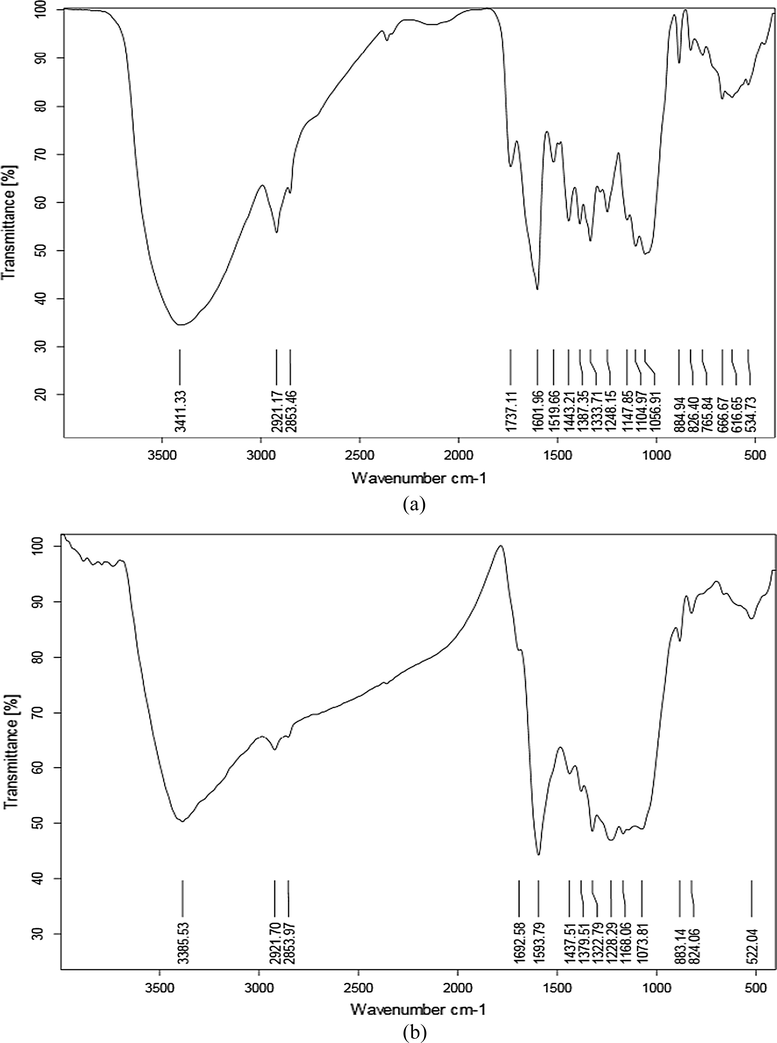
3.2 SEM analysis
SEM analysis is a useful test for the adsorbent surface structure attention. The SEM images of grape stalks powder (without activated carbon and with activated carbon) before adsorption process are shown in Fig. 3(a) and (b), respectively.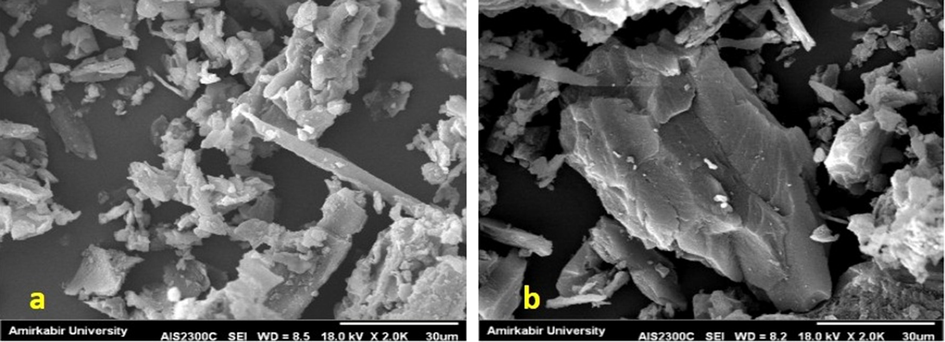
a) SEM of grape stalks powder before adsorption b) SEM of activated carbon blended with grape stalks powder before adsorption.
As shown in these figures, the adsorbent surface is heterogeneous. A heterogeneous surface supplied more available active sites which are more suitable for the adsorption process. This property plays an important role in the MB adsorption. Fig. 4(a) and 4(b) show the internal structure changes for the both adsorbents after the adsorption process obtained from the SEM analysis. However, bio-adsorbents normally have low specific surface area but, they have many functional groups in their structures. The adsorption capacity and removal percentage can be modified with blending with activated carbon due to high porosity of carbon surface and high specific surface area (Portinho et al., 2017; Fiolet al., 2008).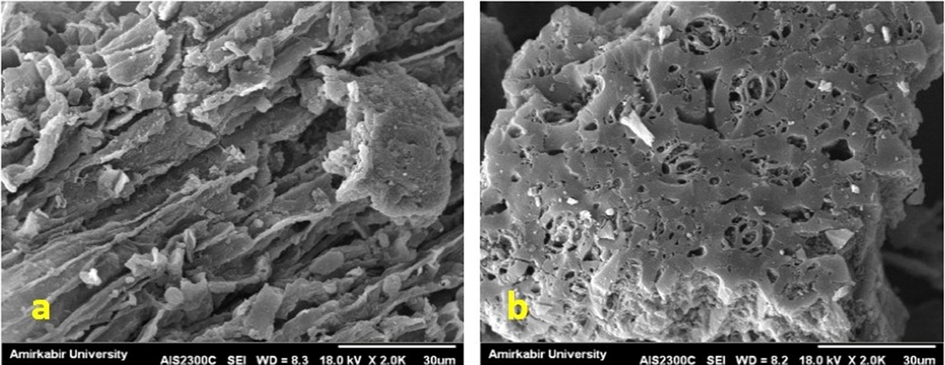
a) SEM of grape stalks powder after adsorption b) SEM of activated carbon blended with grape stalks powder after adsorption.
3.3 Statistical analysis
In order to optimize five independent factors of the present research, twenty six experiments were designed by the software. The matrix related to the parameters and the remained concentrations of MB as a response are shown in Table 2.
Trial No.
pH
MB initial concentration (g/l)
Grape stalks powder dosage (g/l)
Time (min)
Activated carbon dosage (g/l)
Removal (%)
1
7.5
160
5.05
270
5.05
82.32
2
7.5
160
10
137.5
5.05
94.04
3
7.5
160
5.05
137.5
5.05
95.19
4
7.5
160
5.05
5
5.05
98.72
5
2
300
0.1
270
10
99.97
6
7.5
160
5.05
137.5
5.05
95.19
7
13
300
0.1
270
0.1
39.08
8
2
20
0.1
5
0.1
4.300
9
13
160
5.05
137.5
5.05
93.35
10
2
20
10
270
10
97.92
11
2
300
10
5
10
98.99
12
7.5
160
5.05
137.5
5.05
95.19
13
7.5
160
0.1
137.5
5.05
99.87
14
13
20
10
5
10
32.85
15
13
20
0.1
270
10
99. 69
16
7.5
20
5.05
137.5
5.05
43.32
17
7.5
160
5.05
137.5
5.05
95.19
18
13
20
10
270
0.1
40.49
19
7.5
160
5.05
137.5
0.1
85.67
20
7.5
160
5.05
137.5
10
97.15
21
2
300
10
270
0.1
98.50
22
13
300
10
5
0.1
99.88
23
13
300
0.1
5
10
98.65
24
2
160
5.05
137.5
5.05
91.51
25
7.5
300
5.05
137.5
5.05
97.13
26
7.5
160
5.05
137.5
5.05
95.19
where, Y is the remained concentration of MB in the solution after adsorption process. X1, X2, X3, X4 and X5 are pH, initial concentration of MB in the solution (mg/l), activated carbon dosage (g/l), contact time (min) and grape stalks powder dosage (g/l), respectively.
3.4 Effect of parameters on adsorption
The effect of solution pH on the MB adsorption was investigated in the pH range of 2–13. As shown in Fig. 5(a), the adsorption sharply increased with increasing the initial concentration of MB and then stayed almost constant during pHs 7–13.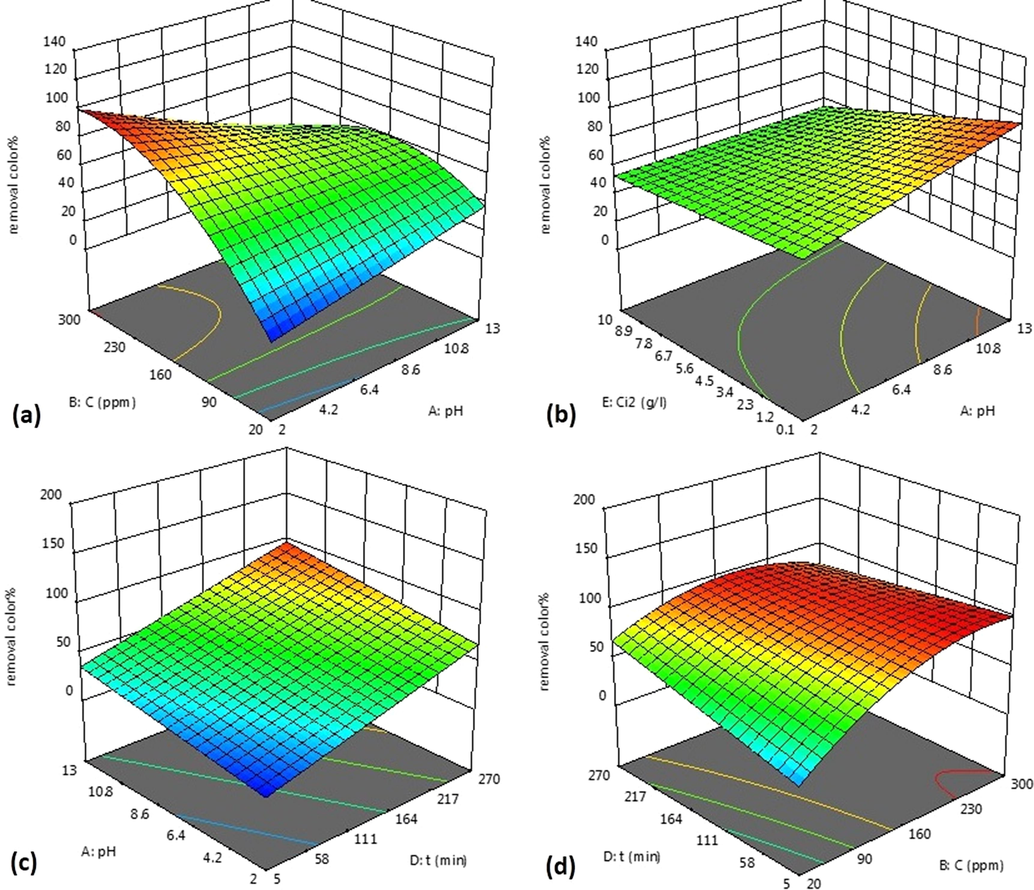
a) Interaction between pH and initial concentration of MB (mg/l) on the MB adsorption process, b) Interaction between pH and grape stalks powder dosage (g/l) on the MB adsorption process, c) Interaction between pH and contact time (min) on the MB adsorption process, and d) Interaction between contact time (min) and initial concentration of MB (mg/l) on the MB adsorption process.
A sharp increase of MB removal was observed at pH range of 2–7. Since MB is a cationic dye, its adsorption was affected by changing in pH of solution. In addition, the low adsorption of aqueous methylene blue at acidic pH may be due to the presence of excess hydrogen ions that compete with dye charge for the available sites. Another possibility is the development of a positive charge on the adsorbent surface in an acidic solution that inhibits the adsorption of dye and reduces the adsorption process.
Fig. 5(b) shows interaction effect of the grape stalks powder dosage and pH on the level of the MB adsorption. As shown in this figure, the grape stalks powder dosage increment (from 0.1 to 10 g) gradually decreased the MB concentration. In general, the number of adsorption sites increases with increasing the adsorbent dosage. In the other words, the adsorbent contact (with the methylene blue charge) increased with the adsorbent dosage enhancement. Furthermore, a slight change in the adsorption percentage was observed with further increment in the grape stalks powder dosage.
Fig. 5(c) shows the effect of pH and contact time on the MB adsorption. As shown in this figure, the rate of adsorption gradually decreased with increasing time. It is due to the internal diffusion of dye molecules into the grape stalks powder which takes time (Peng et al., 2014). In the other words, some active sites decrease, and the surface is saturated.
Fig. 5(d) shows the interaction between the time and initial concentration of MB on the adsorption process. The reaction time is another important factor in the adsorption. As shown in this figure, MB removal increased with reaction time increment because the adsorbent contact time with the dye in the solution increased and adsorption process was completed with time.
3.5 Optimization process
The optimum conditions for 98% of MB removal was statistically obtained at pH of 12.97, MB initial concentration of 299.30 mg/l, grape stalks powder dosage of 9.98 g/l, activated carbon dosage of 0.11 g/l and contact time of 260 min on the blends of grape stalks powder with activated carbon while it experimentally was around 96.50%. This shows good agreement between both data. According to the literature, MB removal percentages with the other bio-adsorbents such as Abelmoschus esculentus seed, Elaeagnus angustifolia and Birnessite respectively were at 86.00, 89.00 and 92% (Pang et al., 2017; Rahimdokht et al., 2016; Santhi and Manonmani, 2009).
4 Adsorption isotherm models
The isotherm study is one of the best ways to explore the structural properties of a material which is chosen as an adsorbent. The equilibrium adsorption of MB on an adsorbent was modeled by some well-known isotherms such as Langmuir, Freundlich, Temkin, and Dubinin-Radushkevitch (D-R). Nonlinear regression analysis was provided to fit the curves of isotherms. Langmuir isotherm equation is as follows:
RL shows suitable conditions based on the Langmuir isotherm model. Adsorption should be favorable when 0 < RL < 1 while adsorption is unfavorable when RL > 1. Adsorption is linear and irreversible when RL is equal to one and zero, respectively (Gusmão et al., 2012).
Freundlich isotherm equation is given by:
Temkin isotherm equation is as:
The Dubinin-Radushkevitch (D-R) model is as:
where, qm (mg/g) is the maximum adsorption capacity, β (mol2/J2) is a coefficient related to the mean free energy of adsorption, and ε is Polanyi potential as:
The constants qm and β are calculated from the intercept and slope of ln qe versus ε2. R (Jmol−1K−1) is the ideal gas constant, and T (K) is the absolute temperature.
E (Jmol−1) is defined as the mean free energy required transferring per mole of ion transferred from dye solution to the surface of adsorbent. E can be calculated by the following equation:
The adsorption process would be physical when E is<8 kJmol−1 while it would be chemical when E is higher than 8 kJmol−1 (Gusmão et al., 2012).
Fig. 6 indicates different isotherm models fitted to the MB adsorption data. Table 3 shows the isotherm models parameters and regression coefficients (R2). According to this table data, Langmuir isotherm model could excellently legitimize the MB adsorption process on the blends of grape stalks powder with activated carbon. Therefore, the MB adsorption process on the applied adsorbent is monolayer and homogeneous although (according to the Temkin isotherm model which showed a good result) the adsorption heat of all molecules in a coated layer (comes from adsorbent interactions) linearly decreased.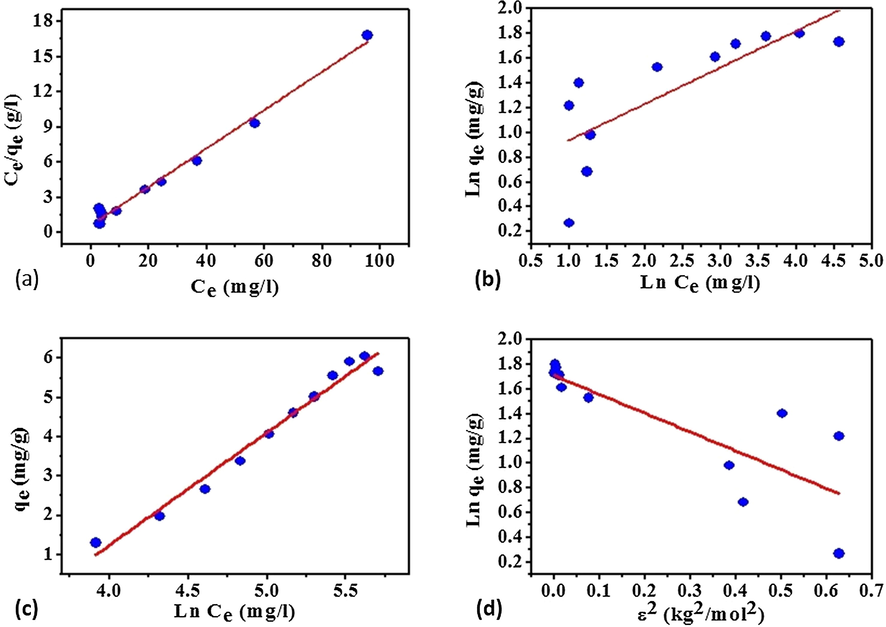
MB adsorption isotherm models: a) Langmuir, b) Freundlich, c) Temkin, and d) Dubinin-Radushkovich (D-R).
Isotherm
Langmuir
Freundlich
Temkin
D-R
Parameters
qmax
KL
R2
n
Kf
R2
B
A
R2
E
qm
R2
Amounts
5.084
0.904
0.990
5.98
2.56
0.615
2.87
0.75
0.974
0.572
5.53
0.660
According to the calculations, the adsorption capacity (qmax) is equal to 5.084 (mg/g) and KL is equal to 0.9043 (1/mg). 1/n is equal to 0.1672 (<1) which shows the favorability of the adsorption process. The separation factor (RL < 1) indicates that the adsorption process is favorable, as well (Gusmão et al., 2012). The energy parameter from D-R isotherm (E) is around 0.572 (kJmol−1) which shows adsorption process mechanism as physical one.
5 Adsorption kinetic models
Fig. 7 shows the MB adsorption on the activated carbon blended with grape stalks powder at ambient temperature for kinetic study.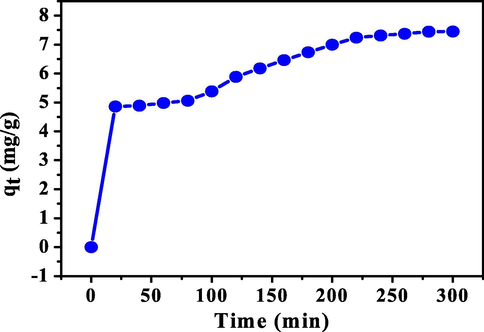
MB adsorption versus time on the activated carbon blended with grape stalks powder at ambient temperature.
Pseudo-first order, pseudo-second order, Elovich, and intraparticle diffusion kinetic models were applied to investigate the adsorption rate. All of models equations were illustrated in the literature (Salehi et al., 2018). The kinetic constants and regression coefficients are reported in Table 4. As shown in Table 4, the pseudo-first order model could properly legitimize the adsorption process. According to this model, the regression coefficient of determination for the MB adsorption on the adsorbent was favorable compared with the other ones. Therefore, physical adsorption mechanism is more probable than the chemical one. According to the results, MB molecules adsorption onto the adsorbent surface is boundary layer effect but, intraparticle diffusion also is irrefutable in this process.
Model
Pseudo-first order
Pseudo-second order
Intraparticle diffusion
Elovich
Parameter
qe,calc.
k1
R2
qe,calc.
k2
R2
Kid
R2
B
A
R2
Amounts
4.85
0.009
0.97
9.89
0.002
0.94
0.254
0.95
0.823
1.66
0.86
The MB adsorption process on the various adsorbents was compared in Table 5. It was observed that the grape stalks powder blended with activated carbon properly adsorbs MB from an aqueous solution due to having high adsorption capacity.
Adsorbent
Adsorption capacity (mg/g)
Ref.
Beer brewery waste
4.92
(Tsai et al., 2008)
Neem saw dust
3.62
(Khattri and Singh, 2000)
Cow dung ash
5.31
(Ozdemir et al., 2009)
Coir pith carbon
5.87
(Kavitha and Namasivayam, 2007)
Almond shell activated carbon
1.33
(Ayg€un et al., 2003)
Fly ash
5.57
(Kumar et al., 2005)
Glass fibers
2.24
(Chakrabarti and Dutta, 2005)
Clay
6.30
(Gurses et al., 2004)
Activated carbon blended with grape stalks powder
7.81
Present study
6 Conclusions
Adsorption of MB was investigated using grape stalks powder as a biocompatible and effective herbal adsorbent. The FT-IR tests showed that the grape stalks powder is containing many active functional groups. In fact, the electrostatic interactions between the carboxyl groups and the lignin moieties carry the MB adsorption out. The data analysis showed that the adsorbent capacity was dramatically increased for the activated carbon (as base adsorbent) blended with grape stalks powder. The CCD (under RSM) was applied to study the effects of five independent variables including pH, contact time, initial concentration of MB, grape stalks powder dosage for the MB adsorption from an aqueous solution. Pseudo-first order, pseudo-second order, Elovich and intraparticle diffusion kinetic models were applied to study the adsorption process kinetic. The results showed that pseudo-first order (and intraparticle diffusion) kinetic model can control the adsorption process mechanism. Furthermore, Langmuir, Freundlich, Temkin, and Dubinin-Radushkevitch (D-R) isotherm models were used to consider the equilibrium adsorption. The Langmuir isotherm model could legitimize the adsorption process isothermal behavior which was monolayer and homogeneous. According to the Freundlich model data, grape stalks powder blended with activated carbon was an excellent adsorbent for the MB adsorption because 1/n was equal to 0.1672 (0 < 1/n < 1 for an excellent adsorbent). According to the calculated absorption mean free energy (E = 0.572), it was concluded that the absorption process was a physical one confirmed by the pseudo-first order kinetic model. The adsorption capacity showed that grape stalks powder blended with activated carbon can properly be used (as an adsorbent) in treating the aqueous wastewaters.
References
- Processing of leather using deep eutectic solvents. ACS Sustainable Chem. Eng.. 2015;3:1241-1247.
- [Google Scholar]
- Removal of dyes from colored textile wastewater by orange peel adsorbent: equilibrium and kinetic studies. J. Colloid Interface Sci.. 2005;288:371-376.
- [Google Scholar]
- Production of granular activated carbon from fruit stones and nutshells and evaluation of their physical, chemical and adsorption properties. Microporous and Mesoporous Material. 2003;66:189-195.
- [Google Scholar]
- Removal of Pb (II) from aqueous solution using carbon derived from agricultural wastes. Process Biochem.. 2005;40:1293-1299.
- [Google Scholar]
- Modeling of adsorption isotherms and kinetics of a tannery dye onto an activated carbon prepared from an agricultural by-product Fuel processing Technology. 2013;106:408-415.
- Degradation of amaranth dye in alkaline medium by ultrasonic cavitation coupled with electrochemical oxidation using a boron-doped diamond anode. Electrochim. Acta. 2014;143:180-187.
- [Google Scholar]
- Factors associated with textile pattern dermatitis caused by contact allergy to dyes, finishes, foams, and preservatives. Dermatol. Clin.. 2009;27:309-322.
- [Google Scholar]
- A kinetics and thermodynamics study of methylene blue adsorption on wheat shells. Desalination. 2006;194:259-267.
- [Google Scholar]
- Assessment of water contamination caused by a mutagenic textile effluent/dyehouse effluent bearing disperse dyes. J. Hazard. Mater.. 2010;174:694-699.
- [Google Scholar]
- On the adsorption and diffusion of methylene blue in glass fibers. J. Colloid Interf. Sci.. 2005;286:807-811.
- [Google Scholar]
- Sea shell powder as a new adsorbent to remove Basic Green 4 (Malachite Green) from aqueous solutions: Equilibrium, kinetic and thermodynamic studies. Chem. Eng. J.. 2010;164:168-177.
- [Google Scholar]
- Membrane separation for wastewater reuse in the textile industry Resources. Conserv. Recycl.. 2001;31:189-197.
- [Google Scholar]
- Adsorption of methylene blue onto powdered activated carbon immobilized in a carboxymethyl sago pulp hydrogel. J. Appl. Polym. Sci.. 2017;134
- [Google Scholar]
- pH-insensitive electrostatic interaction of carmoisine with two serum proteins: A possible caution on its uses in food and pharmaceutical industry. J. Photochem. Photobiol., B. 2013;124:50-62.
- [Google Scholar]
- Cr (VI) adsorption on the blends of Henna with chitosan microparticles: Experimental and statistical analysis. Int. J. Biol. Macromol.. 2018;116:281-288.
- [Google Scholar]
- Removal of anionic dye Congo red from aqueous solution by raw pine and acid-treated pine cone powder as adsorbent: equilibrium, thermodynamic, kinetics, mechanism and process design. Water Res.. 2012;46:1933-1946.
- [Google Scholar]
- Mutagenic and carcinogenic potential of a textile azo dye processing plant effluent that impacts a drinking water source Mutation Research/Genetic Toxicology and Environmental. Mutagenesis. 2007;626:53-60.
- [Google Scholar]
- Chromium sorption and Cr (VI) reduction to Cr(III) by grape stalks and yohimbe bark. Bioresour. Technol.. 2008;99:5030-5036.
- [Google Scholar]
- Adsorption of dye from wastewater using chitosan–CTAB modified bentonites. J. Colloid Interface Sci.. 2012;382:61-66.
- [Google Scholar]
- Removal of rhodamine B, fast green, and methylene blue from wastewater using red mud, an aluminum industry waste. Ind. Eng. Chem. Res.. 2004;43:1740-1747.
- [Google Scholar]
- Determination of adsorptive properties of clay/water system: methylene blue sorption Journal of Colloid. Interface Sci.. 2004;269:310-314.
- [Google Scholar]
- Application of succinylated sugarcane bagasse as adsorbent to remove methylene blue and gentian violet from aqueous solutions–kinetic and equilibrium studies. Dyes Pigm.. 2012;92:967-974.
- [Google Scholar]
- Use of rice husk for the adsorption of congo red from aqueous solution in column mode. Bioresour. Technol.. 2008;99:2938-2946.
- [Google Scholar]
- Simultaneous chromate reduction and azo dye decolourization by Lactobacillus paracase CL1107 isolated from deep sea sediment. J. Environ. Manage.. 2015;157:297-302.
- [Google Scholar]
- Polysaccharide conjugated laccase for the dye decolorization and reusability of effluent in textile industry. Int. Biodeterior. Biodegrad.. 2013;85:271-277.
- [Google Scholar]
- Experimental and kinetic studies on methylene blue adsorption by coir pith carbon. Bioresour. Technol.. 2007;98:14-21.
- [Google Scholar]
- Colour removal from synthetic dye wastewater using a biosorbent. Water Air Soil Pollut.. 2000;120:283-294.
- [Google Scholar]
- Adsorption of anionic azo-dyes from aqueous solutions onto graphene oxide: equilibrium, kinetic and thermodynamic studies. J. Colloid Interface Sci.. 2017;496:188-200.
- [Google Scholar]
- Food cannery effluent, pineapple peel as an effective low-cost biosorbent for removing cationic dye from aqueous solutions. Desalin. Water Treat.. 2014;52:6096-6103.
- [Google Scholar]
- Modeling the mechanism involved during the sorption of methylene blue onto fly ash Journal of Colloid. Interface Sci.. 2005;284:14-21.
- [Google Scholar]
- Application of Brazilian pine-fruit shell as a biosorbent to removal of reactive red 194 textile dye from aqueous solution: kinetics and equilibrium study. J. Hazard. Mater.. 2008;155:536-550.
- [Google Scholar]
- Surface modification of magnetic nanoparticle and dye removal from ternary systems. J. Ind. Eng. Chem.. 2015;27:251-259.
- [Google Scholar]
- Adsorption of textile dyes on Pine Cone from colored wastewater: Kinetic, equilibrium and thermodynamic studies. Desalination. 2011;268(1-3):117-125.
- [CrossRef] [Google Scholar]
- Dye removal from wastewater using activated carbon developed from sawdust: adsorption equilibrium and kinetics. J. Hazard. Mater.. 2004;113:81-88.
- [Google Scholar]
- Titania versus zinc oxide nanoparticles on mesoporous silica supports as photocatalysts for removal of dyes from wastewater at neutral pH. Catal. Today. 2018;310:32-41.
- [Google Scholar]
- The removal of cationic dyes from aqueous solutions by adsorption onto pistachio hull waste. Chem. Eng. Res. Des.. 2011;89:2182-2189.
- [Google Scholar]
- The use of cork waste as a biosorbent for persistent organic pollutants–Study of adsorption/desorption of polycyclic aromatic hydrocarbons Journal of Environmental Science and Health. Part A. 2011;46:824-832.
- [Google Scholar]
- Adsorptive removal of methylene blue from simulated dyeing wastewater with melanine-formaldehyde-urea resin. J. Appl. Polym. Sci.. 2009;112:3442-3448.
- [Google Scholar]
- Adsorption behaviors of methylene blue from aqueous solution on mesoporous birnessite. J. Taiwan Inst. Chem. Eng.. 2017;77:168-176.
- [Google Scholar]
- Adsorption of anionic and cationic dyes on ferromagnetic ordered mesoporous carbon from aqueous solution: equilibrium, thermodynamic and kinetics. J. Colloid Interface Sci.. 2014;430:272-282.
- [Google Scholar]
- Grape stalk application for caffeine removal through adsorption. J. Environ. Manage.. 2017;202:178-187.
- [Google Scholar]
- Central composite methodology for methylene blue removal by Elaeagnus angustifolia as a novel biosorbent Journal of Environmental. Chem. Eng.. 2016;4:1407-1416.
- [Google Scholar]
- A useful organofunctionalized layered silicate for textile dye removal. J. Hazard. Mater.. 2010;181:366-374.
- [Google Scholar]
- Applications of Brazilian pine-fruit shell in natural and carbonized forms as adsorbents to removal of methylene blue from aqueous solutions—Kinetic and equilibrium study. J. Hazard. Mater.. 2009;164:1213-1222.
- [Google Scholar]
- Equilibrium Modeling and Kinetic Studies on the Adsorption of Basic Dye by a Low Cost Adsorbent Physical Chemistry & Electrochemistry. 2016;4:73-85.
- Direct reduction of blood serum cholesterol using Thymus vulgaris L.: Preliminary biosorption study. Process Biochem.. 2018;67:155-164.
- [Google Scholar]
- Removal of Methylene blue from aqueous solution by bioadsorption onto Ricinus communis epicarp Activated Carbon. Chemical Engineering Research Bulletin. 2009;13:1-5.
- [Google Scholar]
- Equilibrium, kinetics and mechanism of removal of methylene blue from aqueous solution by adsorption onto pine cone biomass of Pinus radiata Water. Air, & Soil Pollution. 2011;218:499-515.
- [Google Scholar]
- Adsorption of organic compounds from aqueous solution onto the synthesized zeolite. J. Hazard. Mater.. 2009;166:635-641.
- [Google Scholar]
- Removal of basic dye (methylene blue) from wastewater utilizing beer brewery waste. Journal of Hazard Materials. 2008;154:73-78.
- [Google Scholar]
- The physical and surface chemical characteristics of activated carbons and the adsorption of methylene blue from wastewater. J. Colloid Interface Sci.. 2005;284:440-446.
- [Google Scholar]
- Adsorptive removal and kinetics of methylene blue from aqueous solution using NiO/MCM-41 composite. Physica E. 2015;65:4-12.
- [Google Scholar]
- Nanoremediation of cadmium contaminated river sediments: Microbial response and organic carbon changes. J. Hazard. Mater.. 2018;359:290-299.
- [Google Scholar]
- Performance and toxicity assessment of nanoscale zero valent iron particles in the remediation of contaminated soil: a review. Chemosphere. 2018;210:1145-1156.
- [Google Scholar]
- Equilibrium, kinetics, and thermodynamics of methylene blue adsorption by pine tree leaves Water. Air, & Soil Pollution. 2012;223:5267-5282.
- [Google Scholar]
- Pollution survey of polycyclic aromatic hydrocarbons in surface water of Hangzhou. China Chemosphere. 2004;56:1085-1095.
- [Google Scholar]
- Granular activated carbon adsorption of organic micro-pollutants in drinking water and treated wastewater–aligning breakthrough curves and capacities. Water Res.. 2016;92:180-187.
- [Google Scholar]


