

Translate this page into:
Adsorption characteristics for the removal of a toxic dye, tartrazine from aqueous solutions by a low cost agricultural by-product
⁎Corresponding author. Tel.: +91 5322462393. sushmita.bnerjee@gmail.com (Sushmita Banerjee)
-
Received: ,
Accepted: ,
This article was originally published by Elsevier and was migrated to Scientific Scholar after the change of Publisher.
Peer review under responsibility of King Saud University.

Abstract
Application of saw dust for the removal of an anionic dye, tartrazine, from aqueous solutions has been investigated. The experiments were carried out in batch mode. Effect of the parameters such as pH, initial dye concentration and temperature on the removal of the dye was studied. Equilibrium was achieved in 70 min. Maximum adsorption of dye was achieved at pH 3. Removal percent was found to be dependent on the initial concentration of dye solution, and maximum removal was found to be 97% at 1 mg/L of tartrazine. The removal increases from 71% to 97% when the initial concentration of dye solution decreases from 15 mg/L to 1 mg/L. The equilibrium adsorption data were analyzed by Langmuir, Freundlich, Temkin and Dubinin–Radushkevich isotherm models. The (Langmuir) adsorption capacity of the adsorbent is found to be 4.71 mg/g at 318 K. Kinetic modeling of the process of removal was carried out and the process of removal was found to follow a pseudo second order model and the value of rate constant for adsorption process was calculated as 2.7 × 10⁻³ g mg−1 min−1 at 318 K. The thermodynamic parameters such as change in free energy (ΔG°), enthalpy (ΔH°) and entropy (ΔS°) were determined and the negative values of ΔG° indicated that the process of removal was spontaneous at all values of temperatures. Further, the values of ΔH° indicated the endothermic nature of the process of removal.
Keywords
Adsorption
Tartrazine
Equilibrium isotherm
Kinetics
Thermodynamics

1 Introduction
Many industrial processes use a variety of synthetic chemical dyes for various uses (Lata et al., 2008). The industries like paper and pulp manufacturing, dyeing of cloth, textiles, leather treatment, printing, food products etc. used dyes and the effluents released from these industries bear large amounts of colored wastes. It has been estimated that about 800,000 tons of synthetic dyes are produced annually and ∼50% of these are azo dyes (Greluk and Hubicki, 2011). Dyes have complex aromatic molecular structure and are generally resistant to light, temperature and oxidizers. This characteristic feature makes the dye non-degradable and therefore causes bioaccumulation in living organisms, leading to severe diseases and disorders.
Nowadays great attention has been focused on elimination of the effluents bearing dyes due to their potential toxicity and visibility problems. Various methods of treatment for dye/color removal are adopted in order to decrease their impact on the environment. These methods include adsorption, coagulation/flocculation, photo-catalytic decolonization, ozonation, microbial decomposition, wet air oxidation, sono-chemical and electrochemical methods. Among various methods of dye removal, adsorption has been reported to be the most effective method that provides promising results. Among the adsorbent materials, one of the most extensively explored adsorbents is activated carbon. However, its use is limited due to its high cost so researchers look out for low cost adsorbent materials for as alternates to activated carbon. Many scientific workers have investigated the feasibility of cheaper substitutes such as coconut husk (Low and Lee, 1990), orange peel (Arami et al., 2005), wheat bran (Sulak et al., 2007), meranti saw dust (Ahmad et al., 2009), spent tea leaves (Nasuha et al., 2010) etc. for the removal of pollutants from aqueous solutions.
Present investigation addresses the application of raw (unmodified) saw dust as an adsorbent for the removal of tartrazine, a hazardous dye from its aqueous solutions. Saw dust is a solid waste/by product produced in huge quantities at saw mills. Sawdust mainly consists of cellulose and lignin, and many hydroxyl groups; such as tannins or other phenolic compounds (Shukla et al., 2002). Growing interest in the use of sawdust for the removal process has been stimulated by the significant results that have been reported by various workers. Tartrazine is a coal tar derivative, azo dye: usually present in many drugs, food products and cosmetics. Due to its wide applicability in various industrial processes and its hydrophilic nature, its presence can be noticed as a yellow menace in effluents. The contact of the dye is reported to result in various types of health problems like hypersensitivity (Lockey, 1977), mutagenic and carcinogenic effects(Chung, 1983), allergy and asthma (Pohl et al., 1987), skin eczema (Devlin and David, 1992) and immunosuppressive effects(Koutsoqeorqopoulou et al., 1998). This leads to raise concern regarding its use as well as its removal from aqueous solutions. Effect of various process parameters on the removal has been reported in this communication. The experimental data have been tested for different isotherm models. Thermodynamic parameters like change in free energy, enthalpy and entropy for the process of removal have been determined and reported.
2 Materials and methods
2.1 Adsorbent
Saw dust was procured from the local timber factory from Allahabad, India. Saw dust was washed several times with normal tap water followed by distilled water to remove adhered dust particles. The cleaned material was kept in an oven for 24 h at 110 °C. The dried mass was then crushed and sieved. The fraction of the particles between 0.425 and 0.6 mm (geometric mean size: 0.5 mm) was selected and used in the adsorption experiments as such without any further modification.
2.2 Adsorbate
An anionic dye, 4, 5-dihyro-5-oxo-1-(4-sulfophenyl)-4-[(4-sulfophenyl) azo]-1H pyrazole-3- carboxylic acid trisodium salt also known as Tartrazine (Acid Yellow 23, FD & C Yellow 5 , E102) with molecular formula C16H9N4Na3O9S2 and molecular weight 534.4 shown in Fig. 1 was obtained from Alfa Aesar, Great Britain with CAS No- 1934-21-0 and CI No-19140. Stock solution of the dye was made by dissolving its required amount in double distilled water. The stock solution was further diluted with distilled water to obtain the standard solutions of 1 mg/L, 5 mg/L, 10 mg/L and 15 mg/L.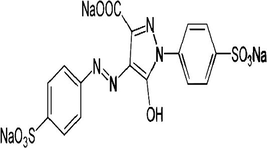
Chemical structure of Tartrazine or Acid Yellow 23.
2.3 Characterization of adsorbent
Infrared spectra of the adsorbents were obtained using a Fourier transform infrared spectrometer (ABB Model FTLA-2000, Canada). For the FT-IR study, finely ground adsorbent has been intimately mixed with KBr (Merck) in a ratio of 1:100 in order to prepare a translucent pellet. From these FT-IR spectra the presence of functional groups on the adsorbent were confirmed.
The surface morphology of the adsorbents was investigated by scanning electron microscope (Jeol JSM 6390LV). The SEM micrograph of saw dust at bar length equivalent to 200 μm with 400 magnifications, at a working voltage of 30 kV was reported.
2.4 Batch adsorption studies
In the present study batch adsorption experiments were carried out to achieve the optimum operating conditions for the removal of the selected dye. 50 mL solution of known initial concentration was taken in 250 mL Erlenmeyer flasks and a known amount of saw dust, the adsorbent was added to the solutions. The mixture was shaken mechanically at a constant speed of 180 rpm using a water bath shaker (Mac-Macro Scientific Works, Pvt Ltd, New Delhi, India). The samples were withdrawn after predetermined time viz. equilibrium time and thereafter the adsorbent was separated from the solutions by centrifugation using a centrifuge (Remi, Model-R-8CBL, India). The residual concentration of the dye in the supernatant was estimated spectrophotometrically with a double beam spectrophotometer (Model-2203 Systronics, Ahmedabad, India) at 426 nm.
2.5 Determination of pHzpc
For the determination of pHzpc of the adsorbent, 50 mL of 0.01 M NaCl solutions were taken in different Erlenmeyer flasks of 250 mL and 0.5 g of adsorbent was introduced in each of them. Now pH values of these solutions were adjusted in 2 to 12 range by 0.1 M HCl/NaOH solutions. These flasks were kept for 48 h and the final pH of the solutions was measured. Graphs were plotted between pHfinal versus pHinitial. The point of intersection of the curve of pHfinal versus pHinitial was recorded as pHzpc of the saw dust.
2.6 Adsorption kinetics and equilibrium studies
Adsorption kinetics investigations were carried out by agitating 50 mL of dye solution of known initial concentration with 5 g/L of adsorbent at a temperature of 318 K, at a pH of 3.0 ± 0.1 and at 180 rpm for different time intervals. The amount of dye adsorbed onto the adsorbent at equilibrium, qe (mg/g), was calculated by the following expression:
Similarly, the adsorption isotherm experiments were conducted by contacting 5 g/L of saw dust with 50 mL of dye solutions of various initial concentrations (1 mg/L, 5 mg/L, 10 mg/L, and15 mg/L). The samples were agitated on a water bath at 180 rpm at 298 K, 308 K, and 318 K for 70 min.
Blank experiments were also conducted by using dye solutions without adsorbent to ensure that no dye was adsorbed onto the containers and with adsorbent and water only to check that no leaching occurred, which would rather interfere with the measurement of dye concentrations on a spectrophotometer. All adsorption experiments were performed in triplicate and the mean values were used in data analysis.
3 Results and discussions
3.1 Characterization
Fig. 2 shows the SEM micrograph of saw dust (400 X). It is clear from this image that the surface is rough and highly corrugated. Saw dust is a heterogeneous material consisting of particles of irregular shapes having considerable layers with pores of varying size and provides a fair possibility for the dye to be adsorbed.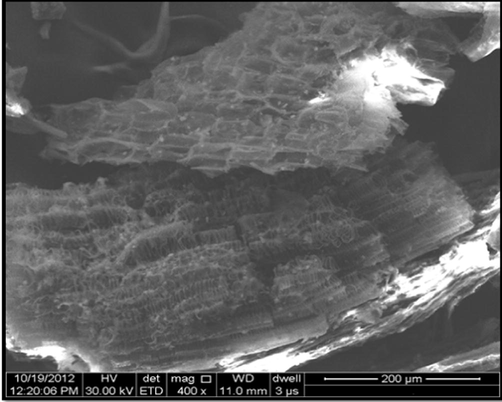
SEM micrograph of saw dust (400 X).
Sawdust is basically composed of cellulose as well as lignin, and all these components contribute as active sites for the adsorption of dye molecules. Fig. 3 displays the FT-IR spectra of sawdust in its natural form and dye loaded form. The spectra exhibited several peaks representing that saw dust is composed of various functional groups which possibly help in binding of the dye molecules. The appearance of a peak in natural saw dust at 3497 cm−1 represents –OH stretching (Samiey and Ashoori, 2012). The peak at 2852 cm−1 corresponds to the presence of –CH2 stretching of aliphatic groups. The peaks at 1637 cm−1 and 1321 cm−1 indicate the presence of C⚌C stretching of phenol group and C–N stretching of the amine group respectively. Whereas peaks appearing at 1119 cm−1 and 1032 cm−1 in the spectrum contribute to C–O stretching of the phenolic group and a strong C–O bond due to ether group of cellulose, respectively (Ahmad et al., 2009). The spectra of the dye loaded saw dust showed similar characteristics as the saw dust in natural form except for slight changes. The FT-IR spectrum of the dye loaded adsorbent indicates that the peaks are slightly shifted from their position and the intensity gets altered. These results indicated the involvement of some functional group in the adsorption of dye ions on the surface of the saw dust through weak electrostatic interaction or Van der Waals forces. Therefore, there is no possibility of chemical bonding in this process. Thus the FT-IR of the surface moieties remained unchanged.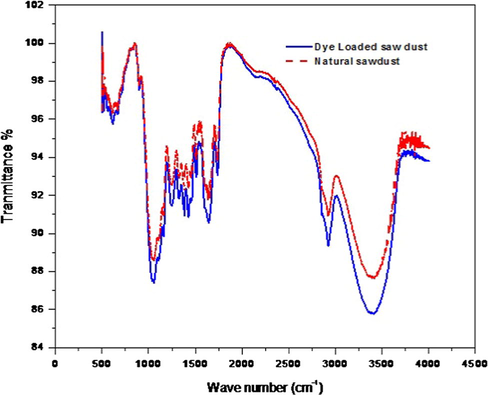
Comparative FT-IR spectra of saw dust before and after adsorption of dye.
3.2 Effect of pH
The effect of pH on the removal of tartrazine has been investigated. Solution pH plays an important role in controlling the surface charge of the adsorbent, the degree of ionization of the adsorbate in the solution as well as dissociation of various functional groups on the active sites of the adsorbent (Wawrzkiewicz and Hubicki, 2009). In most cases, pH is termed as the ‘master variable’. The adsorption experiment of anionic dye tartrazine was performed in 2–12 pH range at 318 K for 70 min. The equilibrium sorption capacity was lowest at pH 12 (0.163 mg/g) and maximum adsorption of the dye was achieved at pH 3 (0.19 mg/g). This can be explained as in the aqueous solutions, the anionic dye exists in dissociated form as anionic dye ions:
3.3 Zero point charge of adsorbent
The influence of pH on the dye removal can be illustrated on the basis of isoelectric point of the adsorbent surface. Solution pH is a significant parameter which affects the dye adsorption process. It also alters the surface charge of the adsorbent, the ionization extent of different pollutants, as well as the structure of the dye molecules (Ai et al., 2011). The presence of various ligands such as carboxyl, phosphate and amino group on lignin and cellulose based materials in the ionic state contributes to the reaction with dye ions. At pHzpc, the acidic and basic functional groups no longer contribute to the pH of the solutions. The zero point charge, pHzpc, of saw dust was found to be 6.32. At a pH of the solution below pHzpc the surface of the sorbent is positively charged and can attract anions from the solution. When the solution pH is greater than pHzpc the surface of saw dust is negatively charged and attracted cations. In the present case, a lower pH is favorable for dye removal as at low pH, the number of positively charged sites is increased which favor the adsorption of negatively charged dye ions because of the electrostatic force of attraction.
3.4 Effect of initial dye concentration and contact time
A given amount of adsorbent has the capacity to adsorb only a fixed amount of adsorbate species. Thus initial concentration of the adsorbate solution is very important. Fig. 4 shows the graph plotted between the amount of dye adsorbed (qt) versus time, t, at different initial dye concentrations. The time variation plot indicates that the removal of dye is rapid in initial stages but when it approaches equilibrium, it slows down gradually. This may be due to the availability of vacant surface sites during the preliminary stage of adsorption, and after a certain time period the vacant sites get occupied by dye molecules which lead to create a repulsive force between the adsorbate on the adsorbent surface and in bulk phase. The attainment of equilibrium takes place after agitating the solutions containing the adsorbent up to 70 min and once equilibrium was attained, the percentage of adsorption of dye did not show any appreciable change with time. This suggests that after equilibrium is attained, further treatment does not provide more removal. In batch adsorption, the rate of removal of the adsorbate from aqueous solutions is controlled mainly by the transport of dye molecules from the surrounding sites to the interior sites of the adsorbent particles (Ahmad et al., 2009). From the corresponding plot it can be observed that the amount of dye adsorbed (mg/g) varies with varying initial dye concentration and increases with increase in initial dye concentration and after equilibrium, it becomes constant due to the driving force offered by the increased solute concentration which is sufficient enough to overcome the resistance to mass transfer between the solid and liquid phases. Hence the adsorption will enhance with higher initial concentration. When the initial dye concentration increased from 1 mg/L to 15 mg/L at 318 K and pH 3.0 ± 0.1, the sorption capacity increased from 0.186 to 1.44 mg/g while the removal percentage of dye decreased from 97% to 71%. At a higher concentration range the fractional removal is always higher whereas for low concentration ranges the percentage removal of the dye is higher (Sharma and Uma, 2010).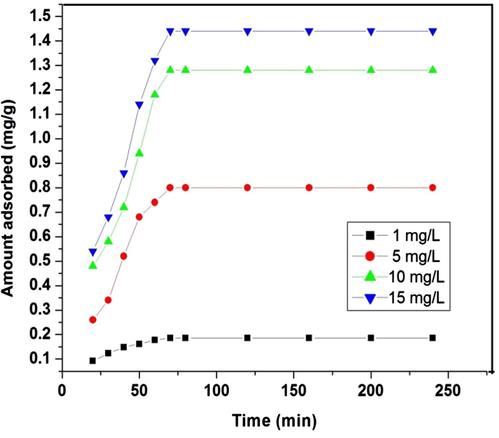
Effect of initial dye concentration on adsorption of tartrazine. Experimental conditions: adsorbent dosage 5 g/L, contact time 240 min, pH 3.
3.5 Adsorption kinetics
3.5.1 Lagergren pseudo first order equation
The rate constant of adsorption is determined from the following first order rate expression (Lagergren, 1898):
Kinetic models and its parameters
Temperatures (K)
298
308
318
qe, exp (mg g−1)
0.182
0.192
0.194
Pseudo-first order kinetic
qe, cal (mg g−1)
1.3
0.92
0.961
k1 (min−1)
0.04
0.07
0.086
R2
0.987
0.9495
0.958
SSE%
0.452
0.311
0.297
Pseudo-second order kinetics
qe, cal (mg g−1)
0.84
0.36
0.32
k2 (g mg−1 min−1)
0.9 × 10⁻³
1.2 × l0−3
2.7 × 10⁻³
h (mg g−1 min−1)
6.3 × 10⁻⁴
1.5 × 10⁻³
2.3 × 10⁻³
R2
0.995
0.988
0.989
SSE%
0.109
0.06
0.0514
Intraparticle diffusion
ki (mg g−1 min1/2)
0.031 0.267
0.034 0.239
0.037 0.0232
C (mg g−1)
0.016 0.037
0.040 0.054
0.051 0.083
R2
0.982 0.941
0.964 0.932
0.969 0.947
Di (cm2/s)
1.13 × 10⁻³
1.6 × 10⁻³
2.07 × 10⁻³
Frequency (cm−1)
Assignment
Before adsorption
After adsorption
3497
3492
OH stretching
2852
2854
C–H stretching
1637
1632
C⚌C stretching
1321
1315
C–N stretching
–
1112
C–O stretching
1302
1026
–OCH3 group
3.5.2 Pseudo-second order kinetics equation
The kinetics of the adsorption process may also be described in pseudo-second order rate equation (Ho and McKay, 1998). The linearized form of t equation is expressed as:
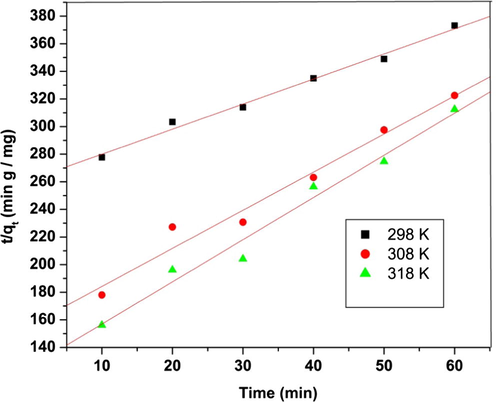
Pseudo-second order kinetic plot for adsorption of tartrazine over saw dust. Experimental condition: pH 3, adsorbent dosage 5 g/L, contact time 70 min.
The higher value of R2 and the lower value of SSE (Table 2) calculated in the case of pseudo second order kinetic model indicates better fitness of the data and indicates that the adsorption follows pseudo second order kinetics. A similar observation was reported for adsorption of tartrazine onto fly ash and a resin (Pura and Atun, 2009; Baraka, 2012). The calculated results are given in Table 3.
Adsorption isotherms and their constants
Temperatures (K)
298
308
318
Langmuir adsorption isotherm
Kl (L g−1)
3.12
4.20
7.14
aL (L mg−1)
0.92
1.13
1.52
(mg g−1)
3.39
3.72
4.71
Rl
0.067
0.55
0.043
R2
0.974
0.977
0.982
Freundlich adsorption isotherm
Kf (mg g−1) (L mg−1)1/n
0.79
0.96
1.23
n
4.90
5.81
6.21
R2
0.974
0.965
0.954
Temkin adsorption isotherm
KT (L mg−1)
1.09
1.39
1.56
B
0.285
0.266
0.258
R
0.978
0.989
0.989
D–R adsorption isotherm
qm (mg g−1)
1.24
1.35
1.48
P (mol2 kJ−2)
0.051
0.039
0.031
E (kJ mol−1)
3.01
3.62
3.86
R2
0.986
0.997
0.997
Arrhenius (1889) proposed the relationship between the rate constant and temperature which could be described using the following expression (Zhang et al., 2011):
This can be rearranged to linear relationship as:
For adsorption processes with an activation energy less than 40 kJ/mol (Zhang et al., 2011), the main interaction between the dye and saw dust is probably physisorption.
3.5.3 Intraparticle diffusion model
Kinetic data were further analyzed using the intraparticle diffusion model (Weber and Morris, 1963). The above kinetic models were not able to identify the diffusion mechanism, thus this model was proposed. It is an empirical model that describes dye uptake and varies almost proportionally with t1/2 rather than with the contact time, t:
3.5.4 Sorption mechanism
For proper corroboration of the adsorption process, the rate determining step is an important factor. Adsorption process is governed by either external mass transfer or intraparticle diffusion or both i.e. solute transfer processes. The overall rate of adsorption is controlled by either film diffusion or pore diffusion. It is clear from Fig. 6 that the adsorption process at the selected values of temperature has been divided into two phases. The initial curved portion of the plot indicates boundary layer effect while second linear portion due to pore diffusion. The biphasic nature of intraparticle diffusion plot confirms that both film and pore diffusion are involved in the process of dye removal. In order to differentiate between particle diffusion and film diffusion, Boyd kinetic expression (Boyd et al., 1947) was employed to the experimental data. Film diffusion occurs when external transport is greater than internal transport and in the case of particle diffusion internal transport is greater than external transport (Mittal et al., 2007).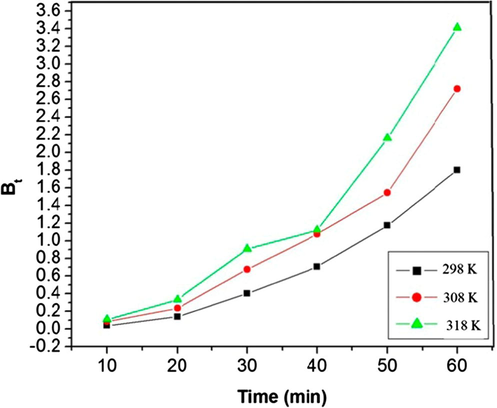
Plot of Bt versus t (Boyd plot) at three different temperatures.
A quantitative treatment of the sorption process can be investigated by using the following expressions:
The F value can be used to determine the corresponding Bt values using the Richenberg’s table (Richenberg, 1953). Film diffusion and particle diffusion adsorption rate are determined with the help of Bt versus time plot (Fig. 6). The linearity of these plots was used to distinguish between film diffusion and pore diffusion controlled rates of adsorption. A straight line passing through the origin indicates that adsorption processes are governed by pore diffusion mechanisms for the present study. However it is observed from Fig. 6 that the relation between Bt and t is linear (average R2 = 0.974), but does not pass through origin. This result confirms that surface diffusion is the rate limiting step where external transport of dye is more than internal transport. The values of effective diffusion coefficient Di (cm2 s−1) are calculated at 298 K, 308 K and 318 K and are summarized in Table 2. As reported earlier (Singh et al., 2011), in the case of intra particle diffusion or pore diffusion as a rate-limiting step in the adsorption process, a Di value is of the order of (10 to 11) cm2 s−1. In this study, the average value of Di obtained is 1.59 × 10⁻³ cm2 s−1, which is 7 orders of magnitude greater than the value quoted by Singh et al. This indicates that pore diffusion is not the rate limiting step. Similar results have been reported by Aravindhan et al. (2007) and Zou et al., 2011. The increasing values of effective diffusion coefficient Di indicate that as temperature increases from 298 K to 318 K the mobility of ions rises due to the decrease of retarding force acting on diffusing ions of the dye.
3.5.5 Adsorption isotherms
The experimental data for the removal of tartrazine were tested with different isotherm models namely Langmuir, Freundlich, Dubinin and Radushkevich and Temkin models.
3.5.6 Langmuir model
This model assumes monolayer coverage of adsorbent and adsorption occurs over specific homogenous sites on the adsorbent (Langmuir, 1918).
The linear form of the Langmuir isotherm model is given by the following equation (Sharma et al., 2008):
Linear plots obtained for Ce/qe versus Ce (Figure not shown) at each temperature with R2 values close to unity reflect that Langmuir isotherm holds well for tartrazine – sawdust system. Straight lines obtained were used for calculating the value of KL from the intercept and the value of aL from the slope. The theoretical monolayer capacity is Q0 and it is numerically equal to KL/aL. The values of constants Q0, aL and KL were calculated and presented in Table 3. It is evident from Table 3 that with the increase in temperature, the values of monolayer adsorption capacity (Q0) increase from 3.39 to 4.71 mg/g for saw dust. This indicates that higher temperature enhanced adsorption capacity. The adsorption capacities of tartrazine over a variety of adsorbents are compared and reported in Table 4. The adsorption capacity of this study was found to be larger than adsorption capacity accounted by several workers.
Adsorbent
Adsorption capacity (Q°) (mg g−1)
References
Bottom ash
1.01 × 10⁻⁵
Mittal et al. (2006)
Deoiled soya
2.12 × 10⁻⁵
Mittal et al. (2006)
Hen feather
6.4 × 10⁻⁵
Mittal et al. (2007)
Activated carbon
18.581 × 10³
Gupta et al. (2010)
Coconut husk carbon
3.366 × 10³
Gupta et al. (2010)
Polyaniline nano layer composite
2.47
Ansari et al. (2011)
Chitin
30
Dotto et al. (2012)
Chitosan
350
Dotto et al. (2012)
Sawdust
4.71
This study
3.5.7 Freundlich model
It is an empirical equation (Freundlich, 1906) which indicates that the adsorption process takes place on a heterogeneous surface and adsorption capacity is related to the concentration of dye at equilibrium. The linear form of this isotherm is given by the following expression:
3.5.8 Temkin model
The Temkin isotherm model contains a factor that explicitly takes into account the interactions between adsorbate and adsorbent species (Temkin and Pyzhev, 1940). It further implies that the heat of adsorption of all the molecules in the layer would decrease linearly with the coverage involved in this interaction. The linear form of the Temkin model is expressed as follows:
3.5.9 Dubinin radushkevich model
The D–R isotherm model is applied to estimate the apparent free energy and characteristics of adsorption. The isotherm is an analog of the Langmuir type but it is more general because it is used to determine the occurrence of adsorption on both homogenous and heterogeneous surfaces. The linear form of D–R isotherm (Dubinin et al., 1947) can be expressed as:
The regression parameters and correlation coefficients (R2) presented in Table 3, indicate that the adsorption data best fitted the Dubinin-Radushkevich adsorption isotherm. The good fit of the D–R isotherm (all R2 values >0.98) suggest that this isotherm is appropriate under industrial conditions.
3.5.10 Effect of temperature and thermodynamic parameters
The removal of tartrazine was studied at different temperatures viz. 298 K, 308 K and 318 K for the determination of adsorption isotherm and thermodynamic parameters. It had been investigated from the experiment that with the rise of temperature from 298 K to 318 K the amount of dye uptake increases from 3.39 to 4.71 mg/g. As the rate of diffusion of the dye molecules is a temperature controlled process, variation in temperature alters the equilibrium capacity of the adsorbent for a particular adsorbate. In the present study increase in temperature leads to fast diffusion of dye molecules across the external boundary layer and internal pores of the adsorbent particles due to less resistance offered by viscous forces in the aqueous phase. Also, in some cases the solubility of the adsorbate molecules is affected which finally has significant effect on the removal process. The increase in adsorption capacities of adsorbents at high temperature may also be attributed to the pore size enlargement (Demirbas et al., 2008).
Thermodynamic parameters such as change in free energy (ΔG ), enthalpy changes (ΔH ) and entropy changes (ΔS ) were determined using the following equations (Meena et al., 2008)
Enthalpy change (ΔH) was calculated from the following equation:
Temperature (K)
ΔG° (kJ mol−1)
ΔH0 (kJ mol−1)
ΔS0 (J mol−1 K−1)
298
−0.75
48.26
166
308
−1.74
318
−2.13
4 Conclusions
On the basis of the above studies, the following can be concluded:
-
Characterization of saw dust was carried out which revealed the presence of various functional groups on the adsorbent surface and that the surface of the adsorbent was rough and suitable for adsorption.
-
Saw dust has shown a potential to remove tartrazine from aqueous solution.
-
Initial concentration of the dye plays an important role in the removal process.
-
Kinetics of the process removal was studied and the values of rate constants were determined. The dye removal was found to be governed by film diffusion mechanism where external transport of the adsorbate over surface of the adsorbent is greater than internal transport which was confirmed by the Boyd plot and the process of removal was found to follow second order kinetics.
-
Thermodynamic parameters were calculated for the removal of dye and their values indicated that the process of removal was spontaneous and endothermic.
-
The data were found to best fitted in D–R isotherm model.
It can therefore be concluded that saw dust offers promise as an economically viable alternative for sequestering of the dye from the aqueous solution. The work can be extended for the removal of dyes from effluents as well.
Acknowledgement
Financial support to undertake this research work from the Council of Scientific and Industrial Research, New Delhi, India is highly acknowledged.
References
- Scavenging behavior of meranti sawdust in removal of Methylene Blue from aqueous solution. J. Hazard. Mater.. 2009;170:357.
- [Google Scholar]
- Adsorption of Methyl Orange from aqueous solution on hydrothermal synthesized Mg–Al layered double hydroxide. J. Chem. Eng. Data. 2011;56:4217.
- [Google Scholar]
- Application of Polyaniline nanolayer composite for removal of tartrazine dye from aqueous solution. J. Polym. Res.. 2011;18:1931.
- [Google Scholar]
- Removal of dyes from colored textile waste water by orange peel adsorbent: equilibrium and kinetic studies. J. Colloid Interface Sci.. 2005;288:371.
- [Google Scholar]
- Removal of basic yellow dye from aqueous solution by sorption on green alga Caulerpa scalpelliformis. J. Hazard. Mater.. 2007;142:68.
- [Google Scholar]
- Uber die reaktionsgeschwindigkeit bei inversion von rohrzucker durch sauren. J. Phys. Chem.. 1889;14:226.
- [Google Scholar]
- Adsorptive removal of tartrazine and methylene blue from wastewater using melamine-formaldehyde tartaric acid resin (and a discussion about pseudo second order model) Desalination Water Treat.. 2012;44:128.
- [Google Scholar]
- The exchange adsorption of ions from aqueous solutions by organic zeolites II: kinetics. J. Am. Chem. Soc.. 1947;69:2836.
- [Google Scholar]
- The significance of azo-reduction in mutagenesis and carcinogenesis of azo dyes Muta. Res/Rev. Gen. Toxicol.. 1983;114:269.
- [Google Scholar]
- Asorption kinetics of a basic dye from aqueous solutions onto apricot stones activated carbon. Bioresour. Technol.. 2008;99:5368.
- [Google Scholar]
- Kinetics and mechanism of Tartrazine adsorption onto chitin and chitosan. Ind. Eng. Chem. Res.. 2012;51:6599.
- [Google Scholar]
- Sorption and structure of activated carbons. I. Adsorption of organic vapours. J. Phys. Chem.. 1947;21:1351.
- [Google Scholar]
- Efficient removal of Acid Orange 7 dye from water using the strongly basic anion exchange resin Amberlite IRA-95. Desalination. 2011;278:219.
- [Google Scholar]
- Equilibrium and thermodynamic studies on the adsorption of the dye Tartrazine onto waste “coconut husks” carbon and activated carbon. J. Chem. Eng. Data. 2010;55:5083.
- [Google Scholar]
- Immunological aspects of the common food colorants, Amaranth and Tartrazine. Veterin. Human. Toxicol.. 1998;40:1.
- [Google Scholar]
- About the theory of so-called adsorption of soluble substances. K. Sven. Vetenskapsakad. Handl.. 1898;24:1.
- [Google Scholar]
- The adsorption of gases on plane surfaces of glass, mica and platinum. J. Am. Chem. Soc.. 1918;40:1361.
- [Google Scholar]
- Adsorptive removal of basic dye by chemically activated Parthenium biomass: equilibrium and kinetic modeling. Desalination. 2008;219:250.
- [Google Scholar]
- Hypersensitivity to Tartrazine (FD & C yellow No.5) and other dyes and additives present in foods and pharmaceutical products. Ann. Allergy. 1977;38:206.
- [Google Scholar]
- The removal of cationic dyes using coconut husk as an adsorbent. Pertanika. 1990;13:221.
- [Google Scholar]
- Adsorption of Pb (II) and Cd (II) metal ions from aqueous solutions by mustard husk. J. Hazard. Mater.. 2008;150:619.
- [Google Scholar]
- Adsorption isotherms, kinetics and column operations for the removal of hazardous dye, Tartrazine from aqueous solutions using waste materials – bottom ash and de- oiled soya, as adsorbents. J. Hazard. Mater.. 2006;B136:567.
- [Google Scholar]
- Freundlich and langmuir adsorption isotherms and kinetic for the removal of Tartrazine from aqueous solutions using hen feathers. J. Hazard. Mater.. 2007;146:243.
- [Google Scholar]
- Rejected tea as a potential low-cost adsorbent for the removal of Methylene Blue”. J. Hazard. Mater.. 2010;175:126.
- [Google Scholar]
- Adsorption of acid blue 193 from aqueous solutions onto Na–bentonite and DTMA–bentonite. J. Colloid Interface Sci.. 2004;280:44.
- [Google Scholar]
- Theories of the adsorption of gases. A general survey and some additional remarks. Trans. Faraday Soc.. 1932;38:316.
- [Google Scholar]
- Adsorptive removal of Acid Blue 113 and Tartrazine by fly ash from single and binary dye solutions. J. Sep. Sci. Technol.. 2009;44:75.
- [Google Scholar]
- Adsorption of copper (II), chromium (III), nickel (II) and lead (II) ions from aqueous solutions by meranti saw dust. J. Hazard. Mater.. 2009;170:969.
- [Google Scholar]
- Properties of ion exchange resins in relation to their structure III Kinetics of exchange. J. Am. Chem. Soc.. 1953;75:589.
- [Google Scholar]
- Adsorptive removal of methylene blue by agar: effects of NaCl and ethanol. Chem. Cent. J.. 2012;6:1.
- [Google Scholar]
- Optimization of parameters for adsorption of Methylene Blue on a low cost activated carbon. J. Chem. Eng. Data. 2010;55:435.
- [Google Scholar]
- Alumina nanoparticles for the removal of Ni (II) from aqueous solutions. Ind. Eng. Chem. Res.. 2008;47:8095.
- [Google Scholar]
- The role of sawdust in the removal of unwanted materials from water. J. Hazard. Mater.. 2002;B95:137.
- [Google Scholar]
- Removal of Cr (IV) from wastewater using rice bran. J. Colloid Interface Sci.. 2011;56:1882.
- [Google Scholar]
- Removal of Astrazon Yellow 7GL from aqueous solutions by adsorption onto wheat bran. Bioresour. Technol.. 2007;98:2590.
- [Google Scholar]
- Removal of Tartrazine from aqueous solutions by strongly basic polystyrene anion exchange resins. J. Hazard. Mater.. 2009;164:502.
- [Google Scholar]
- Kinetics of adsorption on carbon from solution. J. Sanit. Eng. Div. Proc. Am. Soc. Civil Eng.. 1963;89:31.
- [Google Scholar]
- Preparation of porous nano-calcium titanate microspheres and its adsorption behavior for heavy metal ion in water”. J. Hazard. Mater.. 2011;186:971.
- [Google Scholar]


