

Translate this page into:
Adsorption mechanism of CO2/CH4/N2 by the synergistic effect of N/S-doped and functional groups in coal at different temperatures and pressures
⁎Corresponding author at: College of Safety Science and Engineering, Liaoning Technical University, Fuxin, Liaoning 123000, China. shl20002022@163.com (Hailong Song)
-
Received: ,
Accepted: ,
This article was originally published by Elsevier and was migrated to Scientific Scholar after the change of Publisher.
Peer review under responsibility of King Saud University.
Abstract
Doping-modified coal samples can effectively enhance the adsorption of CO2. In order to investigate the micro-mechanism of the adsorption of different gases by the synergistic effect of N/S atomic doping and functional groups in coal, the microporous constructed by N/S doping with different functional groups in coal at different temperatures and pressures were investigated based on a series of grand canonical Monte Carlo (GCMC) computational simulations. The adsorption amount, heat of adsorption, diffusion coefficient, interaction energy and relative density distribution of CO2/CH4/N2 by the model. It was found that coal samples with more N-doped carboxyl groups could adsorb CO2 better, and coal samples with more N-doped aliphatic functional groups should be selected for adsorption of CH4 and N2, and the N-COOH system had the most stable adsorption state of CO2, and the amount of N-modified coal samples adsorbed CO2 was higher than that of CH4 and N2 at the adsorption temperature of 293.15 K.The diffusion coefficients of the gas molecules showed an increasing trend with the adsorption temperature, and the relative density distributions of CO2/CH4/N2 in the N-doped micropore model were larger than those in the S-doped system. These noteworthy findings provide a valuable theoretical foundation for the advancement of novel adsorbent materials.
Keywords
Adsorption
N/S-doping
GCMC simulation
Adsorption thermodynamics

1 Introduction
With the increasing awareness of climate change and the role of greenhouse gas emissions in driving climate change, carbon neutrality has become an important goal for many companies, organizations, and even countries. Carbon capture and storage technology has been widely recognized by researchers and scholars as having a high potential for climate change mitigation (Bui, 2018; Yadav and Mondal, 2022). There are three main commonly used carbon capture techniques: pre-combustion capture, post-combustion capture, and oxyfuel combustion (Goel et al., 2021; Cuéllar-franca and Azapagic, 2015).
Post-combustion CO2 capture is achieved through the selective absorption of CO2 in solvents or adsorbent materials (Olajumobi Akeeb et al., 2022). Common methods of post-combustion CO2 capture include adsorption (Álvarez-Gutiérrez et al., 2016; Liu et al., 2022), membrane separation (Zhao et al., 2008), and absorption (Singh et al., 2021). Adsorption technology is favored for its simplicity, economy, and environmental performance. Activated carbons prepared from coal (Álvarez-Gutiérrez et al., 2016; Fierro et al., 2010; Byamba-Ochir et al., 2017), metal–organic skeletons (Ding et al., 2022), and biomass materials (Rehman et al., 2022; Du et al., 2020) have received wide attention from researchers because they are economical and environmentally friendly; have a controlled pore structure, large specific surface area, and high adsorption capacity; and are often used as solid adsorbents. In contrast, coal is an abundant natural resource with a low cost, and coal-based activated carbon also has high porosity and specific surface area, and thus, it is expected to achieve efficient CO2 capture.
At present, the research on CO2 capture using coal as an adsorbent mainly includes the following aspects: the preparation technology of modified coal samples, and its adsorption performance and adsorption mechanism research on CO2, CH4 and other gases. Modified coal samples with different pore sizes and specific surface areas were prepared by selecting coal samples of different coal rank, controlling carbonization and activation temperatures(Hamyali et al., 2022), and the modification of coal by additives(Shi et al., 2017) also improves the performance of CO2 capture. LI et al (Li et al., 2020) prepared nitrogen-doped coal samples with high micropore content using anthracite coal as a precursor, activated by KOH and treated with urea, and found that the N-modified coal samples showed desirable selectivity for CO2/CH4.WANG et al (Qi et al., 2022) prepared N-modified coal samples by calcining a mixture of anthracite, MgO, KOH, and urea, and found that the prepared materials possessed excellent SO2 adsorption capacity (115 mg/g). Due to the complex macromolecular structure of coal, its different functional groups have a direct influence on the adsorbate molecules (Dang et al., 2017; Qin et al., 2021; Jia et al., 2023), for example, the oxygenated functional groups in coal are the main adsorption sites for CH4/CO2/H2O (Gensterblum et al., 2014), and the adsorption sequence of oxygenated functional groups on CH4 is: carbonyl group > ether bond > hydroxyl group > carboxylic acid group (Zhu et al., 2021).QIN et al(He et al., 2017) The changes of functional groups after coal freezing were characterized by infrared spectroscopy measurements, and it was found that the gas adsorption of lignite decreased and then increased with the increase of the ratio of oxygenated functional groups, aromatic and aliphatic hydrocarbons. YU et al (Song et al., 2019) systematically investigated the oxygenated functional groups and electrostatic interactions of coals by GCMC and DFT-D3, and found that the oxygenated functional groups-induced microporous inhomogeneity, binding sites and affinity increase were more favorable for the interaction with CO2, and the introduction of oxygen-containing functional groups increased the specific surface area and enlarged the microporous diameter and space, especially carboxylation created a favorable microporous environment for adsorption.
Due to the molecular structure of aromatic hydrocarbons, oxygen-containing functional groups and aliphatic hydrocarbons in coal, the adsorption capacity of different gases varies significantly, while nitrogen doping combines basic sites into the carbon skeleton and increases the polarity of the carbon surface, and sulfur doping introduces reactive sites, which in turn improves the adsorption capacity for CO2. In order to deeply investigate the effects of temperature and pressure on the gas adsorption of doped atoms and different functional groups in coal, based on a series of grand canonical Monte Carlo (GCMC) computational simulations, microporous models of the interaction of N/S-doping with different functional groups (–OH, –COOH, –OCH3, –CH3, and –CH2CH3) in coal were constructed at different temperatures (293.15 K, 303.15 K, 313.15 K, and 323.15 K) and pressures (1–8 MPa). The microscopic level of CO2/CH4/N2 adsorption, heat of adsorption, diffusion coefficient, interaction energy, and relative density distribution were studied to reveal the mechanism of CO2/CH4/N2 adsorption via the synergistic effect of N/S atomic doping and functional groups in coal when the temperature and pressure were changed from different perspectives. The results of this study provide corresponding theoretical and technical references for CO2 capture using modified coal-based materials.
2 Materials and methods
2.1 Simulation settings
Ph-X-Y microporous models of N/S-doping on graphite flake layers interacting with different functional groups (–OH, –COOH, –OCH3, –CH3, and –CH2CH3) in coal (X denotes the N and S atoms, and Y denotes the five different functional groups) were constructed (Fig. 1). The GCMC method (Chai et al., 2022; Long et al., 2021) was used to study the adsorption properties of N/S-doping with functional groups on CO2/CH4/N2 at different temperatures and pressures using the Sorption and Forcite modules in the Materials Studio software. The adsorption temperature was set to 293.15 K, 303.15 K, 313.15 K, and 323.15 K (Charrière et al., 2010), the adsorption pressure was set to 1–8 MPa, and the graphite flake layer spacing was set to 0.8 nm (Thommes et al., 2015; Cheng and Hu, 2023).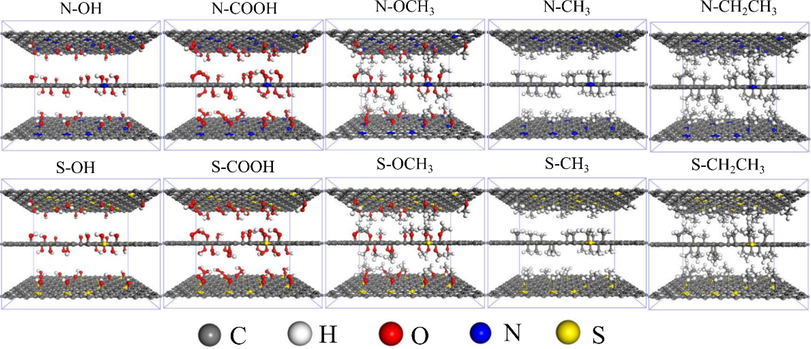
Microporous model constructed based on the interaction of N/S-doping with different functional groups in coal.
For the simulation using Materials Studio software, the geometry optimization, annealing and dynamics of the model were performed in the Forcite module (Jia et al., 2023; Jia et al., 2023; Yu et al., 2019) to obtain the low-energy steady state of the microporous model, the simulation force field was chosen to be COMPASS, the electrostatic force and van der Wal force were computed using Atom based, Times step is set to 1 fs, Total simulation time is set to 5 ps, Cutoff distance is set to 12.5 Å (less than half of the shortest side of the cell), and NVT is selected for Ensemble (Hu et al., 2017; Wang et al., 2020). The simulation of adsorption of CO2/CH4/N2 by the microporous model was carried out in the Sorption module, the adsorption task was set to Fixed pressure, the method was set to Metropolis, the Equilibration steps were set to 1 × 10⁵, the Production steps were set to 1 × 10⁶, and the charge was calculated in the Forcefield assigned to calculate charge, electrostatic force set to Ewald & Group.
2.2 Calculation method
For the adsorption simulation in the Materials Studio-Sorption module, the pressure P and the fugacity f need to be converted using the Peng-Robinson (P-R) equation of state (Yang et al., 2019; D. Dall’Acqua, A. Terenzi, M. Leporini, V. D’Alessandro, G. Giacchetta, B. Marchetti. , 2017; Huang and Yang, 2019; Salgueiro et al., 2021), and the conversion relationship is expressed in the following equations:
For mixtures composed of N components, the parameters a and b of the equation of state are commonly calculated using van der Waals' classical mixing rule (Li et al., 2017; Chen et al., 2019; Chen and Yang, 2019):
For a mixture composed of N components, the fugacity factor of any component k can be calculated as follows (Chen et al., 2019):
The fugacity and pressure conversions of CO2/CH4/N2 at temperatures of 293.15 K, 303.15 K, 313.15 K, and 323.15 K are shown in Fig. 2. As can be seen from Fig. 2, the deviation of the fugacity from the pressure is more obvious as the pressure increases, among which the deviation of the pressure from the fugacity is most obvious for CO2 at different temperatures. This is because the critical pressure
and the critical temperature
of CO2 are higher than those of CH4 and N2, which makes the values of the dimensionless constants describing the attractive and repulsive forces in the P-R equation larger, resulting in the deviation in the fugacity and pressure conversion process being larger than those of CH4 and N2.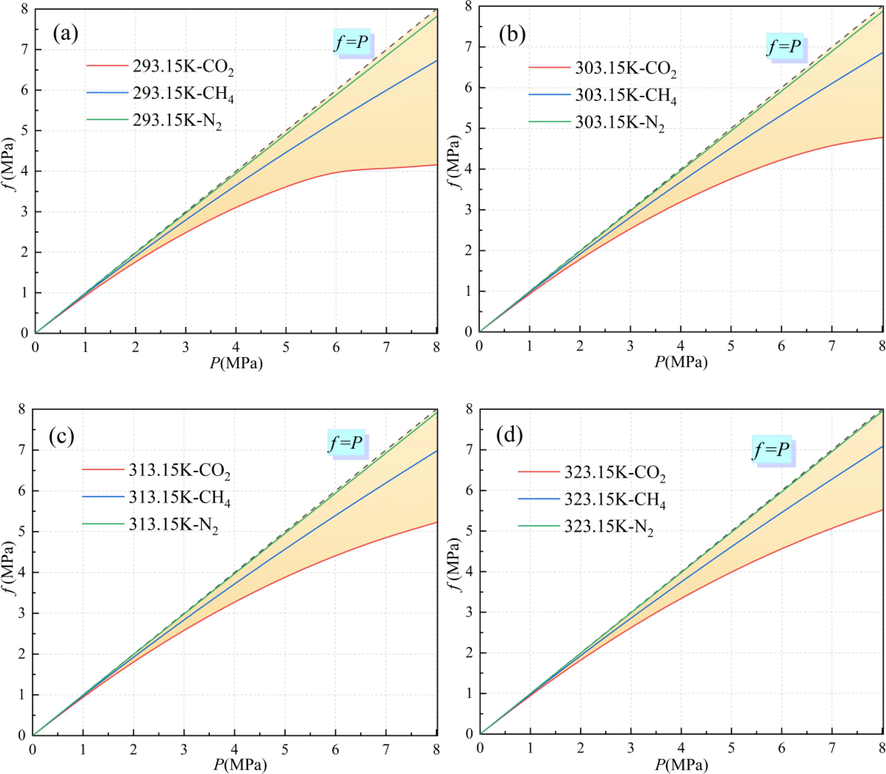
Fugacity and pressure transitions of CO2/CH4/N2 at different temperatures: (a) 293.15 K, (b) 303.15 K, (c) 313.15 K, and (d) 323.15 K.
The adsorption capacity of the gas was fitted using a two-parameter isotherm model, the Freundlich model, which can be applied to multilayer adsorption and is not limited to monomolecular layers, and is mostly used for adsorption phenomena in non-homogeneous systems (Wang et al., 2017). Eq. (6) is the Freundlich adsorption equation (A. Mohammad A, D. Dana A. , 2020; Walsh et al., 2020).
Where Qe is the adsorption amount at adsorption equilibrium, mmol/g; P is the gas adsorption equilibrium pressure, MPa; K is the Freundlich adsorption constant, mg K kg−1; 1/x is the non-uniformity of adsorption surface, which indicates the relative distribution of energy and the non-uniformity of adsorption sites. The value of 1/x is generally between 0 and 1, when 1>1/x>0, the adsorbate is easily adsorbed, when 1/x > 1, adsorption is difficult, so the smaller the value of 1/x, the better the adsorption performance.
Molecules will reduce their own surface energy by adsorbing gas molecules, which is the fundamental driving force for adsorption to occur, and the heat of adsorption is the heat released when the molecular surface interacts with the gas molecules during the adsorption process, and according to the magnitude of the heat of adsorption, it can be judged whether the adsorption occurs by physical adsorption or chemical adsorption. Eq. (7) is the calculation method of heat of adsorption (Qs), and Eq. (8) is the integral form of Eq. (7).
Where Qs is the heat of adsorption, kJ/mol; R is the gas constant, 8.314 J/(mol K); K is the Henry constant, through the Henry constant module in the Materials Studio can be obtained as a linear relationship between the change of lnK with 1/T, and the slope of the straight line can be multiplied by the gas constant to obtain the heat of adsorption.
3 Results and discussions
3.1 Adsorption of CO2/CH4/N2 by microporous model
To investigate the pore volume distribution in the Ph-X-Y microporous model, He, CO2, CH4, and N2, which have molecular kinetic radii of 0.13 nm, 0.165 nm, 0.19 nm, and 0.182 nm, respectively (Hanasaki et al., 2004; Huang et al., 2022), were used as molecular probes (Tables 1 and 2). There were obvious differences in the micropore volumes when the molecular probes had the same radius. The smallest micropore volume was detected in the Ph-X-CH2CH3 model, and the largest micropore volume was detected in the Ph-X-OH model, which was because the chemical bond length of –CH2CH3 is longer than those of the other functional groups when the graphite layers were equally spaced. After geometric optimization, –CH2CH3 occupied the micropore effective adsorption region in the model, resulting in a smaller volume of the model composed of it and different doped atoms. When CO2, CH4, and N2 were used as molecular probes, it was found that the microporous volume probed using CH4 was relatively small because it had the largest molecular kinetic radius, while the microporous volume probed using CO2 molecules was the largest. Furthermore, CO2 gas was more easily adsorbed than CH4 and N2 in terms of the size of the microporous pores providing adsorption space for the adsorbent molecules.
Molecular dynamics radius (nm)
Microporous volume of N-doped systems(Å3)
N-OH
N-COOH
N-OCH3
N-CH3
N-CH2CH3
0.130
5137.71
4688.26
4212.71
4765.38
3812.23
0.165
5099.11
4554.15
3933.48
4628.4
3489.71
0.190
5053.11
4410.21
3660.66
4499.15
3232.18
0.182
5066.46
4462.46
3753.52
4548.88
3319.28
Molecular dynamics radius (nm)
Microporous volume of S-doped systems(Å3)
S-OH
S-COOH
S-OCH3
S-CH3
S-CH2CH3
0.130
5101.19
4655.29
4184.49
4735.72
3791.12
0.165
5059.24
4528.91
3900.52
4607.46
3468.91
0.190
5021.52
4381.57
3623.44
4478.71
3210.98
0.182
5035.04
4435.18
3718.83
4529.29
3298.49
The microporous volumes of N- and S-doped gas probes with different molecular dynamics radii are shown in Fig. 3. As can be seen from Tables 1 and 2, the microporous volumes of the N-doped Ph-N-Y model were all larger than those of the S-doped microporous model when the functional groups were the same. This was due to the presence of two electron layers outside the nucleus of the N atom, which had a smaller atomic radius (0.075 nm), and three electron layers outside the nucleus of the S atom, which has a larger atomic radius (0.102 nm) than that of the S-doped microporous model. As shown in Fig. 3, the pore distribution of the Ph-S-CH2CH3 model is the most complex, and there is a complex micropore network with connected pores, while the pore distribution of the Ph-N-OH model is the simplest, and the effective adsorption space is through. In addition, the micropore network is relatively simple, so from the distribution of the micropore network after N- and S-doping, the adsorption effect of N-doping will be stronger than that of S-doping.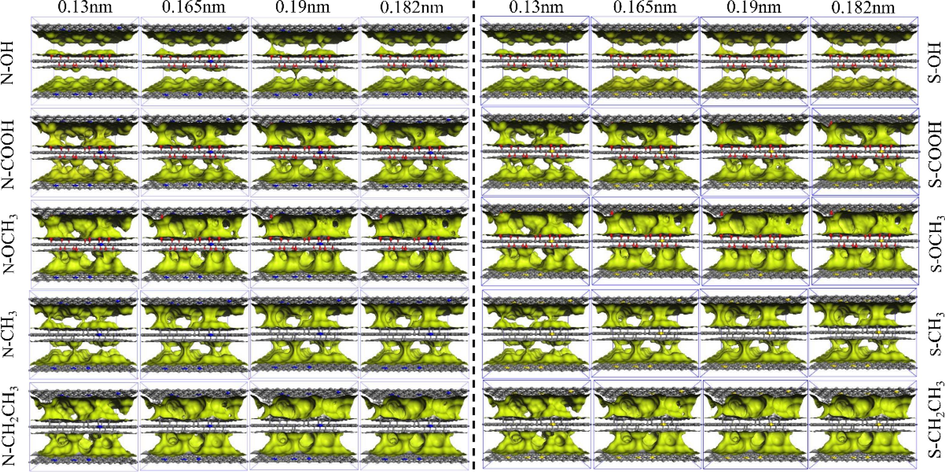
Detection of the pore volume of N- and S-doped microporous models using different molecular probes.
The adsorption of CO2 by the N/S-doped micropore model and its isotherms at different temperatures and pressures are shown in Fig. 4. It can be seen that the adsorption of the N-doped model was greater than that of the S-doped model in both the fast-growth and stable fluctuation phases of adsorption at the same temperature. This is because N-doping increases the active sites for gas adsorption in the micropore model compared with S-doping, and gas adsorption has an important relationship with the pore capacity of the adsorbent (Yu et al., 2022). Moreover, the pore capacity of the N-doped micropore is greater than that of the S-doped micropore, making the N-doped Ph-N-Y micropore model stronger than the S-doped Ph-N-Y micropore model for CO2 adsorption. The relationship between the magnitude of adsorption when N/S atoms interact with different functional groups is –OH > –COOH > –CH3 > –CH2CH3. With increasing temperature, the adsorption of CO2 by the Ph-X-Y microporous model gradually decreased, and the adsorption performance of the N/S atoms on different functional groups strengthened, among which the adsorption of CO2 by the Ph-N/S-OH model was gradually higher than those of the other microporous models with increasing pressure. After fitting the adsorption amount by Freundlich adsorption model, the fitted mean chi-square value (χ2) was 0.999, and the Freundlich isothermal adsorption model fitted the nonlinearity of the adsorption data of Ph-X-Y model better. And the 1/x values were 0.030, 0.041, 0.042 and 0.050 for the nitrogen-doped system and 0.047, 0.043, 0.047 and 0.052 for the sulfur-doped system for the four temperatures, respectively, and the 1/x value of the nitrogen-doped system was smaller at the same temperature, which indicated that the N-doped system adsorbed CO2 more easily. Therefore, when CO2 is captured by modified coal samples, N doping is better than S doping, and the higher adsorption temperature will make the capture effect worse. The average 1/x value of the Ph-N-OH system is smaller than that of the other systems, which is 0.029, indicating that the N atoms interact with the hydroxyl group for the best CO2 adsorption effect.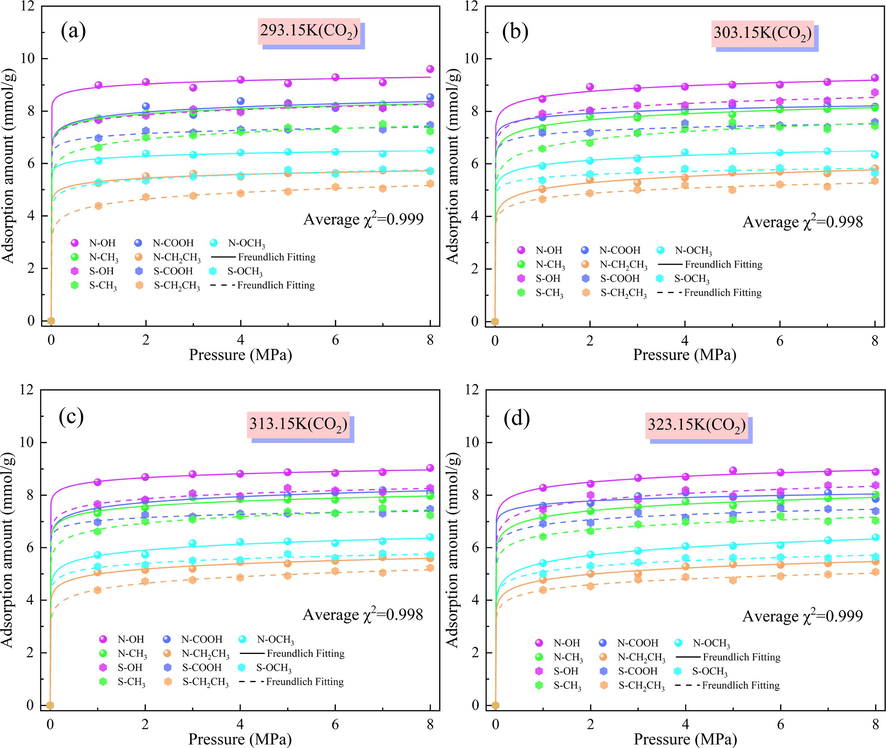
Amount of CO2 adsorbed by N/S-doped microporous models at different temperatures: (a) 293.15 K, (b) 303.15 K, (c) 313.15 K, and (d) 323.15 K.
The adsorption of CH4 by the N/S-doped micropore model and its isotherms at different temperatures and pressures are shown in Fig. 5. As can be seen, the adsorption of CH4 by the N-doped Ph-N-Y micropore model is stronger than that by the S-doped Ph-S-Y micropore model at the same temperature. After fitting the adsorption by Freundlich adsorption model, the fitted mean chi-square value (χ2) was 0.999, and the Freundlich adsorption model fitted the nonlinearity of the adsorption data of the Ph-X-Y model better. The adsorption of CH4 by N/S atoms interacting with different functional groups was lower than their adsorption of CO2, which was evident at a temperature of 323.15 K. The average adsorption amount of Ph-N-COOH on CO2 (7.859 mmol/g) is higher than that on CH4 (6.003 mmol/g), which shows a stronger loading capacity due to the strong interaction force between CO2 molecules. Due to the strong interaction force between CO2 molecules, CO2 showed a strong loading capacity, and its rate of occupying high-energy adsorption sites was faster than that of CH4, and the rate of CO2 adsorption was also greater than that of CH4 when the gas molecules moved to the lower energy adsorption sites until they tended to adsorb to saturation.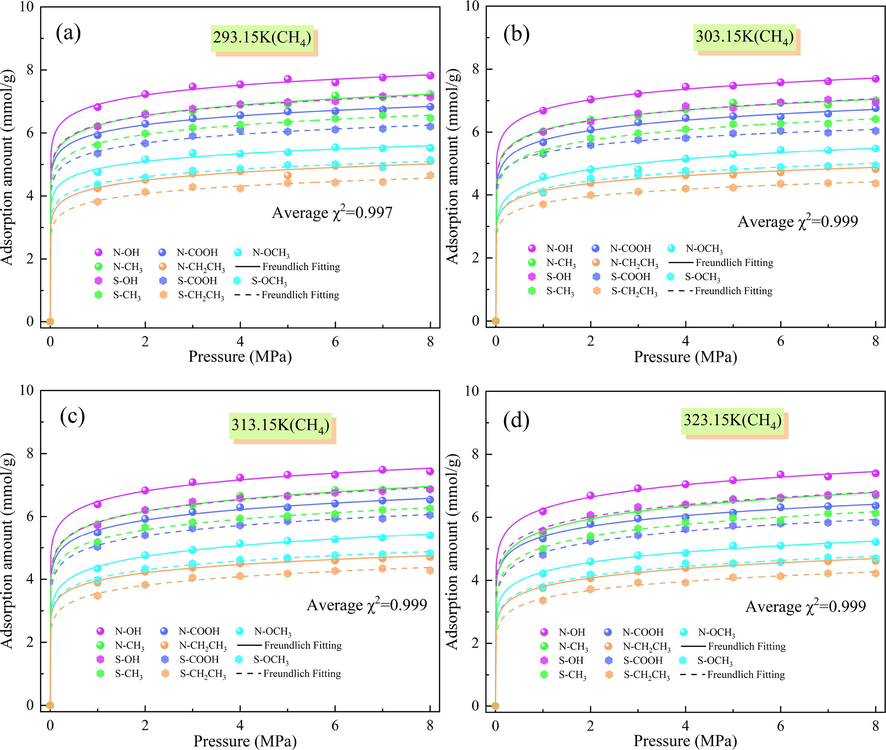
Amount of CH4 adsorbed by N/S-doped microporous models at different temperatures: (a) 293.15 K, (b) 303.15 K, (c) 313.15 K, and (d) 323.15 K.
The adsorption of N2 by the N/S-doped microporous model and its isotherm at different temperatures and pressures are shown in Fig. 6. The fitted mean chi-squared value (χ2) is 0.998 after fitting the amount of adsorption using the Freundlich adsorption model, and the Freundlich adsorption model fitted the nonlinearity of the adsorption data of the Ph-X-Y model better. At the same temperature, the adsorption of N2 by the N-doped Ph-N-Y microporous model was also stronger than that by the S-doped Ph-S-Y microporous model. The lowest adsorption of N2 by Ph-S-CH2CH3 was 2.380 mmol/g at an adsorption temperature of 323.15 K and an adsorption pressure of 1 MPa. The adsorption of N2 by the Ph-N-Y microporous model at different temperatures according to the magnitude of the amount of CO2, CH4, and N2 adsorbed was as follows: CO2 > CH4 > N2. This is because CH4 and N2 are non-polar molecules, and N-doping strengthens the polarity of the Ph-N-Y system and inhibits the adsorption of CH4 and N2 on the Ph-N-Y system.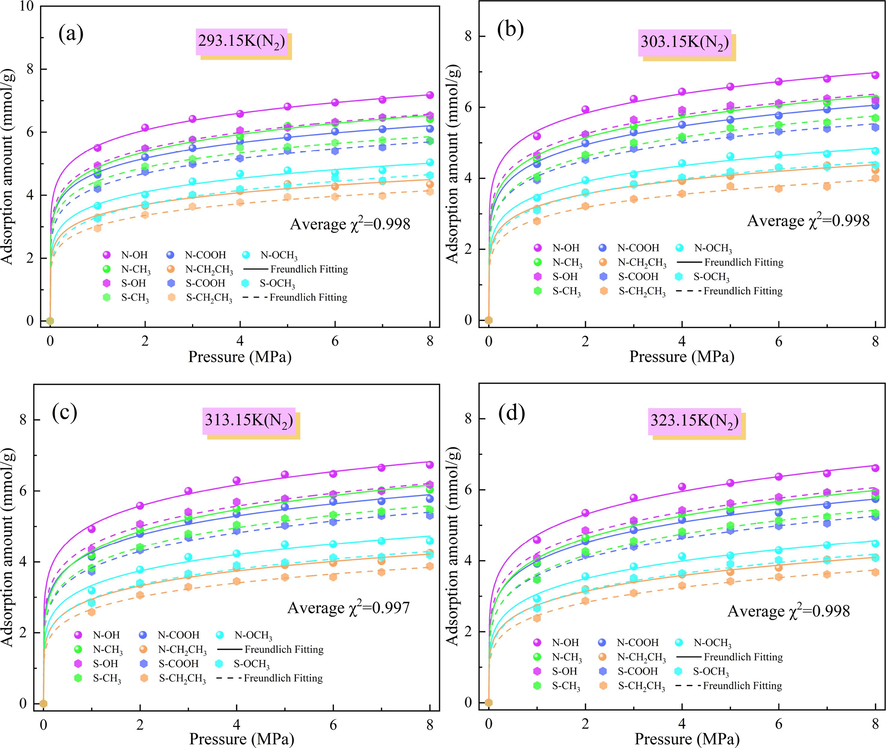
Amount of N2 adsorbed by N/S-doped microporous models at different temperatures: (a) 293.15 K, (b) 303.15 K, (c) 313.15 K, and (d) 323.15 K.
3.2 Adsorption thermodynamic properties
Fig. 7 shows the heat of adsorption of CO2/CH4/N2 by the N/S-doped system at different temperatures and pressures. Since the heat of adsorption can characterize the strength of the adsorption of CO2/CH4/N2 by the N/S-doped Ph-X-Y microporous model, the greater the heat of adsorption is during the adsorption process, the stronger the adsorption is. It can be seen from Fig. 7 that the heats of adsorption of the gases varied with and were inversely proportional to the temperature; the heats of adsorption of CO2, CH4, and N2 by the Ph-X-Y system at 293.15 K were greater than those of the other doped systems, the adsorption effect was the best. When the N/S atoms interacted with different functional groups, the heat of adsorption of the N-doped system was higher than that of the S-doped system. The magnitudes of the heats of adsorption of CO2, CH4, and N2 by the different doped systems were in the order of CO2 > CH4 > N2. The heat of adsorption of CO2 by the Ph-N-COOH system was higher than those of the other doped systems, with an average heat of adsorption of 10.585 kcal/mol, and the Ph-N-CH2CH3 system had higher heats of adsorption for CH4 and N2 than the other doped systems, with average heats of adsorption of 6.687 and 5.427 kcal/mol, respectively. This is because the heat of adsorption is not only affected by the amount of adsorption but is also limited by the surface inhomogeneity of the Ph-X-Y system (Gao et al., 2023). Therefore, from the perspective of the adsorption strength, coal samples with N-doping and higher –COOH contents should be selected for CO2 capture using the modified coal samples, while coal samples with more N-doped aliphatic functional groups should be selected for CH4 and N2 adsorption.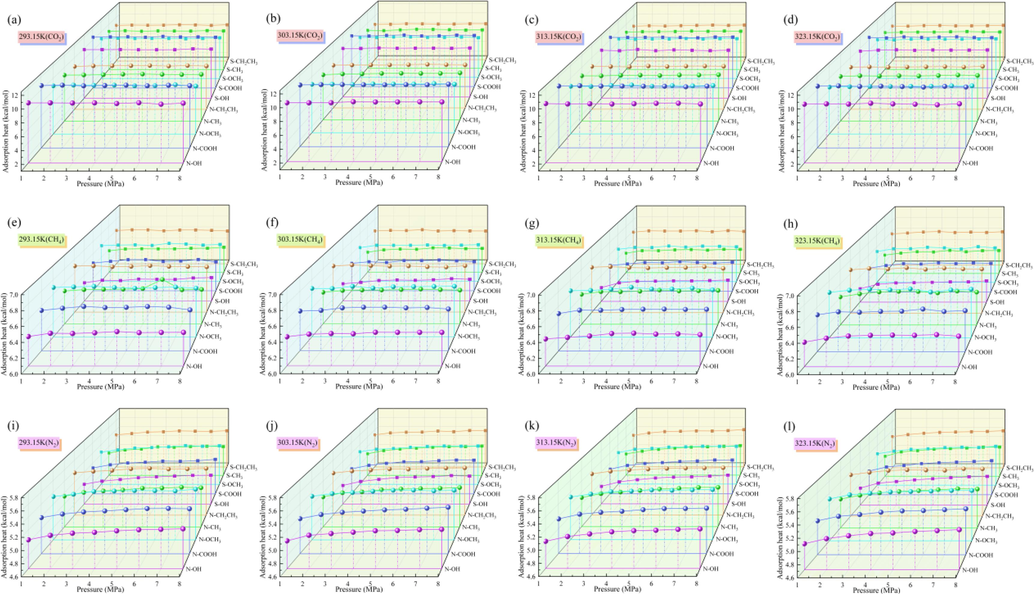
Adsorption heats of CO2, CH4, and N2 by N/S-doped systems at different temperatures.
The adsorption potential theory suggests that there exists an adsorption field around the adsorbent and the adsorbate molecules are attracted by the potential field to transform from the free state to the adsorbed state, according to the adsorption potential theory the change of Gibbs free energy (ΔG) can be calculated (Teicht, 2023; Monsalvo and Shapiro, 2009), and since the adsorption of CO2/CH4/N2 by the Ph-X-Y system is physical adsorption, the degree of freedom of the gaseous activity of the adsorbate molecules decreases with the increase of adsorption and decreases, ΔS < 0, so the entropy change of the adsorption process is calculated from the Gibb-Helmholtz equation (Olson, 2016; Moodley and Bansi, 2019), which is shown in Eq. (9).
Where: ε is the adsorption potential, kJ/mol; G is the Gibbs free energy, kJ/mol; S is the entropy of adsorption, kJ/mol; H is the enthalpy of adsorption, kJ/mol; T is the temperature of adsorption, K; P is the equilibrium pressure of adsorption, MPa; and Pc and Tc are the critical pressure and temperature of adsorbate, respectively.
The relationship between the amount of CO2/CH4/N2 adsorbed and the adsorption potential energy in the adsorption potential fields at adsorption temperatures of 293.15 K, 303.15 K, 313.15 K, and 323.15 K and adsorption pressures of 1–8 MPa is shown in Fig. 8. It can be seen from Fig. 8 that the adsorption amount of the adsorbent and the adsorption potential have an obvious inverse linear relationship, and the higher the temperature is, the lower the adsorption potential is when the adsorption amounts are equal. For the adsorption of CO2 by the Ph-X-Y system, the deviation from the linear fitted curve of the adsorption amount versus the adsorption potential at different temperatures is greater than those of CH4 and N2. This is due to the higher critical temperature and critical pressure of CO2, and the effects of the critical temperature and critical pressure on the adsorption potential energy of CO2 are greater than those of CH4 and N2 when the temperature fluctuates.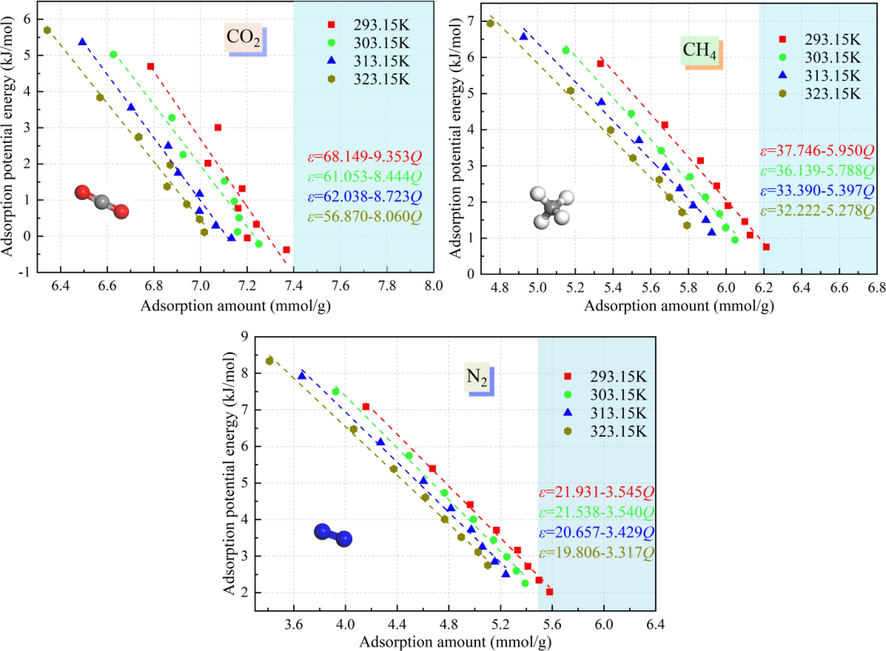
Relationships between amounts of CO2, CH4, and N2 adsorbed and the adsorption potential at different temperatures and pressures.
Fig. 9 shows the relationships between the adsorption entropy and the amounts of CO2, CH4, and N2 adsorbed by the Ph-X-Y system at different temperatures and pressures. Since the adsorption entropy reacts to the degree of disorder of the adsorption system, it can measure the restricted degree of adsorption of the adsorbent molecules in the Ph-X-Y system. As can be seen from Fig. 9, with increasing temperature, the adsorption of CO2/CH4/N2 by the Ph-X-Y system is a spontaneous process when the adsorption amount is equal. After the adsorption of the adsorbent molecules on the microporous surface, their degree of freedom decreases, and the absolute value of the adsorption entropy of CO2 gradually decreases, reflecting the lower degree of CO2/CH4/N2 disorder in the Ph-X-Y system, the stronger the constraint on CO2/CH4/N2 in the Ph-X-Y system is. The absolute adsorption entropy values of CO2, CH4, and N2 at the same temperature are in the order of CO2 > CH4 > N2, the degree of disorder of CO2 in the Ph-X-Y system is the lowest, and more CO2 molecules are transformed from the free state to the adsorbed state during the adsorption process.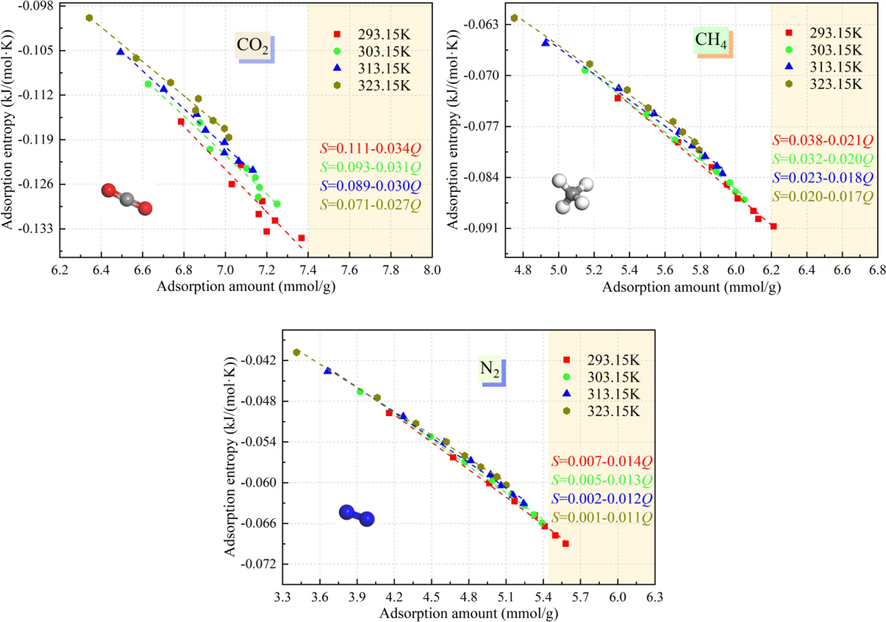
Relationship between CO2/CH4/N2 adsorption amount and adsorption entropy at different temperatures and pressures.
3.3 Gas diffusion coefficient
The influence of the diffusion properties of the gas in the adsorption process is an important indicator for studying the gas transport law in solid adsorbents, and the root mean square displacement (MSD) can be used in Materials Studio to analyze the diffusion state of the gas transport process (Long et al., 2021; Jia et al., 2023). The MSD reflects the evolution of the adsorbent molecules with time and measures the deviation of their instantaneous position from the initial position. Kinetic simulations were performed in the CO2/CH4/N2 adsorption process to calculate the MSD using the following equation:
The diffusion coefficient D of the adsorbent gas molecules in the Ph-X-Y system can be calculated from the root mean square displacement curve and Einstein's method(Hu et al., 2023); and the diffusion coefficient allows quantification of the migration pattern of the gas in the adsorbent:
Fig. 10 presents the root mean square displacement curves of CO2, CH4, and N2 in the N/S-doped system at different temperatures. As can be seen from Fig. 10, the MSD increases gradually with increasing temperature, and the MSD of adsorbent gas molecules is higher at 323.15 K. The MSDs of CO2, CH4, and N2 in the S-doped Ph-S-Y microporous model are larger than those in the N-doped system, and the MSD of N2 in the Ph-X-Y microporous model is the largest for a given temperature, which is because the Ph-X-Y system has a higher MSD. The adsorption of N2 is less effective, the effective adsorption sites for N2 are fewer, and a large number of N2 molecules are in the free state for disorderly diffusion. The linear fit to the MSD reveals that the linear fit accuracy is high, and the magnitudes of the slope of the linear fit of the root mean square displacement for the same atomic doping and the same temperature are in the order of CO2 < CH4 < N2. This also demonstrates that the N/S-doping had the best adsorption effect on CO2 when it interacted with different functional groups in coal. It was also found that the N-doped system had a stronger adsorption capacity according to the relationship between the slope of the linear fit of the root mean square displacement.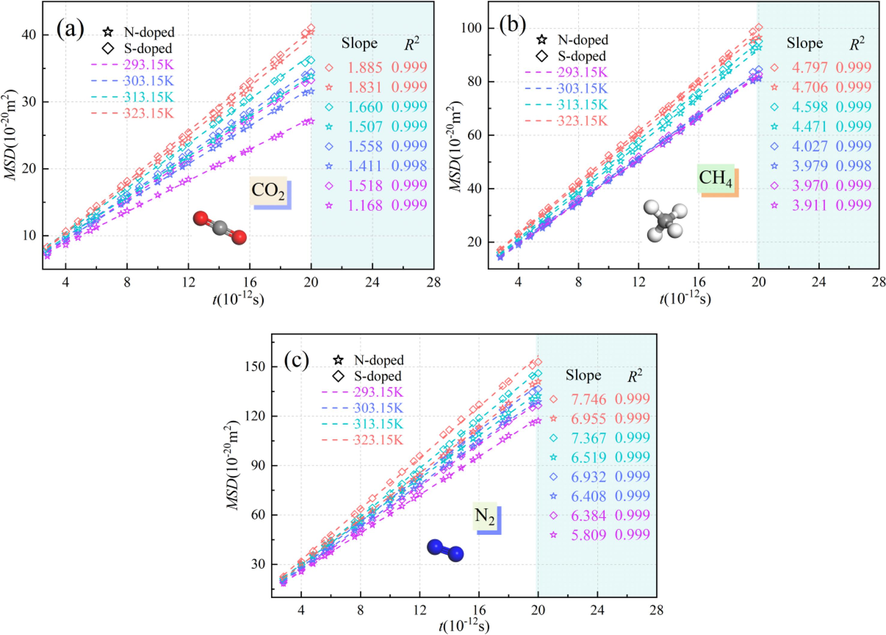
Mean square displacements of CO2, CH4, and N2 in the N/S-doped system at different temperatures.
The diffusion coefficients D of CO2, CH4, and N2 in the Ph-X-Y micropore model were calculated using Eq. (11) based on the MSD results (Fig. 11). It can be seen from Fig. 11 that the diffusion coefficients of the adsorbent molecules tended to increase as the adsorption temperature increased, and the diffusion coefficients of CO2, CH4, and N2 were the lowest at 293.15 K. The diffusion coefficient of CO2 in the Ph-X-Y microporous model was significantly lower than those of N2 and CH4, and the lowest diffusion coefficient of CO2 in the Ph-N-Y system at an adsorption temperature of 293.15 K was 0.1947 × 10⁻⁸ m2/s. The diffusion coefficients of CO2, CH4, and N2 were lower in the N-doped microporous system than in the S-doped microporous system, which also indicates that the N-doped modified coal sample had the best CO2 adsorption effect at an adsorption temperature of 293.15 K from the perspective of the gas diffusion coefficient.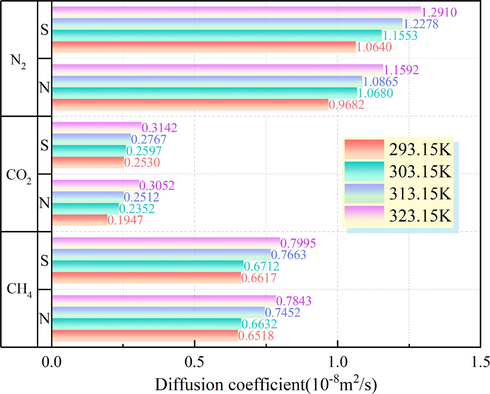
Diffusion coefficients of CO2, CH4, and N2 in the N/S-doped system at different temperatures.
3.4 Interaction energy
The interaction energy distribution curves of the adsorbent molecules can characterize the number of adsorption sites in the adsorbent and the strength of the adsorption effect. The farther the interaction energy curve is shifted to the left, the larger its absolute value is, the stronger the adsorption of CO2/CH4/N2 by the Ph-X-Y system. Fig. 12 shows the interaction energy distribution curves of CO2, CH4, and N2 for the microporous model of the interaction between N/S-doping and different functional groups in coal. Fig. 12(a) shows that the interaction energy distribution curve of the N-doped CO2 adsorption system plots the farthest to the left, the interaction between CO2 and the Ph-N-Y system is the strongest. Additionally, the interaction energy between the Ph-N-COOH system and CO2 (-15.044 kcal/mol) is stronger than those of the other systems, the interaction between N and –COOH is the most stable for the adsorption state of CO2. With the rightward shift of the interaction energy distribution curve, it can be seen from Fig. 12(a) and Fig. 12(b) that the interaction energies of the N/S-doped system for CH4 and N2 are lower than those for CO2. The interaction energy of the Ph-OCH3-N system with CH4 is the largest (-7.812 kcal/mol), and the interaction energy of Ph-CH2CH3-N for N2 is the largest (-6.075 kcal/mol), while the interaction energy of the N-doped microporous system with CH4/N2 is stronger than that of the S-doped system. From the perspective of the interaction energy, N-doped modification of coal samples could strengthen the adsorption stabilities of CO2, CH4, and N2, and the interaction of the N-doped system with –COOH would strengthen the adsorption stability of CO2.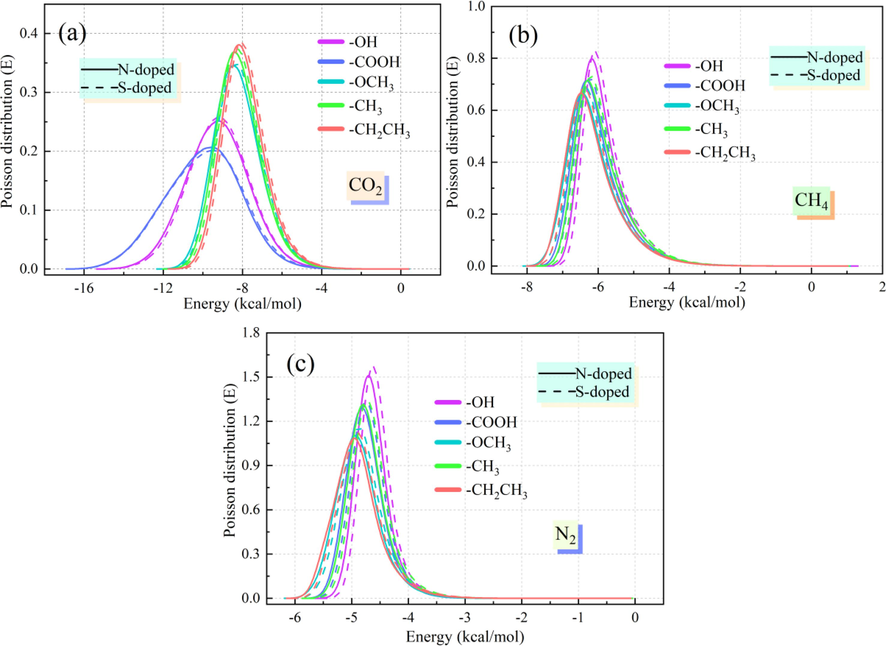
Interaction energy distribution of the N/S-doped system for CO2, CH4, and N2.
3.5 Relative concentration
To deeply analyze the adsorption distributions of CO2, CH4, and N2 in the Ph-X-Y microporous model, the relative density distribution of the adsorbent molecules in the N/S-doped system was investigated (Fig. 13). In the N/S-doped microporous system, the relative density distribution of CO2 is larger than those of CH4 and N2. That is, it is the most densely distributed, and it can be visualized from Fig. 13(a) that the CO2 molecules tend to preferentially adsorb near the pore wall. According to Fig. 13(b) and Fig. 13(c), there is also a tendency for CH4 and N2 molecules to adsorb on the surface of the microporous model, which indicates that the adsorbent molecules close to the pore wall interact more strongly with the surface of the Ph-X-Y microporous system. Furthermore, this phenomenon is most obvious in the Ph-N/S-CH2CH3 system, while the relative density peak of CO2/CH4/N2 is the largest, with an average density peak of 4.698. The relative density distribution of CO2/CH4/N2 is larger in the N-doped microporous model than in the S-doped system when the functional groups are the same. Therefore, from the perspective of the gas relative density, it was found that N-doping enhanced the CO2/CH4/N2 adsorption capacity of the modified coal sample’s pore surface.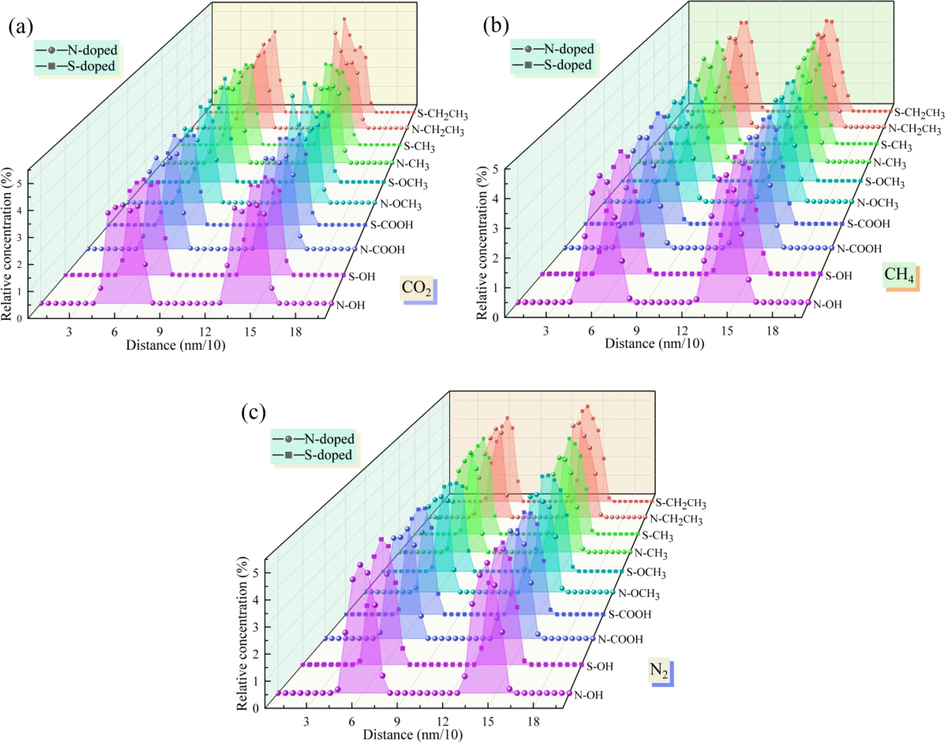
Relative concentration of the N/S-doped system for CO2/CH4/N2.
4 Conclusions
The adsorption characteristics of CO2, CH4, and N2 through the interaction of N/S-doping with different functional groups in coal at different temperatures (293.15 K, 303.15 K, 313.15 K, and 323.15 K) and pressures (1–8 MPa) were investigated using a series of GCMC simulations. Furthermore, the adsorption amount, heat of adsorption, diffusion coefficient, interaction energy, and relative concentration of the Ph-X-Y system for different gases were analyzed in detail. The conclusions of this study are as follows.
Analysis of the adsorption characteristics of the gas revealed that the microporous pore capacity of the N-doped system was larger than that of the S-doped system, and the pore distribution of the Ph-S-CH2CH3 system was the most complex, while the microporous network distribution of the Ph-N-OH system was simpler. The magnitudes of the heats of adsorption of CO2, CH4, and N2 of different doped systems were in the order of CO2 > CH4 > N2, and the magnitudes of the CO2, CH4, and N2 adsorption potentials were in the order of CO2 < CH4 < N2. N-doping enhanced the adsorption capacities of CO2, CH4, and N2 on the pore surfaces of the modified coal samples. When CO2 is captured by modified coal samples, coal samples with more N-doped carboxyl groups should be selected, and the higher adsorption temperature will make the capture effect worse. Furthermore, the adsorption of CH4 and N2 should be selected from coal samples with more N-doped aliphatic functional groups.
CRediT authorship contribution statement
Jinzhang Jia: Conceptualization, Funding acquisition, Data curation, Methodology, Investigation, Validation, Writing – original draft, Project administration. Hailong Song: Conceptualization, Data curation, Formal analysis, Investigation, Methodology, Software, Visualization, Writing – original draft. Peng Jia: Investigation, Methodology, Data curation, Formal analysis, Writing – review & editing. Bin Li: Methodology, Formal analysis, Visualization.
Acknowledgement
This research is conducted with financial support from the National Natural Science Foundation of China (No.52174183 and 52374203) and Liaoning Province Doctoral Research Start-up Fund Project (No.2023-BS-203).
Declaration of Competing Interest
The authors declare that they have no known competing financial interests or personal relationships that could have appeared to influence the work reported in this paper.
References
- Adsorption performance indicators for the CO2/CH4 separation: Application to biomass-based activated carbons[J] Fuel Process. Technol.. 2016;142:361-369.
- [Google Scholar]
- Carbon capture and storage (CCS): the way forward[J] Energy Environ. Sci.. 2018;11:1062-1176.
- [Google Scholar]
- High density Mongolian anthracite based porous carbon monoliths for methane storage by adsorption[J] Appl. Energy. 2017;190:257-265.
- [Google Scholar]
- Effect of Mn-doped CaO on NO reduction by CO in carbonation stage of calcium looping: A density functional theory study[J] J. Environ. Chem. Eng.. 2022;10(1):106987
- [Google Scholar]
- Effect of pressure and temperature on diffusion of CO2 and CH4 into coal from the Lorraine basin (France)[J] Int. J. Coal Geol.. 2010;81(4):373-380.
- [Google Scholar]
- Quantification of viscosity for solvents−heavy oil/bitumen systems in the presence of water at high pressures and elevated temperatures[J] Ind. Eng. Chem. Res.. 2019;58(2):1044-1054.
- [Google Scholar]
- Phase equilibrium measurement, thermodynamics modeling and process simulation for extraction of phenols from coal chemical wastewater with methyl propyl ketone[J] Chem. Eng. Res. Design. 2019;147:587-596.
- [Google Scholar]
- Correlations/estimation of equilibrium interfacial tension for methane/CO2-water/brine systems based on mutual solubility[J] Fluid Phase Equilib.. 2019;483:197-208.
- [Google Scholar]
- A new pore classification method based on the methane occurrence and migration characteristics in coal[J] J. China Coal Soc.. 2023;48(1):212-225.
- [Google Scholar]
- Carbon capture, storage and utilization technologies: A critical analysis and comparison of their life cycle environmental impacts[J] J. CO2 Util.. 2015;9:82-102.
- [Google Scholar]
- D. Dall’Acqua, A. Terenzi, M. Leporini, V. D’Alessandro, G. Giacchetta, B. Marchetti. A new tool for modelling the decompression behaviour of CO2 with impurities using the Peng-Robinson equation of state[J]. Applied Energy, 2017, 206: 1432-1445.
- Molecular simulation of CO2/CH4 adsorption in brown coal: Effect of oxygen-, nitrogen-, and sulfur-containing functional groups[J] Appl. Surf. Sci.. 2017;423:33-42.
- [Google Scholar]
- The synthesis of MOF derived carbon and its application in water treatment[J] Nano Res.. 2022;15(8):6793-6818.
- [Google Scholar]
- Surface modification of biomass derived toluene adsorbent: hierarchically porous characterization and heteroatom doped effect[J] Microporous Mesoporous Mater.. 2020;293:109831
- [Google Scholar]
- Adsorption and compression contributions to hydrogen storage in activated anthracites[J] Int. J. Hydrogen Energy. 2010;35(17):9038-9045.
- [Google Scholar]
- Adsorption kinetics and thermodynamics of hydroquinone with aid of diatomite-modified wood ceramics[J] Ceram. Int.. 2023;49(11):17109-17115.
- [Google Scholar]
- Molecular concept and experimental evidence of competitive adsorption of H2O, CO2 and CH4 on organic material[J] Fuel. 2014;115:581-588.
- [Google Scholar]
- CO2 capture by adsorption on biomass-derived activated char: A review[J] Sci. Total Environ.. 2021;798:149296
- [Google Scholar]
- Anthracite coal-derived activated carbon as an effectiveness adsorbent for superior gas adsorption and CO2/N2 and CO2/CH4 selectivity: Experimental and DFT study[J]. Journal of Environmental. Chem. Eng.. 2022;10(1):107007
- [Google Scholar]
- Molecular dynamics study of Ar flow and He flow inside carbon nanotube junction as a molecular nozzle and diffuser[J] Sci. Technol. Adv. Mater.. 2004;5(1–2):107-113.
- [Google Scholar]
- FTIR and Raman spectroscopy characterization of functional groups in various rank coals[J] Fuel. 2017;206:555-563.
- [Google Scholar]
- Detailed study on self- and multicomponent diffusion of CO2-CH4 gas mixture in coal by molecular simulation[J] Fuel. 2017;187:220-228.
- [Google Scholar]
- Water adsorption and diffusion in phosphoric acid-based geopolymer using molecular modeling[J] J. Solid State Chem.. 2023;320:123830
- [Google Scholar]
- Diffusion behavior of gas molecules in the one-dimensional channel of AlPO4-5 molecular sieves[J] Microporous Mesoporous Mater.. 2022;340:112024
- [Google Scholar]
- Improved enthalpy prediction of hydrocarbon fractions with a modified alpha function for the Peng-Robinson equation of state[J] Fuel. 2019;255:115840
- [Google Scholar]
- Adsorption of CH4/CO2/N2 by different functional groups in coal[J] Fuel. 2023;335:127062
- [Google Scholar]
- Molecular simulation study on the effect of coal metamorphism on the competitive adsorption of CO2/CH4 in binary system[J] Fuel. 2023;335:127046
- [Google Scholar]
- Molecular simulation of methane adsorption properties of coal samples with different coal rank superposition states[J] ACS Omega. 2023;8(3):3461-3469.
- [Google Scholar]
- Molecular simulation of adsorption of gas in coal slit model under the action of liquid nitrogen[J] Fuel. 2019;255:115775
- [Google Scholar]
- Phase behavior of C3H8–CO2–heavy oil systems in the presence of aqueous phase under reservoir conditions[J] Fuel. 2017;209:358-370.
- [Google Scholar]
- Highly microporous nitrogen-doped carbons from anthracite for effective CO2 capture and CO2/CH4 separation[J] Energy. 2020;211:118561
- [Google Scholar]
- Quantitative evaluation of the effect of gas adsorption and desorption hysteresis on gas flow in coal[J] Fuel. 2022;328:125189
- [Google Scholar]
- Adsorption and diffusion characteristics of CH4, CO2, and N2 in micropores and mesopores of bituminous coal: Molecular dynamics[J] Fuel. 2021;292:120268
- [Google Scholar]
- A. Mohammad A, D. Dana A. Guidelines for the use and interpretation of adsorption isotherm models: A review[J]. Journal of Hazardous Materials, 2020, 393: 122383.
- Study of high-pressure adsorption from supercritical fluids by the potential theory[J] Fluid Phase Equilib.. 2009;283(1–2):56-64.
- [Google Scholar]
- GE model independent application of the Gibbs-Helmholtz validation method to P-x data[J] Fluid Phase Equilib.. 2019;502:112299
- [Google Scholar]
- Olajumobi Akeeb, L Wang, W Xie, R Davis, Malek Alkasrawi b, Sam Toan. Post-combustion CO2 capture via a variety of temperature ranges and material adsorption process: A review[J]. Journal of Environmental Management, 2022, 313: 115026.
- Thermodynamic consistency testing of PTx-data via the Gibbs-Helmholtz equation 2.: Methodology and limitations[J] Fluid Phase Equilib. 2016
- [Google Scholar]
- Conversion of coal into N-doped porous carbon for high-performance SO2 adsorption[J] RSC Adv.. 2022;12(32):20640-20648.
- [Google Scholar]
- Gas adsorption capacity of coal frozen with liquid nitrogen and variations in the proportions of the organic functional groups on the coal after freezing[J] Energy Fuel. 2021;35(2):1404-1413.
- [Google Scholar]
- Valorization of orange peel waste to tunable heteroatom-doped hydrochar-derived microporous carbons for selective CO2 adsorption and separation[J] Sci. Total Environ.. 2022;849:157805
- [Google Scholar]
- New volume translation functions for biodiesel density prediction with the Peng-Robinson Equation of state in terms of its raw materials[J] Fuel. 2021;293:120254
- [Google Scholar]
- Sulfur doped microporous carbons for CO2 adsorption[J] J. Environ. Chem. Eng.. 2017;5(5):4605-4611.
- [Google Scholar]
- New experimental data on equilibrium CO2 loading into aqueous 3-dimethyl amino-1-propanol and 1,5-diamino-2-methylpentane blend: Empirical model and CO2 absorption enthalpy[J] J. Chem. Eng. Data. 2021;66(1):740-748.
- [Google Scholar]
- Competitive adsorption of CO2/N2/CH4 onto coal vitrinite macromolecular: Effects of electrostatic interactions and oxygen functionalities[J] Fuel. 2019;235:23-38.
- [Google Scholar]
- An easy-to-use modification of the potential theory of adsorption and creation of an adsorbent data base[J] Energy. 2023;263:125968
- [Google Scholar]
- Physisorption of gases, with special reference to the evaluation of surface area and pore size distribution (IUPAC Technical Report)[J] Pure Appl. Chem.. 2015;87(9–10):1051-1069.
- [Google Scholar]
- Equilibrium data and its analysis with the Freundlich model in the adsorption of arsenic(V) on granular ferric hydroxide[J] Sep. Purif. Technol.. 2020;243:116704
- [Google Scholar]
- Comparison of Langmuir and Freundlich adsorption equations within the SWAT-K model for assessing potassium environmental losses at basin scale[J] Agric. Water Manag.. 2017;180:205-211.
- [Google Scholar]
- Examination of adsorption behaviors of carbon dioxide and methane in oxidized coal seams[J] Fuel. 2020;273:117599
- [Google Scholar]
- A review on the progress and prospects of oxy-fuel carbon capture and sequestration (CCS) technology[J] Fuel. 2022;308:122057
- [Google Scholar]
- Determination of confined fluid phase behavior using extended Peng-Robinson [J] Chem. Eng. J.. 2019;378:122032
- [Google Scholar]
- Competitive adsorption of CO2/N2/CH4 onto coal vitrinite macromolecular: Effects of electrostatic interactions and oxygen functionalities[J] Fuel. 2019;235:23-38.
- [Google Scholar]
- Mechanism of ozone adsorption and activation on B-, N-, P-, and Si-doped graphene: A DFT study[J] Chem. Eng. J.. 2022;430:133114
- [Google Scholar]
- A parametric study of CO2/N2 gas separation membrane processes for post-combustion capture[J] J. Membr. Sci.. 2008;325(1):284-294.
- [Google Scholar]
- Molecular model construction of Danhou lignite and study on adsorption of CH4 by oxygen functional groups[J] Environ. Sci. Pollut. Res.. 2021;28(20):25368-25381.
- [Google Scholar]


