

Translate this page into:
Adsorption of basic green 4 onto gasified Glyricidia sepium woodchip based activated carbon: Optimization, characterization, batch and column study
⁎Corresponding author at: School of Chemical Engineering, Engineering Campus, Universiti Sains Malaysia, 14300 Nibong Tebal, Penang, Malaysia. chazmier@usm.my (Mohd Azmier Ahmad)
-
Received: ,
Accepted: ,
This article was originally published by Elsevier and was migrated to Scientific Scholar after the change of Publisher.
Peer review under responsibility of King Saud University.
Abstract
The abundance of gasification char residues which contributed to solid waste management problem is one of the major concerns in biomass gasification industry. This study focuses on synthesizing gasified Glyricidia sepium woodchip based activated carbon (GGSWAC) for the removal of basic green 4 (BG4) dye, evaluating the GGSWAC physicochemical properties and assessing the BG4 adsorption performance in batch and fixed-bed column systems. The optimal conditions of GGSWAC synthesis were at radiation power, time, and impregnation ratio (IR) of 616 W, 1 min and 1.93 g/g, respectively. The surface area (SBET) and total pore volume (TPV) of GGSWAC were 633.30 m2/g and 0.34 cm3/g, respectively. The Fritz–Schlünder best fitted to the experimental data at all temperatures in the isothermal studies, indicating a monolayer adsorption. The kinetic study showed that BG4 adsorption followed Avrami kinetic model. Based on thermodynamic parameters, the adsorption of BG4 dye onto GGSWAC was an endothermic and spontaneous process. In continuous operation, the Thomas and Yoon–Nelson models successfully predicted BG4 adsorption onto GGSWAC. The low production cost of 0.54 USD/kg showed that GGSWAC is economically feasible for commercialization.
Keywords
Gasification waste
Adsorption
Kinetics
Activated carbon
Characterization

1 Introduction
The global activated carbon (AC) market accounted for $4.12 billion in 2017 and is expected to reach $14.21 billion by 2026 (S. M. R. C. P. Ltd, 2018). Key growth factors include an increasing need for water treatment plants, rising pollution, and increased industrialization and urbanization. However, the high price of raw materials restricts the rapid expansion.
One of the possible pre-cursors for activated carbon is gasification char. According to the IMARC Group (IMARC Group, 2017), it is estimated that the gasification market reached USD 78 Billion in 2017 and is anticipated to reach USD 126 Billion by 2023. The growth in the gasification market means a significant increase in gasification char (GC) disposal which is generated at a rate of 5–10% of the initial feedstock (De Gisi et al., 2016). GC, which is presently treated as waste (Benedetti et al., 2017), can be further developed as activated carbon for water treatment. Gasification char is the finer component of the gasifier solid residuals, comprised of unreacted carbon with several amounts of siliceous ash. It possesses good characteristic as an adsorbent due to its well-developed pore properties. However, research on its use in adsorption is very rare, despite its high potential as an adsorbent in water and wastewater treatment applications.
Among the various technologies for pollutants removal, the adsorption process using activated carbon has proven to be superior compared to other techniques in terms of its simplicity of design, high efficiency, and ease of operation (Selvaraju and Bakar, 2017; Dai, 2018) Many textile industries use commercial activated carbon for dye waste treatment (Yagub et al., 2014). However, due to its high costs (such as manufacturing cost and regeneration cost) and dependency on non-renewable resources, there has been significant research in seeking a low-cost adsorbent as an alternative to the existing activated carbon in the market.
Basic green 4 (BG4) is a dye used to prevent fungal infections in commercial fisheries. Leucomalachite green is formed from basic green 4 and remains in the tissues of exposed fish. The use of BG4 for any aquatic species is not approved by the FDA or the U.S. Environmental Protection Agency (U.S. Department Of Health And Human Services, 2008). However, it is still being used as an antiparasitic and antifungal agent in aquacultures because stakeholders are unaware of the potential genotoxic and carcinogenic properties of BG4, and in addition, BG4 is relatively inexpensive, readily available, and highly efficacious (Shariff et al., 2018).
To date, there have been no reported studies on BG4 removal using carbon residues from biomass gasification plants. This study aimed to synthesize AC using GC residues from commercial gasification plants and examine their characteristics and BG4 removal efficiency. The study was conducted both in batch and continuous operation to investigate the equilibrium and kinetic behaviour of BG4 adsorption. A non-linear regression technique was applied, as linear equations in regression analyses can create various errors, originating from the removal of arbitrary data to improve linearity. In addition, the economic feasibility of GGSWAC has been included in this paper. The outcome of this research is significant in providing better insight for the application of gasification residues in wastewater treatment.
2 Materials and methods
2.1 Materials
2.1.1 Precursor preparation and physicochemical activation
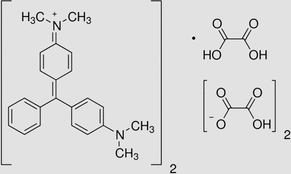
Gasification waste from Glyricidia sepium woodchip (GGSW) were obtained from a commercial gasification plant in Sri Lanka. All chemicals used in this study were of analytical grade supplied from Sigma Aldrich. Details on BG 4 was given in Table 1:
Molecular formula
Molecular weight
Chemical structure
C52H54N4O12
927.01 g/mol
The sample of GGSW was washed, dried in an oven at 105 °C for 24 h and treated with potassium hydroxide (KOH) at various impregnation ratios (IR), as calculated by:
2.2 Characterization methods
Nitrogen adsorption–desorption measurements (Model: Micromeritics ASAP 2020, USA) were performed to determine the Brunauer–Emmett–Teller (BET) surface area, Barrett-Joyner-Halenda (BJH) pore size distribution, total pore volume (TPV), and average pore diameter (APD) of the sample. The surface morphology of the samples was examined via scanning electron microscopy (Model: LEO SUPRA 55VP, Germany). The proximate analysis was analysed using TGA equipment (Model: Perkin Elmer STA 6000, USA), while elemental analysis was conducted using a CHONS analyser (Model: Perkin Elmer Series II 2400, USA). Fourier-transform infrared (Model: Shimadzu Prestige 21, Japan) spectroscopy was used to evaluate the chemical structural properties. The sample was mixed with KBr powder and the mixture was pressed into pellet. The spectra were recorded from 4000 to 400 cm−1, 40 scans were taken at a resolution of 4 cm−1.
2.3 Experimental design
Presently, AC are mostly synthesized using ‘‘one-factor-at-a-time” (OFAT) approach, whereby the parameter of interest is varied whilst the other parameters are fixed. Nevertheless, the conventional approach is time-consuming and requires few numbers of experiment, making it unfavourable from the economic perspective. The approach also fails to describe the interaction of these parameters with the chosen response. Therefore, a useful tool called as RSM was employed for developing, improving and optimizing the preparation condition of AC. Standard Response Surface Methodology (RSM) with Central Composite Design (CCD) was used to optimize the GGSWAC preparation conditions based on BG4 removal efficiency and obtained yield. Three variables were used including radiation power (A), activation time (B), and impregnation ratio (C) as shown in Table 2.
Variable
Code
Unit
Coded values
−1
0
1
Radiation power
x1
W
264
440
616
Radiation time
x2
min
1
4.5
8
Impregnation ratio (IR)
x3
g/g
0.5
1.25
2
A total of 20 experiments were performed for the three factors which consisted of 14 experiments plus 6 replicate parameters to evaluate the pure error. The corresponding model is a quadratic model, expressed by Eq. (2):
The adsorption process was conducted in a water bath shaker, using a 250 mL conical flask at an initial BG4 concentration, GGSWAC dosage, shaker speed, and temperature of 100 mg/L, 0.2 g, 150 rpm, and 30 °C, respectively.
2.4 Equilibrium study
The adsorption of BG4 was conducted at various initial BG4 concentrations (50–300 mg/L) and temperatures (40, 45 and 60 °C) using a water bath shaker for 24 h. In each test, GGSWAC with a mass of 0.2 g was added to the 200 mL BG4 solution. The experimental points were examined using isotherm models, as listed in Table 3. Due to several limitations of Langmuir and Freundlich models, other 3 and 4 parameter isotherms were also employed to predict the adsorption behaviour of BG4 onto the adsorbent. These non-linear equations were solved using a curve fitting tool provided in MATLAB R2019b.
Isotherm
Equation
Parameter
Model description
Ref
Freundlich
An empirical model assuming that the distribution of the heat on the adsorbent surface is non-uniform.
(Freundlich, 1906)
Langmuir
Assuming monolayer adsorption occurs on the solid surface with identical homogeneous sites.
(Langmuir, 1918)
Dubinin-Radushkevish (D-R)
Often used to estimate the characteristic porosity in addition to the apparent free energy of adsorption.
(Temkin and Pyzhev, 1940)
Temkin
Heat of adsorption decrease linearly rather than logarithmically due to adsorbate–adsorbent interactions.
(Ayawei et al., 2017; Redlich and Peterson, 1959)
Redlich-Peterson (R-P)
Valid when the mechanism of adsorption is a hybrid and does not follow ideal monolayer adsorption.
(Saravanan et al., 2018; Sips, 1948)
Sips
Valid for predicting the heterogeneous adsorption systems and localized adsorption without adsorbate–adsorbate interactions.
(Popoola et al., 2019; Koble and Corrigan, 1952)
Koble-Corrigan (K-C)
Incorporates both Langmuir and Freundlich isotherms. Mostly applied for heterogeneous adsorbent surface.
(Wakkel et al., 2019; Fritz and Schluender, 1974)
Fritz–Schlünder (F-S)
An empirical equation which can fit a wide range of experimental data.
(Fritz and Schluender, 1974)
n-layer BET
Assuming that there are a maximum n layers that can be adsorbed onto the internal surface of adsorbent.
(Gritti and Guiochon, 2003; Ebadi et al., 2009; Scheufele, 2016; Toth, 1971)
Toth
Best suited to multilayer adsorption.
(Toth, 1971)
2.5 Kinetic study
The same steps described previously were followed for the desired contact time ranging from 15 to 1440 min. Non-linear kinetic models were used to evaluate the effects of contact time on BG4 adsorption as shown in Table 4. A curve fitting tool provided in MATLAB R2019b was used to solve the non-linear equations.
Isotherm
Equation
Parameter
Description
Ref
Pseudo-first order (PFO)
The change in rate of the solute uptake with time is directly proportional to the difference in saturation concentration and the solute uptake with time.
(Lagergren, 1898)
Pseudo-second order (PSO)
The rate limiting step are chemisorption involves forces by sharing or exchanging electrons between the adsorbent and the adsorbate.
(Ho and Mckay, 1999)
Elovich
Commonly used in chemisorption processes.
(Low, 1960)
Avrami
Used to verify specific changes of kinetic parameters as functions of temperature and reaction time.
For unusual adsorption kinetic quantities when the adsorption rate is very slow and presents more than one adsorption mechanism.(Avrami, 1939)
2.6 Thermodynamic study
Thermodynamic parameters of BG4 adsorption were studied by applying the van’t Hoff equation (Saha and Chowdhury, 2011):
is the equilibrium constant (dimensionless), is the Gibbs energy change, is the enthalpy change, is the entropy change and is the universal gas constant.
The standard free energy change was calculated as:
The thermodynamic equilibrium constant was approximated by the equilibrium constant of the monolayer (KS) (provided in the BET equation) (Ebadi et al., 2009; Qu et al., 2019). This simplification is only valid for dilute solutions such as dye molecules (Liu, 2009).
The calculation of the thermodynamic equilibrium constant was based on following equation:
is the standard concentration of the adsorbate, whose concentration by definition is 1 mol/L at standard conditions and is the coefficient of activity of the adsorbate (dimensionless) (Lima et al., 2019).
It is assumed that the solution is sufficiently diluted to consider that the activity coefficient (which is a function of the ionic strength of the solute at adsorption equilibrium and the charge carried by solute) is unitary (Kasperiski et al., 2018).
2.7 Continuous adsorption study
The adsorption of BG4 was evaluated in continuous adsorption mode using a 14 mm inner diameter glass tube with a length of 160 mm. BG4 solution with an initial concentration of 100 mg/L was pumped upward through the column at a desired flow rate by a peristaltic pump (0.5, 1 and 2 mL/min). Samples were gathered from the exit of the column, and the operation of the column was stopped when saturation occurred (Ct/C0 reached unity). The BG4 concentration in the effluent was determined using a UV/Vis spectrophotometer at 617 nm.
For the analysis of experimental breakthrough curves, the Thomas Eq. (7) (Jain and Gogate, 2018; Yoon and Nelson, 1984) Yoon–Nelson Eq. (8) (Lonappan et al., 2019; Bohart and Adams, 1920) and Bohart–Adam Eq. (9) (Jang and Lee, 2019; Lam et al., 2017) models were used:
2.8 Economic analysis
The production cost of GGSWAC was estimated using the method adopted from Selvaraju and Bakar (2017), Lam et al. (2017) and Liew et al. (2018) to determine the feasibility of GGSWAC for commercialization.
3 Results & discussion
3.1 Experimental results
Table 4 shows the experimental results for GGSWAC obtained for the two investigated responses. For both responses, the quadratic model was selected and the final empirical formulas for BG4 removal (Y1) and GGSWAC yield (Y2), in terms of the coded factors, are given by Eqs. (10) - (11).
The R2 values of Eq. (10) and (11) are 0.8305 and 0.9191, respectively, indicating that the predicted values for BG4 removal and GGSWAC yield reasonably matched the actual value.
From Table 5, it was observed that high IR, radiation power, and time resulted in better BG4 removal but reduced the GGSWAC yield. Thus, an optimized solution is necessary to compromise both responses.
Run
A: Power
B: Time
C: IR Ratio
BG4 Removal
GGSWAC Yield
17
264
1.00
0.50
30.56
79.67
10
264
1.00
2.00
81.73
80.48
12
264
4.50
1.25
94.67
75.98
2
264
8.00
0.50
78.68
75.43
7
264
8.00
2.00
93.73
74.33
14
440
1.00
1.25
90.12
78.32
5
440
4.50
0.50
86.81
70.78
9
440
4.50
1.25
80.98
69.89
11
440
4.50
1.25
89.67
65.98
13
440
4.50
1.25
94.34
70.65
15
440
4.50
1.25
88.97
71.23
16
440
4.50
1.25
85.89
70.00
20
440
4.50
1.25
95.68
70.00
18
440
4.50
2.00
95.96
67.37
19
440
8.00
1.25
96.45
65.89
8
616
1.00
0.50
89.89
73.78
1
616
1.00
2.00
99.91
75.30
6
616
4.50
1.25
96.72
66.98
3
616
8.00
0.50
94.78
65.98
4
616
8.00
2.00
99.91
65.31
The ANOVA results of the quadratic model corresponding to BG4 removal and GGSWAC yield are shown in Tables 6 and 7. The model is significant if the F value is large while the P value < 0.05 (Liew et al., 2018; Bello et al., 2011).
Source
Sum of squares
Degree of freedom
Mean square
F-value
P value Prob. >F
Model
3498.33
9
388.70
5.45
0.0070
x1
1040.81
1
1040.81
14.58
0.0034
x2
508.94
1
508.94
7.13
0.0235
x3
822.65
1
822.65
11.52
0.0068
x1 x2
381.29
1
381.29
5.34
0.0434
x1 x3
323.72
1
323.72
4.54
0.0591
x2 x3
210.23
1
210.23
2.95
0.1169
x12
0.08
1
0.08
0.00
0.9737
x22
18.34
1
18.34
0.26
0.6233
x32
55.25
1
55.25
0.77
0.3996
Residual
713.83
10
71.38
Lack of fit
566.64
5
113.33
3.85
0.0827
Pure error
147.19
5
29.44
Cor total
4212.16
19
Source
Sum of squares
Degree of freedom
Mean square
F-value
P value Prob. >F
Model
398.11
9
44.23
12.63
0.0002
x1
148.53
1
148.53
42.42
<0.0001
x2
164.92
1
164.92
47.09
<0.0001
x3
0.81
1
0.81
0.23
0.6405
x1 x2
6.85
1
6.85
1.95
0.1923
x1 x3
0.16
1
0.16
0.05
0.8338
x2 x3
2.10
1
2.10
0.60
0.4565
x12
10.91
1
10.91
3.11
0.1081
x22
18.82
1
18.82
5.38
0.0429
x32
0.47
1
0.47
0.13
0.7216
Residual
35.02
10
3.50
Lack of fit
17.75
5
3.55
1.03
0.4881
Pure error
17.26
5
3.45
Cor total
433.13
19
Additionally, Prob. >F less than 0.05 show that both models were significant. From Table 6, the model terms of X1 (radiation power), X2 (time), X3 (IR), and X1X2 were significant to the response. The lack of fit P value of 0.0827 was not significant, and the regression model was shown to be effective for BG4 adsorption onto GGSWAC. From Table 7, X1, X2, and X22 were significant model terms with lack of fit showing insignificance to the response.
Fig. 1 (a) shows the surface plot for the effects of radiation power and IR on BG4 removal. BG4 removal increased when the radiation power and IR increased as more pores and surface area developed which could be occupied by BG4 molecules. Increasing the radiation power widened the existing pores and formed new pores via a continual carbon–CO2 reaction of the carbon burn off, resulting in an increased BET surface area (Yang and Lua, 2003). In addition, increasing IR improved the BG4 adsorption due to the reduction hydroxide and the potassium metal ion intercalation into the char sample which facilitated the improvement of GGSWAC pore structures. From Fig. 1 (b), it was found that the yield of produced GGSWAC was inversely proportional to the microwave power and irradiation time, and a lower yield was obtained at higher microwave powers and longer irradiation times. This was due to the release of more volatile matter during the activation stage at higher microwave powers and longer irradiation times. The carbonaceous matrix present in the sample absorbed more microwave energy, thus inducing dipole rotation of carbon molecules at the rate of a million times per second (Liew et al., 2018). Thus, the rapid rotation of carbon molecules within the char produced frictional force and released more heat energy within the char itself, which, in turn, improved the pyrolysis cracking of the GGSW and released more volatile matter. As a result, lower GGSWAC yield was obtained due to the release of higher amounts of volatile matter from the sample. This finding is identical with the study conducted by Lam et al. (2017) and Ahmad et al. (2017) who also synthesized AC using microwave irradiation techniques.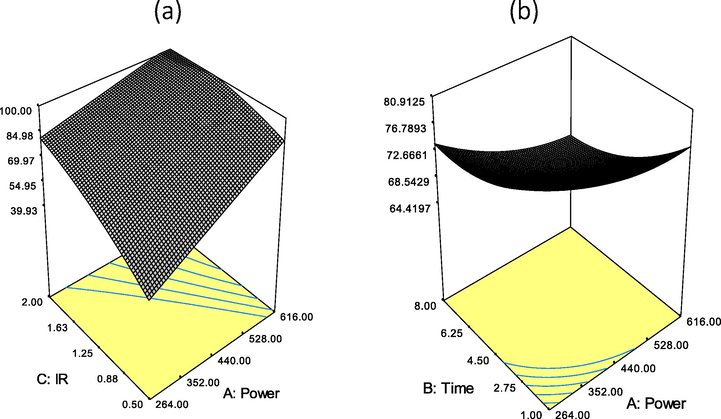
Effects of (a) IR and power on BG4 removal and (b) effects of power and time on GGSWAC yield.
The optimal conditions for GGSWAC synthesis are summarized in Table 8. It was found that the optimal conditions for GGSWAC were achieved at high radiation power and IR with minimum activation time and exhibited the highest BG4 removal compared to other studies using different types of AC.
Type of AC
Power (Watt)
Time (min)
IR
Yield (%)
BG4 removal (%)
Reference
GGSWAC
616
1
1.93
75.28
99.91
This study
Banana peel
700
5–15
1.00
21.29
80
(Liew et al., 2018)
Ricinus communis
100
4
0.30
69.68
55.6–88.24
(Makeswari and Santhi, 2013)
Orange peel
550
5
1.00
87.00
57
(Lam et al., 2017)
3.2 N2 adsorption isotherms and physical properties
The N2 adsorption–desorption isotherms for GGSW and GGSWAC are illustrated in Fig. 2 (a). GGSW exhibited a Type II isotherm, while GGSWAC illustrated a combination of Type I and II sorption isotherms (Yang and Hong, 2018; Foo and Hameed, 2012) indicating the presence of micropores and mesopores. As observed in Table 9, the GGSW initially possessed a relatively low BET surface area and a TPV of 39.52 m2/g and 0.0279 cm3/g, respectively. After the activation step, the surface area and TPV increased based on pore development and widening of the existing pores. The TPV increase was evidenced by the increase in adsorption at low relative pressures (P/P0 < 0.1), as shown in the N2 adsorption isotherms. The aperture distribution in Fig. 2 (b) showed that the pore size of GGSWAC was concentrated in the range of 1.64–1.91 nm. Similar trends were reported by Pallarés et al. (2018), Jang and Kan (2019), and Haryati et al. (2018), where each studied the characterization of AC and biochar. According to Song et al. (2013); BG4 has a molecular size of 1.21 nm × 1.19 nm × 0.53 nm (L × W × D), which indicated that BG4 molecules can agglomerate on the surface of GGSWAC with an APD of 2.1620 nm.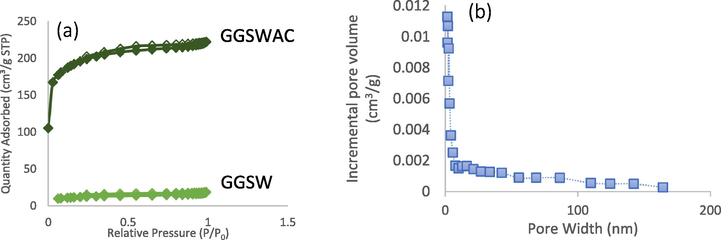
(a) N2 adsorption-desorption isotherms of GGSW and GGSWAC (b) PSD of GGSWAC.
SBET (m2/g)
TPV (cm3/g)
Vmicro (cm3/g)
APD (nm)
%Vmicro
Smicro/SBET
GGSW
39.52
0.028
0.006
2.82
21.53
27.31
GGSWAC
633.30
0.342
0.194
2.16
56.77
61.09
3.3 Sample morphology
The surface morphology details of the samples are provided in SEM micrographs for further comparison of porosity. Fig. 3 (a) illustrates the morphology of GGSW, while Fig. 3 (b) shows the GGSWAC structure. Generally, GGSW exhibits a highly porous structure with open pores in cylindrical-shaped. After the activation step, it was clearly observed that the cylindrical porous structure became wider and new slit-shaped pores formed. Therefore, it was concluded that, the surface of GGSWAC is heterogenous, possessed a combination of micro and mesopores as observed in N2 adsorption–desorption data. Similar structures were reported by Mondal and Majumder (2019), who characterized AC derived from natural resources.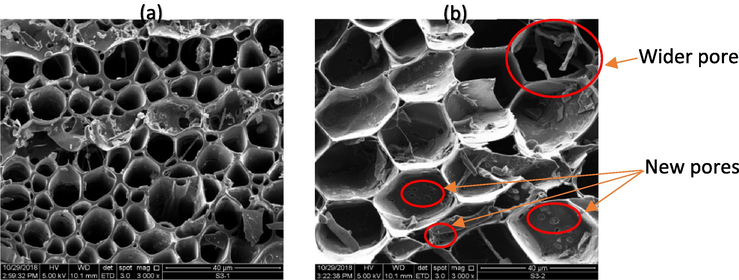
SEM images of (a) GGSW (b) GGSWAC.
3.4 Proximate and elemental analysis
Table 10 summarizes the proximate and ultimate composition of GGSW and GGSWAC. In general, the synthesized GGSWAC closely follows the AC standard in SNI-06-3730-1995 (Pandia et al., 2018). The reduction of volatile matter in GGSWAC indicated the release of volatile matter resulting in the formation of new pores. Moisture content of GGSWAC increased due to water formation at high irradiation power resulting from dehydration reactions of adjacent carboxylic and phenol groups to anhydrides, lactones, and ethers (Bedia et al., 2018). In addition, high IR values increased the amount and volume of pores and surface area, which caused an increase in the hydrophilic performance of AC to absorb water from the air (Pambayun et al., 2013). KOH-CO2 modification reduced the ash, which was confirmed by the largest decrease in ash content from 9.633 to 1.295% after modification. The elemental molar ratios were calculated to estimate the aromaticity (H/C) and hydrophilicity (O/C) of the GGSWAC (Jang and Kan, 2019). In general, H/C and O/C ratios of <0.7 and <0.4, respectively, indicate a good degree of biochar carbonization (Haryati et al., 2018). Based on high H/C ratios, it can be concluded that GGSWAC exhibited a high degree of aromaticity and stability, which is suitable for adsorption applications (Abdulrazzaq et al., 2014).
Proximate analysis (%)
Elemental analysis (%)
H/C
O/C
Volatile matter
Fixed Carbon
Moisture
Ash
C
H
N
O
S
GGSW
13.491
67.243
9.648
9.633
59.87
3.98
0.54
35.16
0.45
0.798
0.440
GGSWAC
10.925
69.289
18.491
1.295
68.3
3.47
0.32
27.71
0.2
0.606
0.305
3.5 Sample functional groups
The FTIR spectra for GGSW and GGSWAC are shown in Fig. 4. Alcohols, phenol and ether groups can be suggested as the main oxygen group present in GGSW. The broad peak at 3495 cm−1 is assigned to OH stretching (Machrouhi et al., 2019) in the phenolic and aliphatic structures of GGSW (Haeldermans et al., 2019). The peaks at 1562–1411 cm−1 indicate the C⚌C stretching vibrations in the aromatic ring (Joseph et al., 2015; Rattanapan et al., 2017), and O—H bending (Djelloul and Hamdaoui, 2015). The 1310–1000 cm−1 region was assigned to C—O stretching in ethers (Korus et al., 2019) which was almost vanished after KOH activation. In conclusion, FTIR results suggested the reduction in functional groups concentration due to the release of volatile matter during activation. Similar findings were reported by Wang et al. (2018) and Yang et al. (2014).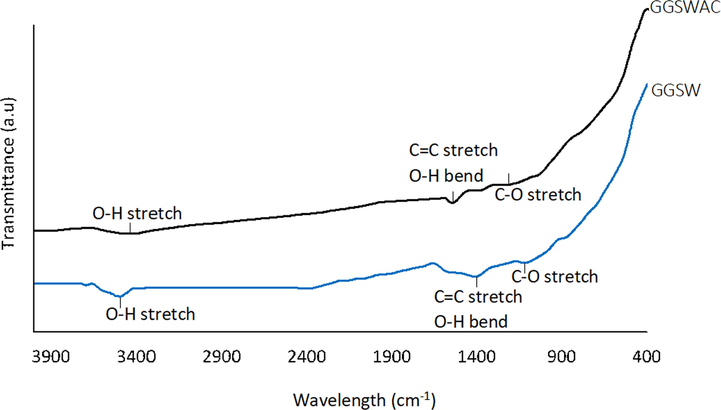
FTIR Spectra of GGSW and GGSWAC.
3.6 Equilibrium study
3.6.1 Effect of initial concentration
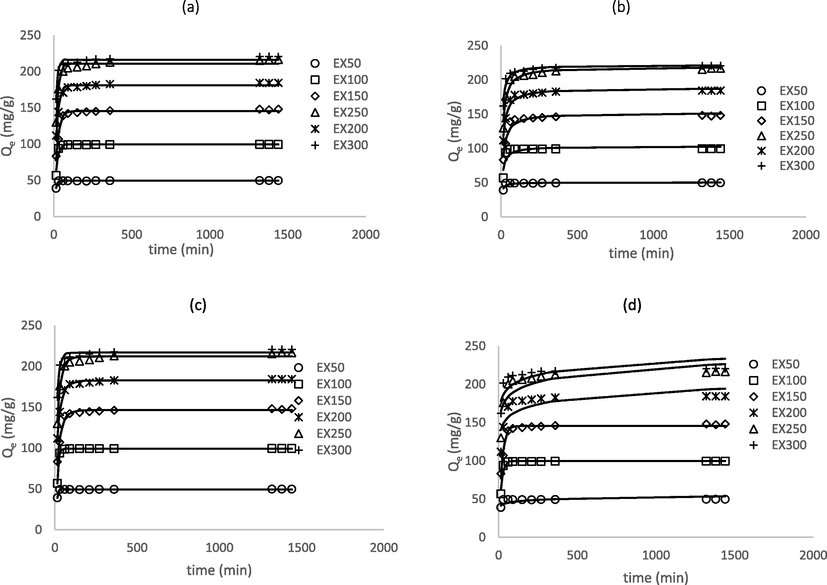
Fig. 5 shows that as the initial BG4 concentration increased from 50 to 300 mg/L, the adsorption uptakes of BG4 molecules increased from 49.62 to 220.58 mg/g. This was due to larger mass transfer driving force at higher initial concentration to overcome the mass transfer resistance of BG4 between the liquid and solid phase. At higher initial concentrations, the number of ions competing for the available sites on the surface of adsorbent is high, thus causing higher dye adsorption capacity (Azari et al., 2020). The trend was consistent with adsorption study reported by Bhatti et al. (2017), Chowdhury et al. (2011) and Sayğılı and Güzel (2018).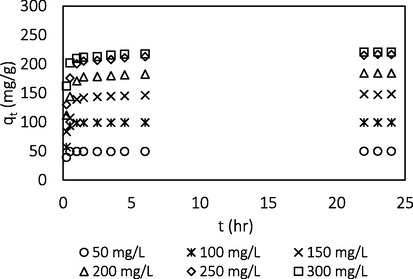
Effect of initial concentration.
3.6.2 Effect of temperature
The influence of temperature on BG4 adsorption is given in Fig. 6. An increasing trend in BG4 dye adsorption capacity was observed as the solution temperature increased from 30 to 60 °C indicating the endothermic nature of the BG4 adsorption reaction. The adsorption capacity increased from 220.58 to 230.47 mg/g when the temperature was raised from 30 to 60 °C. At higher temperature, more BG4 molecules have sufficient energy to undergo an interaction with active sites at the surface of AC. Increasing the temperature resulted in an increase of rate of diffusion of the adsorbate molecules across the external boundary layer and in the internal pores of the adsorbent particle due to the decrease in the viscosity of the solution (Ahmad and Alrozi, 2011). Similar finding was reported by Sayğılı and Güzel (2018), who studied the effect of temperature on BG4 adsorption at temperature between 25 and 55 °C using AC from tomato processing waste.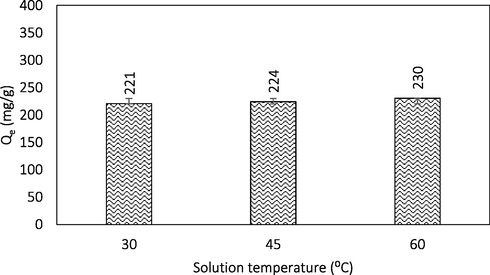
Effect of temperature.
3.6.3 Effect of pH
Fig. 7 indicates the plots of BG4 adsorption capacity against initial solution pH. The equilibrium uptake of BG4 significantly increased with the increase of pH from 2.0 to 4.0. Beyond pH 4.0, there was no significant change in the BG4 adsorption capacity. The reduced uptake of the BG4 below pH 4.0 was due to electrostatic repulsion between positively charged surface of the adsorbent and the positively charged cationic BG4 dye. The pHPZC of optimized GGSWAC for BG4 adsorption was found at pH 6.0. At pH < pHpzc, the adsorbent surface becomes predominantly positively charged and tend to repel the cationic dye since the number of the negatively charged groups at the surface of the adsorbent decreased, while the positively charged groups increased. Hence the adsorption of the dye molecules to the surface of the adsorbent reduced as pH was decreased from 4 to 2 due to electrostatic repulsion. The adsorption of BG4 was favorable above pH 4, which might be due to H-bonding and when pH > pHPZC, which can be attributed by electrostatic interaction between negatively charged AC surface and positively charged BG4. Similar trend was reported by Murthy et al. (2019) and Sharma et al. (2019).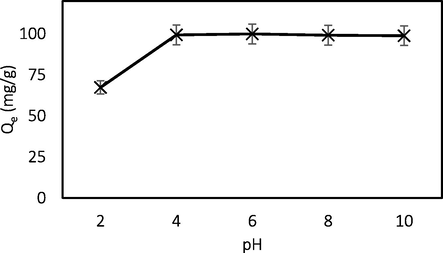
Effect of pH.
3.6.4 Fitting of isotherm models
The isotherm models such as Sips, Redlich-Peterson, Dubinin–Radushkevish, Toth and Koble Corrigan were used to analyze the heterogeneity of the system. The determined error function values and isotherm parameters obtained from nonlinear regression for all temperatures are shown in Table 11. Among the 10 applied equations, the Fritz–Schlünder and n-BET isotherms could be identified as the most suitable models for modelling the equilibrium sorption behaviour of GGSWAC covering the entire concentration range. Fritz–Schlünder model shows excellent agreement to the experimental data, with the highest values of R2 and the lowest values of
and RMSE at all studied temperatures. Similar finding was reported by Aljeboree et al. (2017) who also discovered that the Fritz–Schlünder as the best model for maxilon blue and direct yellow dyes adsorption onto coconut shell. The equilibrium adsorption capacity predicted by the Fritz–Schlünder model was 225.71 mg/g, which is higher than Qu et al. (91.24 mg/g) (Qu et al., 2019) and Rangabhashiyam & Balasubramanian (62.50 mg/g) (Rangabhashiyam and Balasubramanian, 2018) and slightly higher than Jiang et al. (212.7 mg/g) (Jiang et al., 2017); who also studied BG4 adsorption but used different types of adsorbents. The n-BET model was the second-best fit for the isotherm studies. The n-BET isotherm assumes that there are numbers of layer, n that can be adsorbed onto the internal surface of AC. The adsorption is limited by n layers when the adsorption space is finite due to finite size of pores. In this study, n is lower than 2, indicating a monolayer adsorption.
Model
Parameter
Temperature (°C)
30
45
60
Freundlich
106
110.5
116.9
5.394
5.424
5.505
0.8745
0.8601
0.8448
26.6653
29.6945
34.1912
RMSE
26.9628
29.2563
31.8500
Langmuir
(L/mg)
1.098
1.132
1.307
(mg/g)
215
221
227.6
0.9650
0.9731
0.971
6.9366
5.9393
7.1927
RMSE
14.2490
12.8348
13.7766
Dubinin–Radushkevish (D-R)
(mg/g)
201.7
206.9
214.4
(kJ/mol)
0.5207
0.4885
0.4357
0.9337
0.9455
0.9606
8.5221
7.1768
5.4661
RMSE
19.5992
18.3295
16.0513
Temkin
(J/mol)
0.08496
0.08592
0.08792
(L/mg)
33.81
34.08
40.01
0.93
0.926
0.9147
15.9109
17.3434
20.2392
RMSE
20.1357
21.5187
23.6181
Redlich–Peterson (R-P)
(L/g)
275
278.3
321.3
(L/mg)
1.468
1.389
1.517
0.9619
0.9722
0.9788
0.9697
0.9758
0.9727
7.0921
6.1697
7.5014
RMSE
13.2554
12.1754
13.3702
Sips
(mg/g)
214.2
219.4
222.2
(L/mg) nS
1.116
1.171
1.535
1.025
1.053
1.208
0.965
0.9733
0.9729
6.7940
5.5639
5.4186
RMSE
14.2456
12.7785
13.3131
Koble–Corrigan (K-C)
(L/g)
233.1
258.5
338.1
1.047
1.144
1.52
1
1.068
1.196
0.9578
0.9675
0.9729
7.5493
6.0424
5.4866
RMSE
15.5903
14.0764
13.3114
Fritz–Schlünder (F-S)
(L/g)
140.6
150.6
162.1
(L/mg)
0.08414
0.1343
0.1212
0.1082
0.09836
0.08855
−3.002
−2.435
−2.36
0.9924
0.9926
0.9943
0.8523
0.9080
0.7789
RMSE
6.6148
6.7385
6.0836
n-layer BET
(mg/g)
197.3
205.8
215.4
(L/mg)
0.003204
0.005007
0.0038
(L/mg)
1.311
1.305
1.4560
1.585
1.336
1.327
0.9728
0.9774
0.9742
6.5208
5.8509
7.2190
RMSE
12.5419
11.7540
12.9993
Toth
(mg/g)
220.9
225.7
221.6
(L/mg)
1.189
1.199
1.23
0.916
0.9371
1.088
0.9652
0.9731
0.9712
7.2212
6.2141
6.7482
RMSE
14.1946
12.8364
13.7291
The Redlich-Peterson isotherm consists of three parameters and incorporates the features of the Langmuir and the Freundlich isotherms. The mechanism of adsorption is hybrid and does not follow ideal monolayer adsorption. This model can be applied either in homogeneous or heterogeneous systems. The exponent, values were close to unity, which reduce to Langmuir model equation, revealing the homogeneous system. The three important parameters for Sips model were maximum adsorption capacity, qs, equilibrium constant, Ks and the heterogeneity constant, ns. The constant ns referred to the heterogeneity factor, which could stem from the adsorbent, adsorbate or the combination of both. The system is heterogenous when this value deviates from 1, while the value close to 1 describes a homogeneous system. The values of ns for GGSWAC were slightly greater than 1 for BG4 adsorption at all studied temperature, indicating the homogeneity of the systems, which was supported by Langmuir model. Moreover, the maximum monolayer adsorption capacity predicted by Sips was close to that predicted by Langmuir equation. This was further proven by the values of and provided by Toth and Koble Corrogan models which were close to unity, suggesting homogeneous distribution of adsorption sites. Therefore, it was concluded the adsorption of BG4 occurs at specific homogeneous sites of the GGSWAC, possibly on the mesoporous surface.
The low sorption energy, E (<8 kJ/mol), provided from Dubinin–Radushkevich indicated physisorption. Similar findings were reported by Azizi et al. (2019) and Lee and Choi (2018). In addition, the values of the Temkin parameter bT, which is related to the heat of adsorption, were low, suggesting a physical adsorption process. The relatively high value of the regression coefficient R2 obtained for the Redlich-Peterson, Toth, and Sips models confirmed their applicability for describing experimental data. The following show the ranking of the isotherm models in descending order (best to poorest fitting), with respect to the R2 value: Fritz–Schlünder > nth layer BET > Redlich–Peterson > Toth > Sips > Langmuir > Koble Corrigan > Dubinin– Radushkevich > Temkin > Freundlich; with respect to the value: Fritz–Schlünder > nth layer BET > Sips > Langmuir > Redlich–Peterson > Toth > Koble Corrigan > Dubinin–Radushkevich > Temkin > Freundlich; and with respect to the RMSE value: Fritz–Schlünder > nth layer BET > Redlich–Peterson > Toth > Sips > Langmuir > Koble Corrigan > Dubinin–Radushkevich > Temkin > Freundlich.
3.7 Kinetic study
Tables 12 and 13 summarize the kinetic parameter values and the error functions of the PFO, PSO, Elovich. and Avrami models. The results clearly showed that the adsorption of BG4 dye onto GGSWAC followed the Avrami model, which recorded the highest values of R2 and the lowest values of
, RMSE, SSE, and %ARE. Besides, the calculated equilibrium adsorption capacity (Qe.cal, = 49.3, 99.1, 146.4, 182.6, 212.0, and 216.7 mg/g) agreed well with the experimental equilibrium adsorption capacity (Qe,exp, = 49.6, 99.4, 148.1, 184.3, 216.6, and 220.6 mg/g). The fractionary values of nAV of the Avrami model could be related to the adsorption kinetic orders. It was observed that most of nAV values were close to unity indicating a kinetic order of 1. This was supported by the results from PFO model fitting, whereby the BG4 adsorption also can be seen to fit well with PFO model indicating the possibility of physisorption. The PSO and Elovich models give poor fitting with lower values of R2 and higher values of
, RMSE, SSE, and %ARE, demonstrating that these models were not appropriate to describe the behaviour of BG4 adsorption. Similar findings have been reported by Qu et al. (2019) who also studied the adsorption of BG4 dyes onto AC. Fig. 8 illustrates the fitting of these models using the experimental data at various initial BG4 concentrations (see Table 14).
Model
Parameter
Initial Concentration (mg/L)
50
100
150
200
250
300
PFO
49.45
0.107599.66
0.06597145.60
0.05024181.10
0.05832210.80
0.06152216.20
0.09133
PSO
50.25
0.006377102.9
0.001307151.9
0.0006027188.2
0.0005855219.1
0.0005293221.7
0.000967
ELOVICH
122.9
0.380878.66
0.18131.664
0.0930911.51
0.0847218.68
0.07426195.2
0.08255
AVRAMI
49.33
99.09
146.40
182.60
212.00
216.70
0.085
0.061
0.052
0.062
0.064
0.100
1.849
1.778
0.820
0.741
0.796
0.824
Error function
Model
Initial concentration (mg/L)
50
100
150
200
250
300
PFO
PSO0.9608
0.75020.9393
0.77380.9764
0.94830.9734
0.96970.9726
0.96380.9541
0.9395
Avrami
0.9944
0.9995
0.9867
0.9946
0.9814
0.9580
Elovich
−0.1397
0.3817
0.6297
0.6461
0.659
0.5178
PFO
0.0824
1.2935
1.0237
0.9537
0.8984
0.6077
PSO
0.5481
4.6423
1.8226
1.0048
1.4290
0.9234
Avrami
0.0112
0.0077
0.4747
0.1557
0.6078
0.5605
Elovich
2.3857
11.7644
13.3609
11.8198
12.7033
6.8132
RMSE
PFO
0.6543
3.306
3.396
3.917
4.504
3.816
PSO
1.652
6.38
5.031
4.184
5.174
4.38
Avrami
0.248
0.290
2.553
1.765
3.715
3.648
Elovich
3.528
10.55
13.46
14.29
15.89
12.36
SSE
PFO
3.854
98.366
103.821
138.109
182.591
131.037
PSO
24.558
366.367
227.832
157.541
240.914
172.635
Avrami
0.5518
0.7581
58.6440
28.0224
124.1941
119.7791
Elovich
112.019
1001.510
1631.419
1837.126
2271.902
1375.174
%ARE
PFO
0.2271
1.0762
0.8214
0.6649
0.3824
0.1831
PSO
0.8031
2.3006
0.7636
0.5914
0.7982
0.5053
Avrami
0.0369
0.0201
0.3558
0.0961
0.2710
0.2025
Elovich
1.1228
4.4166
3.3861
2.8586
2.8937
1.3463
Fitting of experimental data to the (a) PFO (b) PSO (c) Avrami, and (d) Elovich models.
Temperature (K)
ΔG (kJ/mol)
ΔH (kJ/mol)
ΔS (J/K.mol)
303.15
−35.312
2.883
125.841
318.15
−37.047
333.15
−39.097
3.8 Thermodynamics
ΔG values were all negative, indicating that the adsorption of BG4 by GGSWAC was thermodynamically spontaneous. The absolute values of ΔG slightly increased as the temperatures of the adsorption conditions increased, indicating that the adsorption process was thermodynamically favorable at higher temperatures. The ΔH value was 2.883 kJ mol−1 revealing an endothermic reaction. The positive value of ΔS indicated that the reversibility of adsorption was poor and suggested a random adsorption process at the GGSWAC / BG4 interface (Bello, 2011). Similar findings have been reported by Qu et al. (2019) and Gautam et al. (2018).
3.9 Adsorption mechanism
The plausible mechanism of BG4 adsorption is indicated in Fig. 9:
-
the electrostatic attractions between the negatively charged GGSWAC surface (when pH > pHPZC) and the positively charged BG4 cations;
-
hydrogen bonding between hydroxyl groups (H-bond donors) of the GGSWAC and H-bond acceptor in BG4; as well as hydrogen bonding between hydroxyl group of GGSWAC and carbonyl group (H-bond acceptor) of the BG4. BG4 possessed 4H-bond donors and 14H-bond acceptors which enhanced the adsorption process.
-
π-π interaction between aromatic groups in GGSWAC surface and BG4 molecules were also contributed to the adsorption process.
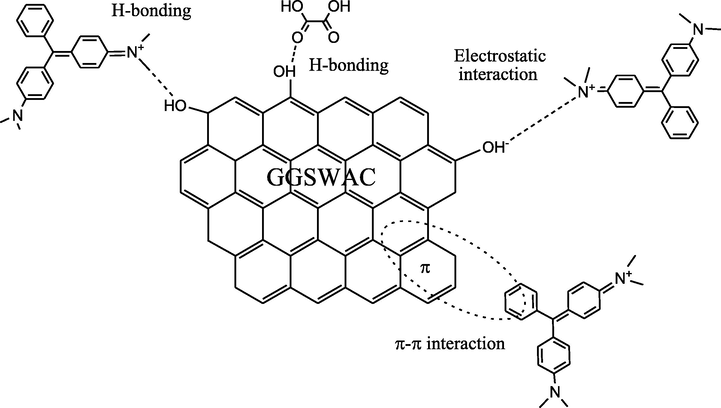
- Adsorption mechanism of BG4 onto GGSWAC.
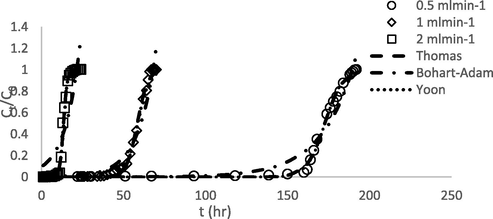
3.10 Dynamic modelling of breakthrough curves
Table 15 indicates fixed bed column parameters for BG4 adsorption by GGSWAC at 30 °C. It was found that an increase in the flow rate resulted in a decrease in the breakthrough time (tb), exhaustion time (te), and the maximum adsorption capacity of the column (qc). This decrease was attributed to the short residence time of the BG4 solution in the column, which did not allow the propagation of the solute in the pores of the GGSWAC. A similar trend was observed by Khadhri et al. (2019), who studied the adsorption of indigo carmine onto AC derived using date palm petiole. The Thomas, Yoon–Nelson, and Bohart–Adam models were applied to adapt the experimental data of the continuous adsorption of BG4 onto GGSWAC, and the fitting results are shown in Table 16 and Fig. 10. The Thomas and Yoon–Nelson models better describe the breakthrough curves than the Bohart–Adam model based on high regression coefficients (R2). The validity of the Thomas model was confirmed by the close agreement between the experimental and calculated values of the bed capacity. Meanwhile, the validity of the Yoon–Nelson was confirmed by the close values of the time required for 50% BG4 breakthrough (τ) between the experimental and calculated data.
Flow rate (mL/min)
0.5
160.7
188.0
171.90
457.91
1.0
45.0
65.5
59.00
306.49
2.0
11.1
17.0
13.00
134.79
Flow rate (mL/min)
Thomas model
Yoon–Nelson model
Bohart–Adam model
0.5
1.821
466.0
0.9965
0.1876
172.8
0.9964
4.937
1.846
0.9566
1.0
3.126
314.7
0.9950
0.2870
58.58
0.9995
9.364
1.324
0.9596
2.0
8.872
144.6
0.9959
0.8774
13.54
0.9994
10.940
0.837
0.7783
Experimental and predicted breakthrough curves for BG4 adsorption onto GGSWAC at flow rates of 0.5–2 mL/min.
3.11 Application of GGSWAC as a dye adsorbent
3.11.1 Comparison with other adsorbents
The values of the BG4 adsorption capacities were compared in Table 17. Many researchers have examined efficiency of various low-cost adsorbents for the removal of BG4 dye. Comparisons of different adsorbents found in the literature were done based on maximum adsorption capacity. It was concluded that GGSWAC can be considered as a valuable alternative for the removal BG4 from aqueous solution due to its high adsorption capacity.
Adsorbent
BG4 adsorption capacity (mg/g)
Ref
Coconut AC
91.24
(Qu et al., 2019)
Rice-bran
147.47
(Bhatti et al., 2017)
Rice husk
24.92
(Chowdhury et al., 2011)
Seed hull
8.40
(Mohammad et al., 2018)
Oyster mushroom
32.33
(Chen et al., 2014)
Copperpod fruit shell
62.5
(Rangabhashiyam and Balasubramanian, 2018)
Wood apple
80.65
(Sartape et al., 2017)
GGSWAC
230.47
This study
3.11.2 Economic evaluation
To study the feasibility of GGSWAC for commercialization, the production costs were calculated based on the cost incurred by feedstock transportation, chemicals (KOH and HCl), CO2 gas, and the electricity used. Table 18 shows the estimated production cost of GGSWAC by KOH microwave activation. The production cost was estimated to be approximately 0.54 USD/kg of GGSWAC, which was significantly lower than the market price of AC (up to 5.76 USD/kg of AC), as shown in Table 19. This indicates that KOH microwave activation of GGSW is economically feasible for commercialization.
Component
Estimated cost (USD/kg)
Transportation cost
0.5
Chemicals (KOH & HCl)
KOH = 0.01 USD, HCl = 0.01 USD (Selvaraju and Bakar, 2017)0.03
CO2 gas, 15 USD/25 kg
1 standard refill of CO2 gas in Malaysia = 25 kg
Total consumption = 1.5 L0.002
Electrical consumption (activation process)
(0.616 kW × 1 min)
* Charges rate of electricity in Malaysia (1 kWh) = 0.05 USD (Liew et al., 2018)0.005
Total estimated production cost
0.537
Feedstock
Production cost (USD/kg)
Reference
GGSWAC
0.54
This study
Artocarpus integer
0.18–0.20
(Selvaraju and Bakar, 2017)
Orange peel
1.67
(Lam et al., 2017)
Banana peel
0.9
(Liew et al., 2018)
Charcoal
Wood
Pet coke1.72–3.84
1.54
5.76(Stavropoulos and Zabaniotou, 2009)
4 Conclusion
The prepared GGSWAC at a radiation power, time, and IR of 616 W, 1 min, and 1.93, respectively, possessed excellent characteristics for use as a dye adsorbent due to high SBET (633.30 m2/g) and TPV (0.34 cm3/g), as well as high BG4 removal capability (99.91%) and AC yield (75.28%). The Fritz–Schlünder isotherm and Avrami kinetic models were the best models to describe the behavior of BG4 adsorption onto GGSWAC in batch operations, while the Thomas and Yoon–Nelson were the best models to predict BG4 adsorption in fixed-bed columns. The estimated production costs were very low compared to commercial AC indicating its commercial feasibility.
Acknowledgments
The authors thankfully acknowledge the support obtained from the Ministry of Higher Education (MOHE), Universiti Sains Malaysia (Research University Grant: Number 8014061 and Bridging Grant: Number: 6316195), Universiti Malaysia Perlis (UniMAP) and National Hydraulic Research Institute of Malaysia (NAHRIM) in the form of scholarships and facilities.
Declaration of Competing Interest
The authors declare that they have no known competing financial interests or personal relationships that could have appeared to influence the work reported in this paper.
References
- Characterization and Stabilisation of Biochars Obtained from Empty Fruit Bunch, Wood, and Rice Husk. BioResources. 2014;9(2):2888-2898.
- [Google Scholar]
- Optimization of process variables by response surface methodology for malachite green dye removal using lime peel activated carbon. Appl. Water Sci.. 2017;7(2):717-727.
- [Google Scholar]
- Removal of malachite green dye from aqueous solution using rambutan peel-based activated carbon: Equilibrium, kinetic and thermodynamic studies. Chem. Eng. J.. 2011;171(2):510-516.
- [Google Scholar]
- Kinetics and equilibrium study for the adsorption of textile dyes on coconut shell activated carbon. Arab. J. Chem.. 2017;10:S3381-S3393.
- [Google Scholar]
- Kinetics of phase change. I General theory. J. Chem. Phys.. Dec. 1939;7(12):1103-1112.
- [Google Scholar]
- Modelling and interpretation of adsorption isotherms. J. Chem.. 2017;2017(September):1-11.
- [Google Scholar]
- Comprehensive systematic review and meta-analysis of dyes adsorption by carbon-based adsorbent materials: Classification and analysis of last decade studies. Chemosphere. 2020;250(5):126238
- [Google Scholar]
- Polymerization of graphene oxide with polystyrene: Non-linear isotherms and kinetics studies of anionic dyes. Microchem. J.. 2018, 2019,;145(November):559-565.
- [Google Scholar]
- A review on synthesis and characterization of biomass-derived carbons for adsorption of emerging contaminants from water. J. Carbon Res.. 2018;4(September)
- [Google Scholar]
- Response surface modeling and optimization of remazol brilliant blue reactive dye removal using periwinkle shell-based activated carbon response surface modeling and optimization of remazol brilliant blue reactive dye removal using periwinkle shell-based. Sep. Sci. Technol.. 2011;46(15):2367-2379.
- [Google Scholar]
- Bello, O.S., 2011. Adsorptive removal of a synthetic textile dye using cocoa pod husks. Toxicol. Environ. Chem., February 2014.
- Characterization of char from biomass gasification and its similarities with activated carbon in adsorption applications. Appl. Energy. 2017;227:92-99.
- [Google Scholar]
- Adsorptive behavior of rice bran-based composites for malachite green dye: Isotherm, kinetic and thermodynamic studies. J. Mol. Liq.. 2017;237:322-333.
- [Google Scholar]
- Some aspects of the behavior of charcoal with respect to chlorine. J. Am. Chem. Soc.. Mar. 1920;42(3):523-544.
- [Google Scholar]
- Biosorption of malachite green from aqueous solutions by Pleurotus ostreatus using Taguchi method. J. Environ. Heal. Sci. Eng.. 2014;12(1):1-10.
- [Google Scholar]
- Adsorption thermodynamics, kinetics and isosteric heat of adsorption of malachite green onto chemically modified rice husk. Desalination. 2011;265(1–3):159-168.
- [Google Scholar]
- Calcium-rich biochar from crab shell: An unexpected super adsorbent for dye removal. Bioresour. Technol.. 2018;267(July):510-516.
- [Google Scholar]
- Characteristics and adsorption capacities of low-cost sorbents for wastewater treatment: A review. Sustain. Mater. Technol.. 2016;9:10-40.
- [Google Scholar]
- Dynamic adsorption of methylene blue by melon peel in fixed-bed columns. Desalin. Water Treat.. 2015;56(11):2966-2975.
- [Google Scholar]
- What is the correct form of BET isotherm for modeling liquid phase adsorption? Adsorption. 2009;15(1):65-73.
- [Google Scholar]
- Porous structure and adsorptive properties of pineapple peel based activated carbons prepared via microwave assisted KOH and K2CO3 activation. Micropor. Mesopor. Mater.. 2012;148(1):191-195.
- [Google Scholar]
- Simultaneous adsorption equilibria of organic solutes in dilute aqueous solutions on activated carbon. Chem. Eng. Sci.. 1974;29(5):1279-1282.
- [Google Scholar]
- A new hemicellulose-based adsorbent for malachite green. J. Environ. Chem. Eng.. 2018;6(4):3889-3897.
- [Google Scholar]
- Microwave-assisted modification of activated carbon with ammonia for efficient pyrene adsorption. J. Ind. Eng. Chem.. 2016;39:27-36.
- [Google Scholar]
- New thermodynamically consistent competitive adsorption isotherm in RPLC. J. Colloid Interface Sci.. 2003;264(1):43-59.
- [Google Scholar]
- Microwave assisted and conventional pyrolysis of MDF – Characterization of the produced biochars. J. Anal. Appl. Pyrolysis. 2019;138(November 2018):218-230.
- [Google Scholar]
- Pilot scale biochar production from palm kernel shell (PKS) in a fixed bed allothermal reactor. J. Oil Palm Res. 2018
- [Google Scholar]
- IMARC Group, 2017. Biomass Gasification Market: Global Industry Trends, Share, Size, Growth, Opportunity and Forecast 2018-2023.
- Efficient removal of Acid Green 25 dye from wastewater using activated Prunus Dulcis as biosorbent: Batch and column studies. J. Environ. Manage.. 2018;210:226-238.
- [Google Scholar]
- A novel hay-derived biochar for removal of tetracyclines in water. Bioresour. Technol.. 2019;274(October 2018):162-172.
- [Google Scholar]
- Effective phosphorus removal using chitosan/Ca-organically modified montmorillonite beads in batch and fixed-bed column studies. J. Hazard. Mater.. 2019;375(April):9-18.
- [Google Scholar]
- Adsorption and desorption of cationic malachite green dye on cellulose nanofibril aerogels. Carbohydr. Polym.. 2017;173:286-294.
- [Google Scholar]
- Removal of malachite green from aqueous solution by waste tyre derived activated carbon. Malaysian J. Chem.. 2015;17(2):16-28.
- [Google Scholar]
- Production of porous activated carbons from Caesalpinia ferrea seed pod wastes: Highly efficient removal of captopril from aqueous solutions. J. Clean. Prod.. 2018;197:919-929.
- [Google Scholar]
- Batch and continuous column adsorption of indigo carmine onto activated carbon derived from date palm petiole. J. Environ Chem. Eng.. 2019;7(1):102775
- [Google Scholar]
- Adsorption isotherms for pure hydrocarbons. Ind. Eng. Chem.. Feb. 1952;44(2):383-387.
- [Google Scholar]
- Physicochemical properties of biochars prepared from raw and acetone-extracted pine wood. Fuel Process. Technol.. 2019;185(November 2018):106-116.
- [Google Scholar]
- About the theory of so-called adsorption of soluble substances. Sven. Vetenskapsakad. Handingarl. 1898;24:1-39.
- [Google Scholar]
- Microwave-assisted pyrolysis with chemical activation, an innovative method to convert orange peel into activated carbon with improved properties as dye adsorbent. J. Clean. Prod.. 2017;162:1376-1387.
- [Google Scholar]
- Activated carbon for catalyst support from microwave pyrolysis of orange peel. Waste Biomass Valorization. 2017;8(6):2109-2119.
- [Google Scholar]
- The adsorption of gases on plane surfaces of glass, mica and platinum. J. Am. Chem. Soc.. 1918;40(9):1361-1403.
- [Google Scholar]
- Persimmon leaf bio-waste for adsorptive removal of heavy metals from aqueous solution. J. Environ. Manage.. 2018;209:382-392.
- [Google Scholar]
- Microwave pyrolysis with KOH/NaOH mixture activation: A new approach to produce micro-mesoporous activated carbon for textile dye adsorption. Bioresour. Technol.. 2018;266(April):1-10.
- [Google Scholar]
- A critical review of the estimation of the thermodynamic parameters on adsorption equilibria. Wrong use of equilibrium constant in the Van’t Hoof equation for calculation of thermodynamic parameters of adsorption. J. Mol. Liq.. 2019;273:425-434.
- [Google Scholar]
- Is the free energy change of adsorption correctly calculated? J. Chem. Eng. Data. 2009;54(7):1981-1985.
- [Google Scholar]
- Removal of diclofenac using microbiochar fixed-bed column bioreactor. J. Environ. Chem. Eng.. 2019;7(1):102894
- [Google Scholar]
- Statistical optimization of activated carbon from Thapsia transtagana stems and dyes removal efficiency using central composite design. J. Sci. Adv. Mater. Devices. 2019;4(4):544-553.
- [Google Scholar]
- Removal of malachite green dye from aqueous solutions onto microwave assisted zinc chloride chemical activated epicarp of Ricinus communis. J. Water Resour. Prot.. 2013;5(2):222-238.
- [Google Scholar]
- Comparison of activated carbon and physic seed hull for the removal of malachite green dye from aqueous solution. Water. Air. Soil Pollut.. 2018;229(2)
- [Google Scholar]
- Honeycomb-like porous activated carbon for efficient copper (II) adsorption synthesized from natural source: Kinetic study and equilibrium isotherm analysis. J. Environ. Chem. Eng.. 2019;7(4):103236
- [Google Scholar]
- Studies on batch adsorptive removal of malachite green from synthetic wastewater using acid treated coffee husk: Equilibrium, kinetics and thermodynamic studies. Microchem. J.. 2019;146(January):192-201.
- [Google Scholar]
- Production and characterization of activated carbon from barley straw by physical activation with carbon dioxide and steam. Biomass Bioenergy. 2018;115(January):64-73.
- [Google Scholar]
- Pembuatan Karbon Aktif dari Arang Tempurung Kelapa dengan Aktivator ZnCl2 dan Na2CO3 sebagai Adsorbent untuk Mengurangi Kadar Fenol dalam Air Limbah. J. Tek. Pomits. 2013;2(1):F116-F120.
- [Google Scholar]
- Utilization of cocoa peel as biosorbent for oil and color removal in palm oil mill effluent (POME) IOP Conf. Ser.: Mater. Sci. Eng.. 2018;300(1)
- [Google Scholar]
- Brilliant green dye sorption onto snail shell-rice husk: statistical and error function models as parametric isotherm predictors. J. Environ. Sci. Technol.. 2019;12(2):65-80.
- [Google Scholar]
- Effect of properties of activated carbon on malachite green adsorption. Fuel. 2019;249(October 2018):45-53.
- [Google Scholar]
- Bioresource Technology Reports Performance of novel biosorbents prepared using native and NaOH treated Peltophorum pterocarpum fruit shells for the removal of malachite green. Bioresour. Technol. Reports. 2018;3(May):75-81.
- [Google Scholar]
- Adsorption of methyl orange on coffee grounds activated carbon. Energy Procedia. 2017;138:949-954.
- [Google Scholar]
- S. M. R. C. P. Ltd, 2018. Activated Carbon - Global Market Outlook (2017-2026).
- Insight Into Adsorption Thermodynamics. Thermodynamics Tech; 2011. p. :349-364.
- Hybrid synthesis of novel material through acid modification followed ultrasonication to improve adsorption capacity for zinc removal. J. Clean. Prod.. 2018;172:92-105.
- [Google Scholar]
- Removal of malachite green dye from aqueous solution with adsorption technique using Limonia acidissima (wood apple) shell as low cost adsorbent. Arab. J. Chem.. 2017;10:S3229-S3238.
- [Google Scholar]
- Usability of activated carbon with well-developed mesoporous structure for the decontamination of malachite green from aquatic environments: kinetic, equilibrium and regeneration studies. J. Porous Mater.. 2018;25(2):477-488.
- [Google Scholar]
- Monolayer-multilayer adsorption phenomenological model: Kinetics, equilibrium and thermodynamics. Chem. Eng. J.. 2016;284:1328-1341.
- [Google Scholar]
- Production of a new industrially viable green-activated carbon from Artocarpus integer fruit processing waste and evaluation of its chemical, morphological and adsorption properties. J. Clean. Prod.. 2017;141:989-999.
- [Google Scholar]
- Quantitative analysis of malachite green and leucomalachite green residues in fish purchased from the markets in Malaysia. Food Control. 2018;92:101-106.
- [Google Scholar]
- Honeycomb structured activated carbon synthesized from Pinus roxburghii cone as effective bioadsorbent for toxic malachite green dye. J. Water Process Eng.. 2019;32(August):100931.
- [Google Scholar]
- High capacity adsorption of malachite green in a mesoporous tyre-derived activated carbon. Asia-Pac. J. Chem. Eng. 2013;8:172-177.
- [Google Scholar]
- Minimizing activated carbons production cost. Fuel Process. Technol.. 2009;90(7–8):952-957.
- [Google Scholar]
- State equation of the solid-gas interface layers. Acta Chim. Hung.. 1971;69:311-328.
- [Google Scholar]
- U.S. Department Of Health And Human Services, 2008. The toxicology and carcinogenesis - studies of malachite green chloride and leucomalachite green in F344 / N rats and B6C3F 1 mice.
- Textile wastewater treatment by agro-industrial waste: Equilibrium modelling, thermodynamics and mass transfer mechanisms of cationic dyes adsorption onto low-cost lignocellulosic adsorbent. J. Taiwan Inst. Chem. Eng.. 2019;96:439-452.
- [Google Scholar]
- Pb (II) sorption by biochar derived from Cinnamomum camphora and its improvement with ultrasound-assisted alkali activation. Colloids Surfaces A. 2018;556(June):177-184.
- [Google Scholar]
- Dye and its removal from aqueous solution by adsorption: A review. Adv. Colloid Interface Sci.. 2014;209:172-184.
- [Google Scholar]
- Biochar from Alternanthera philoxeroides could remove Pb (II) efficiently. Bioresour. Technol.. 2014;171:227-232.
- [Google Scholar]
- Adsorption behavior of modified Glossogyne tenuifolia leaves as a potential biosorbent for the removal of dyes. J. Mol. Liq.. 2018;252:289-295.
- [Google Scholar]
- Characteristics of activated carbons prepared from pistachio-nut shells by physical activation. J. Colloid Interface Sci.. 2003;267:408-417.
- [Google Scholar]
- Application of gas adsorption kinetics I. A theoretical model for respirator cartridge service life. Am. Ind. Hyg. Assoc. J.. Aug. 1984;45(8):509-516.
- [Google Scholar]


