

Translate this page into:
Adsorption of diazinon and fenitrothion on nanocrystalline magnesium oxides
⁎Corresponding author. Tel.: +98 21 29903109; fax: +98 21 22431663. m-pouramini@sbu.ac.ir (Mostsfa M. Amini)
-
Received: ,
Accepted: ,
This article was originally published by Elsevier and was migrated to Scientific Scholar after the change of Publisher.
Peer review under responsibility of King Saud University.

Abstract
Nanocrystalline magnesium oxide was prepared by the sol–gel method from magnesium methoxide and characterized by Fourier transform infrared spectroscopy, thermal analysis, X-ray powder diffraction and transmission electron microscopy. Sol–gel derived nanocrystalline magnesium oxide along with a commercial nanocrystalline magnesium oxide was used as adsorbents to study the adsorption of two common, organophosphorous pesticides, diethoxy-[(2-isopropyl-6-methyl-4-pyrimidinyl)oxy]-thioxophosphorane (diazinon) and dimethoxy-(3-methyl-4-nitrophenoxy)-thioxophosphorane (fenitrothion). Adsorption of diazinon and fenitrothion on the sol–gel derived, and commercial nanocrystalline magnesium oxides was studied using UV–vis, FT-IR and 31P NMR spectroscopies. The effect of hydroxyl groups on edge/corner and flat panel of magnesium oxide in adsorption of diazinon and fenitrothion was investigated. The results showed that the adsorption of diazinon on the sol–gel derived nanocrystalline magnesium oxide is destructive whereas on commercial one is non-destructive. Commercial nanocrystalline magnesium oxide showed higher activity in the adsorption of fenitrothion than the sol–gel derived, and adsorptions on both nanocrystalline magnesium oxides are destructive.
Keywords
Nanocrystalline
Magnesium oxide
Adsorption
Diazinon
Fenitrothion

1 Introduction
The ultrafine nanocrystalline metal oxide powders have captured attention of scientists due to their potential applications in catalysis (Velmurugan et al., 2012), adsorption (Anupam et al., 2011), biomedical science, nanodevices, sensors and dye-sensitized solar cell (Al-Owais, 2013; Jeevanandam, 2009). The fascinating behavior of nanomaterials in comparison to bulk materials have been correlated mainly to the high surface area, large number of defects, morphology in addition to pore structure and hydroxyl groups on the surface of oxides (Korotcenkov, 2008; Oh et al., 2007). Although the curial role of surface hydroxyl groups on behavior of nanooxides has been raised by several authors and investigated to some extent, it seems additional work is required for clarification and deeper understanding of their role in adsorption (Martin et al., 2005). Furthermore, it is well-known that the surface of nanooxides powders can be endowed with hydroxyl groups by the low temperature processing technique (Bailly et al., 2005). In this context, low temperature and soft chemical methods of metal oxides’ processing, such as the sol–gel have been subject of extensive studies (Jeevanandam, 2009).
Among many metal nano-oxides, magnesium oxide with strong basic properties is unique and has a wide range of applications, including refractory industry, support for metal catalysts, a base catalyst in organic reaction, adsorbent for toxic compound, electronic device and optic (Niederberger and Garnweitner, 2006). Interestingly, for each application a specific processing method which fulfills the properties of magnesium oxide is required. For catalytic and adsorptive applications, nanocrystalline MgO should be prepared with especial crystal morphologies. Such a magnesium oxide possesses multitude surface sites with enhanced surface chemical reactivity, such as crystal corners, edges, or ion vacancies and defects. Residual surface hydroxides can also raise the rich surface chemistry exhibited by nanocrystalline MgO (NC-MgO), and in recent years became the most important influential parameter in the chemistry of ultrafine nanocrystalline MgO powders (Utamapanya et al., 1991; Itoh et al., 1993). The surface chemistry is generally attributable to Lewis acid, Lewis base and Brönsted acid sites of varying coordination, that is, metal cations, oxide anions, and surface-bound OH groups. Nanocrystalline MgO can be especially effective as an adsorbent. This ultrafine powder, in particular, has shown a unique destructive chemisorption capability toward toxic chemical agents (polar organic chemicals). The adsorptive properties of nanocrystalline MgO are diverse and studies have been reported on adsorption of pyridine, phosphorus compounds, sulfur trioxide, and others (Narske et al., 2002; Carnes et al., 2002; Wagner et al., 1999; Stark et al., 1996; Koper et al., 1997). It has shown mechanistically that the heterogeneous reaction of nanocrystalline MgO with pesticide occurs by hydrolysis reactions. The resulting hydrolysis products containing the heteroatom would bind strongly to active sites on nanocrystalline MgO (Lin and Klabunde, 1985; Mishakov et al., 2005; Stoimenov et al., 2003). The surface composition of nanocrystalline MgO has been widely studied because of its effective role in the adsorptive process. There has been some discussion on the type of surface sites on nanocrystalline MgO (Kim et al., 2002; Chizallet et al., 2006). However, data mostly concerning fundamental textural characterization of the surface and the interface are very scantly and mainly limited to the surface data (Kim et al., 2002; Chizallet et al., 2006). Therefore, a study of the relationship between acidic and basic surface sites, coordinatively unsaturated Mg+2 ions and stretching vibrational frequencies of the hydroxide groups in crystalline structure of nanocrystalline MgO will be interesting and beneficial. Furthermore, classification of OH types on the surface of nanocrystalline MgO can facilitate the interpretation of adsorptive reaction mechanism in general and destructive adsorption of organophosphorus pesticides in particular (Klabunde et al., 1996; Utamapanya et al., 1991; Itoh et al., 1993; Chizallet et al., 2007).
The aim of this study is to investigate the influence of the sol–gel derived nanocrystalline magnesium oxide on adsorption of diazinon and fenitrothion. In this context, nanocrystalline magnesium oxide was prepared from magnesium methoxide, and after characterization used as a sorbent to adsorb aforementioned pesticides and the result was compared with commercial magnesium oxide.
2 Experimental
2.1 Regents and materials
All chemicals were obtained from the Merck Chemical Company (Darmstadt, Germany) with highest available purity. The commercial nanocrystalline MgO (NanoActive®MgO, CM-MgO) was purchased from the NanoScale Company (www.NanoScaleCorp.com, US) and calcined at 500 °C prior to use. Methanol was dried and distilled over magnesium turning before use.
2.2 Physical measurements
Fourier transform infrared (FT-IR) spectra (4000–400 cm−1) were recorded on a 4600 FT-IR spectrometer (Shimadzu, Japan). The samples were pressed to a thin disk with KBr before measurements. UV–vis spectra in the range of 200–800 nm were recorded on a Shimadzu 2100 spectrophotometer at room temperature. The 31P NMR spectra were recorded at room temperature in hexane on a Bruker AVANCE 300-MHz instrument (Bruker, Germany) operating at 121.44 MHz. X-ray powder diffraction analysis (XRD) was performed with Cu-Kα radiation on a Philips-PW 17C X-ray diffractometer (Philips, Netherlands). The diffractogram was recorded in 2θ 5–80° at a rate of 3°/min. The specific surface area of the NC-MgO was determined from the nitrogen adsorption at −196 °C using the Brunauer-Emmett-Teller (BET) technique with an ASAP 2000 apparatus (Micromeritics, US). Prior to adsorption calculations, the sample weight was corrected for any weight loss due to degassing or drying. Thermal analysis was carried out on a STA-503 instrument (BAHR, Germany) under ambient conditions. Particle size was estimated from a transmission electron microscopy (TEM) image. TEM image was obtained using a CM-200 FEG instrument (Philips, Netherlands).
2.3 Preparation of nanocrystalline MgO (NC-MgO)
The sol–gel derived nanocrystalline MgO (NC-Mg) was prepared from magnesium methoxide according to the earlier report with slight modification (Heidari et al., 2009). Magnesium methoxide, the precursor for the preparation of the sol–gel derived nanocrystalline MgO, was synthesized by direct reaction of magnesium ribbon and dry methanol in the presence of a small amount of iodine at refluxing temperature. After consumption of magnesium, magnesium methoxide solution in methanol was filtered to remove unreacted magnesium. The synthesis of magnesium methoxide and filtration process were carried out in an inert atmosphere to prevent hydrolysis of magnesium methoxide and formation of undesired MgO. Magnesium methoxide was crystallized from filtrated solution at −20 °C. The well crystallized magnesium methoxide was collected by filtration in an inert atmosphere using a frit-filter and then dried under reduced pressure to obtain white magnesium methoxide powder. The prepared magnesium methoxide was exposed to air with 25% of humidity at 23 °C for 24 h and then the resulted gel was calcined at 500 °C for 3 h. The prepared nanocrystalline MgO was stored in the vacuum desiccator for further use. Prepared material was characterized by FT-IR, XRD, TGA-DTA, TEM and BET surface area analyzer.
2.4 Adsorption study
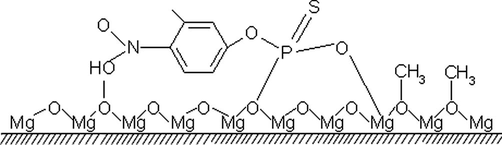
Adsorption of two common pesticides, diazinon and fenitrothion, on two different types of nanocrystalline MgO was investigated. The molecular structures of two pesticides are shown in Scheme 1. All adsorption studies were carried out in a 50 mL round-bottom flask at room temperature, and a temperature-controlled water bath was used to keep the temperature constant. In a typical adsorption study, 0.10 or 0.05 g of adsorbent was suspended in 20 mL hexane with initial diazinon concentration of 0.30 g/L (0.001 M) or fenitrothion concentration of 0.28 g/L (0.001 M). The mixture was stirred at a mixing rate of 250 rpm for various time intervals, then the solution was centrifuged and the pesticide concentration was determined by a UV–vis spectrophotometer. Diazinon and fenitrothion characteristic absorption peaks appear at 246 and 264 nm, respectively. Concentrations of diazinon and fenitrothion in solution after 5, 15, 30, 45, 60 min and 24 h stirring with adsorbents were determined by measuring their concentrations in solution before and after adsorption. Three measurements were carried out for each sample, and the results were averaged. After 24 h solid residue was filtered and dried at room temperature and studied by infrared spectroscopy. Furthermore, adsorbed diazinon on magnesium oxides was extracted with acetone and analyzed by 31P NMR.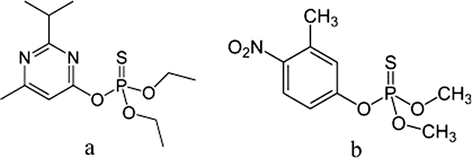
Chemical structure of diazinon (a), and fenitrothion (b).
3 Results and discussion
3.1 Characterization of sol–gel derived nanocrystalline MgO (NC-MgO)
Fig. 1 shows X-ray diffraction pattern of magnesium oxide prepared from magnesium methoxide. This pattern is similar to the X-ray diffraction pattern of commercial nanocrystalline magnesium oxide (Nanoactive® MgO, CM-MgO) and was a pure periclase phase (space group Fm3m, JCPDS No. 45-0946). Formation of periclase magnesium oxide as the sole crystalline phase at 400 °C is consistent with an earlier report (Zhang et al., 1989). An average crystallite size of 8 nm for the NC-MgO is estimated by means of the Debye–Scherrer equation (Culltiy, 1978) based on the full width at half-maximum of diffraction peak at 2θ = 42.9° with d value of 2.11 Å, corresponding to (2 0 0) plane. The particle size of the NC-MgO was also calculated from the specific surface area according to the dp = 6 × 10³/Sρ formula, where dp is the size of particle (nm), S is the specific surface area (m2/g), and ρ is the density of MgO (3.58 g/cm3) (Reed, 1988). The particles size calculated from BET data is compared with the particles obtained from TEM and XRD data listed in Table 1. The crystallite size of MgO estimated from the X-ray diffraction pattern is in good agreement with the particle size obtained from TEM image (Fig. 2a). The HRTEM image in Fig. 2b shows crystalline lattice planes and the d220 interplanar distance of 0.148 nm corresponds to the periclase magnesium oxide phase (JCPDS No. 45-0946). Notably, the TEM micrograph shows that the morphology and particle size of the sol–gel derived MgO to a good extent is similar to CM-MgO.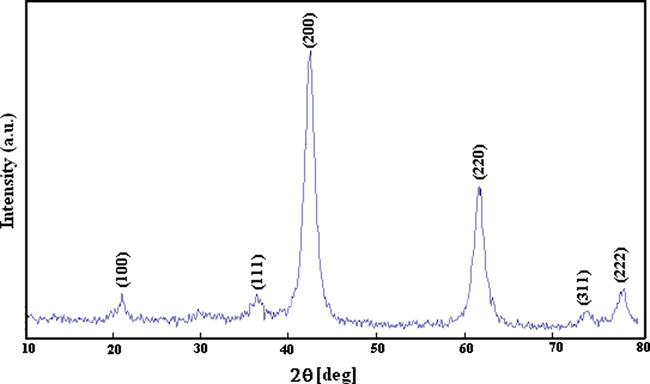
X-ray diffraction pattern of the sol–gel derived nanocrystalline MgO (NC-MgO).
Entry
Surface area m2/g
Particle size (nm, BET)
Crystallite size (nm, XRD)
Particle size (nm, TEM)
NC-MgO
250
7
8a
6
NanoActive, CM-MgO
600b
–
4b
–
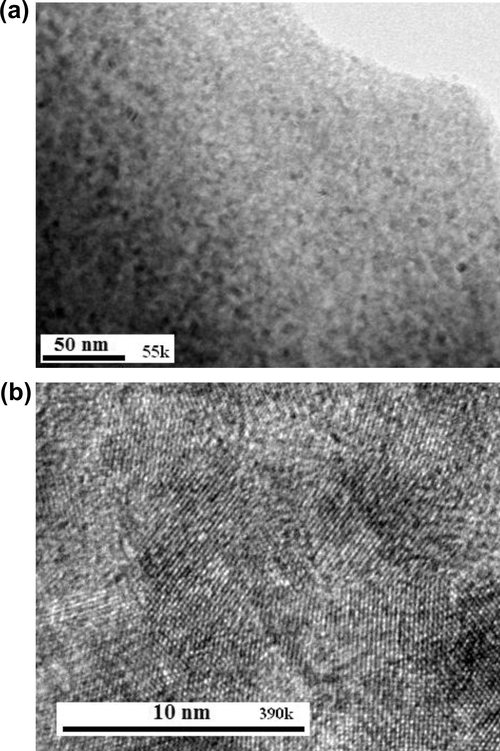
TEM (a) and HRTM (b) micrographs of the sol–gel derived nanocrystalline MgO (NC-MgO).
The nitrogen adsorption method was used to determine BET surface are of the MgO. The adsorption isotherm of NC-MgO is illustrated in Fig. 3 and textural parameters of it along with textural parameters of the CM-MgO are listed in Table 1. As can be seen, NC-MgO shows type II isotherm, and has surface area of 250 m2/g and pore volume of 0.36 ml/g. Thermal analysis (TGA-DTA) was used to investigate the behavior of the gel obtained from hydrolysis of magnesium methoxide (Fig. 4). The TGA curve shows that 20% weight loss occurs upon heating to 300 °C. The DTA curve shows a broad endothermic peak in the same temperature range, suggesting that the weight loss is primarily due to the elimination of physically adsorbed water and possibly chemically bound water. At higher temperature, two strong exothermic peaks at 400 and 440 °C were observed, which were accompanied by 30% weight loss in the TGA curve. This weight loss is primarily associated with combustion of carbonaceous material that is due to the incomplete hydrolysis of magnesium methoxide.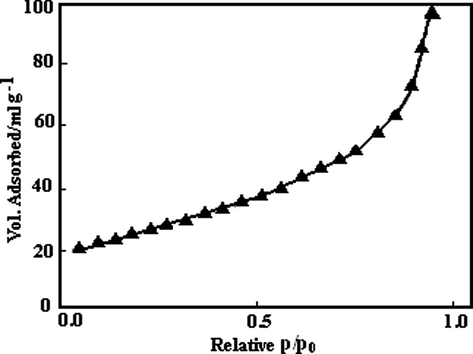
The nitrogen adsorption isotherm of NC-MgO.
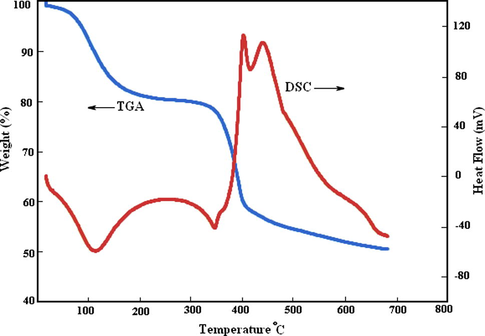
TGA-DTA of gel prepared from hydrolysis of (CH3O)2Mg.
In the present study, infrared spectroscopy was used to characterize the type of hydroxyl groups on the surface of NC-MgO and CM-MgO samples. The type of hydroxyl groups on nanoalkaline earth oxides can have diverse topological environments and has been the subject of interest in the surface chemistry studies of oxides (Klabunde et al., 1996). The hydroxyl groups that form from dissociation of water on the surface of MgO are different and have a distinct stretching vibration peak in the IR spectrum. The concave area, convex area and corners in the surface of nanocrystalline MgO in addition to vacancies, defect, hydrogen bonding and coordination status of magnesium are the most influential parameters in the stretching frequencies of OH groups (Klabunde et al., 1996; Chizallet et al., 2007). The classification of OH groups on nanocrystalline MgO can help to interpret how destructive adsorptions of organophosphorous pesticides occur on nanocrystalline MgO. The IR spectra of NC-MgO and CM-MgO (Fig. 5) show a υO–H at 3755 cm−1 for both MgO nanoparticles in addition to a broad band at slightly lower energy (3460 cm−1). These bands are generally attributed to strongly hydrogen bound OH species (Klabunde et al., 1996; Utamapanya et al., 1991; Itoh et al., 1993; Chizallet et al., 2007). The sharp and more intense band at 3750 cm−1 for CM-MgO (Fig. 4a) in comparison with that of NC-MgO (Fig. 5b) is associated with the higher concentration of the OH groups on edges and corners sites (Klabunde et al., 1996; Chizallet et al., 2007). This appears contrary to NC-MgO OH groups which are situated on flat planes in closer proximity to each other (Chizallet et al., 2007). This can be easily explained if one considers the difference in topological environments of MgO nanoparticles (Koper et al., 1997). Interestingly, it has been reported that OH groups which are mainly situated on edge/corner sites of the MgO are less acidic than OH on the flat planes, since the O−2 would be of lower coordination and have more basic character (Klabunde et al., 1996; Utamapanya et al., 1991; Itoh et al., 1993; Chizallet et al., 2007). Therefore, difference in topological environments for OH groups on the surface of various MgO nanoparticles should be considered in the adsorption process.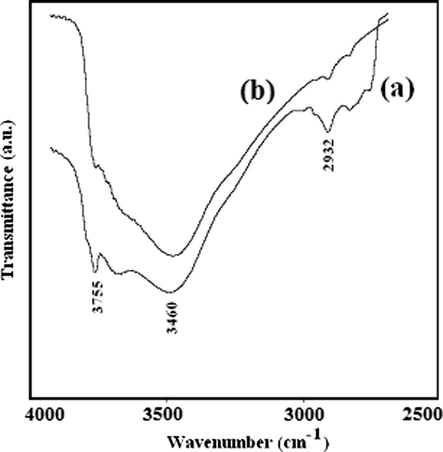
IR spectrum of (a) CM-MgO, and (b) NC-MgO in 4000–2500 cm−1 region after heat treatment at 500 °C.
3.2 Adsorption of diazinon on magnesium oxides
In order to elucidate the role of OH groups of nanocrystalline magnesium oxide in adsorption of diazinon and fenitrothion, two ultrafine magnesium oxide nanoparticles, NC-MgO and CM-MgO, were used to investigate their ability in adsorption of diazinon and fenitrothion.
Fig. 6 shows the UV–vis absorption spectrum of a diazinon solution at a concentration of 0.32 mg/ml (0.001 M) before (a) and after stirring (b) with NC-MgO, and its inset shows the adsorption as a function of time. The UV–vis spectrum of the diazinon solution after stirring with the NC-MgO, except for the intensity of peaks was similar prior to stirring, which revealed that the diazinon remained intact in solution. This was confirmed by the 31P NMR spectra by showing same chemical for diazinon solution before and after stirring with the nanocrystalline magnesium oxides (Fig. 7). A similar UV–vis spectrum was observed for the CM-MgO. Furthermore, NC-MgO did not release diazinon after stirring with fresh hexane and clearly demonstrates that the phenomenon is a chemical adsorption. In quantitative term, 0.1 g of NC-MgO and CM-MgO adsorbed about 37% and 21% of the diazinon in less than five min, respectively. Interestingly, despite the fact that NC-MgO has lower surface area (250 m2/g) than CM-MgO (600 m2/g), its capacity for adsorption of diazinon on NC-MgO significantly is higher for NC-MgO. It seems adsorption of diazinon on NC-MgO, to some extent, is different than that on CM-MgO. The amount of diazinons that adsorbed on NC-MgO and CM-MgO was about 20 mg/g and 12 mg/g, respectively. This indicates that in spite of lower surface area than the former, a larger number of diazinon molecules covered on its surface.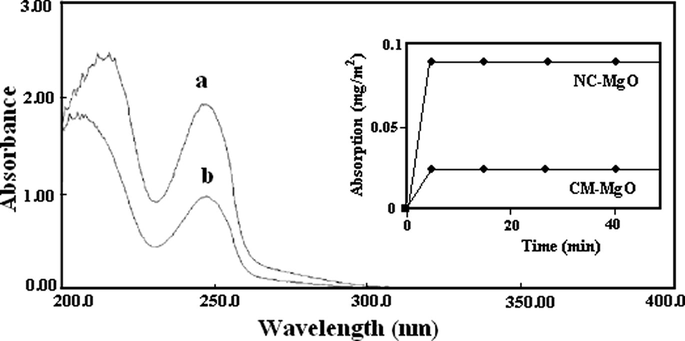
UV–vis spectrum of a diazinon solution (a) before and (b) after contact with NC-MgO (inset shows the adsorption of diazinon as a function of time).
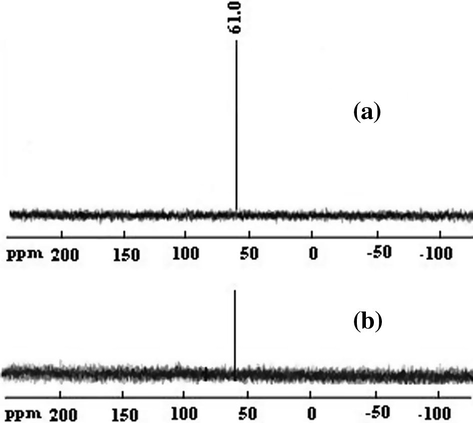
31P NMR specrtrum of pure diazinon (a), and after stirring the solution (b) with nanocrystalline MgO.
The difference in the activity of CM-MgO and NC-MgO in adsorption of diazinon can be attributed to the different in topological environment of OH groups on their surface (Mishakov et al., 2005). As mentioned earlier OH groups on the CM-MgO surface are concentrated mostly on the edges and corner sites and expected to be more basic than OH groups situated on flat planes of the NC-MgO (Klabunde et al., 1996; Utamapanya et al., 1991). In other hands, it is well known that diazinon is quite stable in basic media; therefore, the initial higher activity of the NC-MgO probably associated with the enhanced Brönsted acidity character of OH groups on flat planes.
The FT-IR spectra of pure diazinon and diazinon adsorbed on NC-MgO and CM-MgO are shown in Fig. 8a–c, respectively, and selected bands in the spectra are tentatively assigned in Table 2. Examination of these spectra showed a considerable change in band positions of diazinon after adsorption on NC-MgO. It was found that the band at 1024 cm−1 which corresponds to stretching vibration of P–O–CH3 broadens, and its intensity decreased significantly. This shows dissociation of ethoxy groups from diazinon while, new peaks appear at 1231 and 796 cm−1. The band at 1231 cm−1 in the IR spectrum of NC-MgO after adsorption of diazinon was assigned to the bridge POO on the surface of NC-MgO (Li et al., 1991). Furthermore, this peak indicates a significant involvement and interaction of diazinon and NC-MgO. New band at 796 cm−1, might be attributed to the interaction of Lewis acid site (Mg+2) of NC-MgO and pyrimidine molecule as a good Lewis base. The band corresponding to P = S stretching vibration of diazinon at 651 cm−1 overlapped with NC-MgO broad band at 532 cm−1 and did not disclose further information. Appearance of new bands, collapse of some of the diazinon bands and deformation of the bond at about 1024 cm−1 support destruction adsorption of the diazinon on NC-MgO (Rao, 1963). A proposed mechanism for adsorption of diazinon on MgO is illustrated in Scheme 2.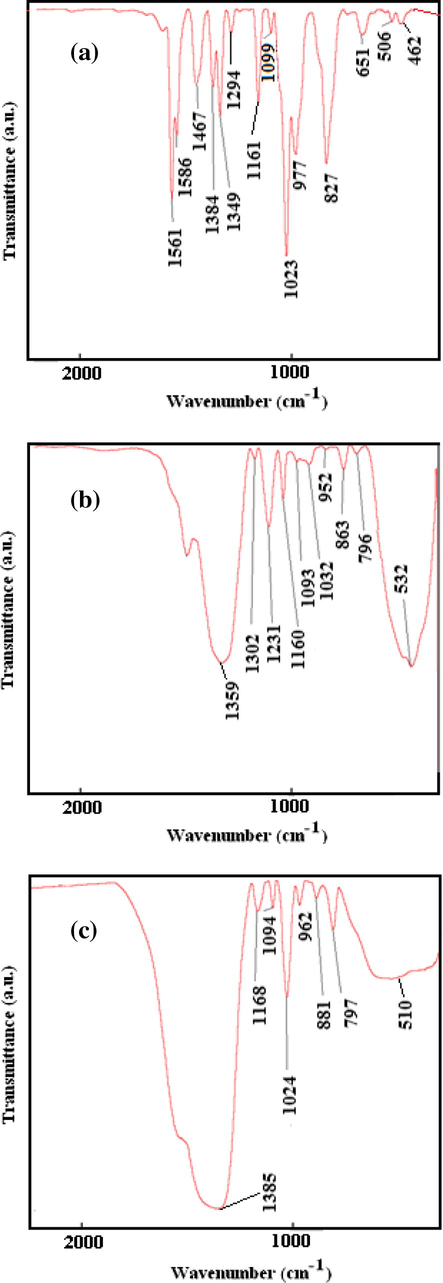
Infrared spectra of (a) diazinon, (b) after adsorption on NC-MgO, and (c) after adsorption on CM-MgO.
Free diazinon
NC-MgO/diazinon
CM-MgO/diazinon
Assignment
651
532
535
P = S
–
796
797
N–Mg
1023
1032
1024
P–O–C
1161
1160
1164
CH3 (Rock)
–
1231
–
POO

Proposed mechanism for adsorption of diazinon on MgO.
Comparison of the IR spectra of adsorbed diazinon on NC-MgO and CM-MgO shows interesting difference between them (Fig. 8b and c). It was found that diazinon band at 1024 cm−1 did not change upon adsorption on CM-MgO in contrast to that of NC-MgO. Therefore, it can be concluded that adsorption of diazinon on CM-MgO is non-destructive. Perhaps the very small size, polyhedral shape and predominance edge/corner sites are engaged in the non-destructive adsorption (Klabunde et al., 1996).
The mechanistic difference between adsorption of NC-MgO and CM-MgO was investigated by recording 31P NMR spectrum of residues extracted from adsorbents by acetone. The 31P NMR spectra (Fig. 9) of the residues extracted from NC-MgO and CM-MgO showed single peaks at 21 and 60 ppm, respectively. The 39 ppm downfield shift in respect to fresh diazinon (61 ppm) for the residue extracted from NC-MgO unambiguously showed that diazinon decomposed completely and buried in NC-MgO in contract to diazinon adsorbed on CM-MgO. These results are in accordance with data obtained from the IR study regarding destructive adsorption of diazinon on NC-MgO and non-destructive adsorption on CM-MgO.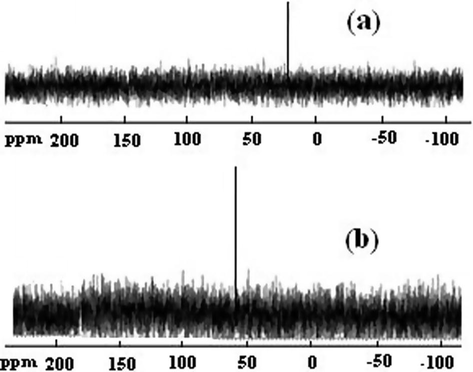
31P NMR specrtra of diazinon residue extracted from NC-MgO (a), and CM-MgO (b) after adsorption.
3.3 Adsorption of fenitrothion on magnesium oxides
The adsorption of fenitrothion on NC-MgO and CM-MgO was also investigated. Fig. 10 shows the UV–vis absorption spectrum of a fenitrothion solution at a concentration of 0.28 mg/ml (0.001 M) before (a) and after contact (b) with the NC-MgO, and its inset shows adsorption of fenitrothion as a function of time. In contrast to the higher rate of adsorption of diazinon on NC-MgO than CM-MgO, the rate of adsorption of fenitrothion on NC-MgO and CM-MgO was similar. In quantitative term, 0.05 g NC-MgO and CM-MgO adsorbed about 27% and 47% of fenitrothion in less than five min, respectively. The amount of fenitrothion adsorbed on NC-MgO and CM-MgO was about 0.22 and 0.15 mg/m2, respectively. Interestingly, both magnesium oxides rapidly turned from white to yellow color, which indicates destructive adsorption of fenitrothion. Since the attempt for the extraction of fenitrothion from adsorbents by hexane and acetone was not successful, it can be concluded that adsorption of fenitrothion on nanocrystalline magnesium oxides is destructive. The distinct difference in behavior of two magnesium oxides in adsorption of fenitrothion can also be attributed to their topology (Chizallet et al., 2007). Considering the stability of fenitrothion in acidic media and higher concentration of basic OH groups on the edge/corner sites of CM-MgO such a behavior is reasonable (Klabunde et al., 1996; Utamapanya et al., 1991; Itoh et al., 1993; Chizallet et al., 2007).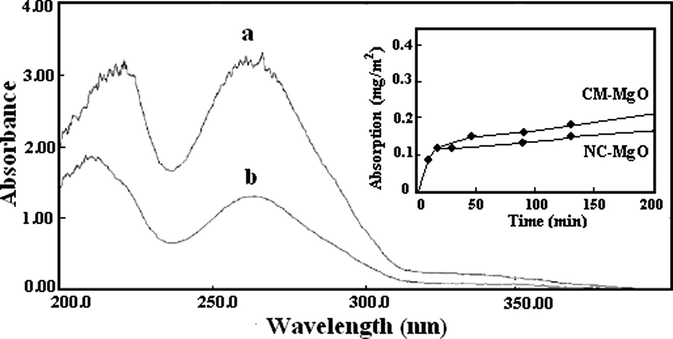
UV–vis spectra of a fenitrothion solution (a) before and (b) after contact with NC-MgO (inset shows the adsorption of diazinon as a function of time).
Fig. 11a, shows IR spectrum of a fresh fenitrothion and Fig. 11b and c show that of after adsorption on NC-MgO and CM-MgO, respectively. Adsorptions of fenitrothion on both magnesium oxides showed significant changes on IR spectrum of fenitrothion. The distinct sharp and strong band at 1035 cm−1 which attributed to the stretching vibration of P–OCH3, broadens and its intensity dropped but did not disappear upon adsorption (Rajagopalan et al., 2002). This indicates that some of the species containing the P–O–CH3 group remains after adsorption of fenitrothion. Furthermore, the asymmetric stretching vibration band due to the NO2 moiety is shifted from 1346 to 1313 cm−1. This shift can be attributed to the adsorption of NO2 on unsaturated Mg+2 sites. The stretching vibrations of the P = S group, which can provide further insight to the mechanism of adsorption, were obscured by MgO lattice vibrations and could not be detected in the spectrum. The band at 1242 cm−1 was assigned to the P–O–CAromatic bond and did not change upon the adsorption process. Comparison of the IR spectrum of NC-MgO and CM-MgO after adsorption of fenitrothion shows no significant differences and confirmed that adsorptions on both magnesium oxides are destructive. A proposed mechanism for adsorption of fenitrothion on MgO is illustrated in Scheme 3.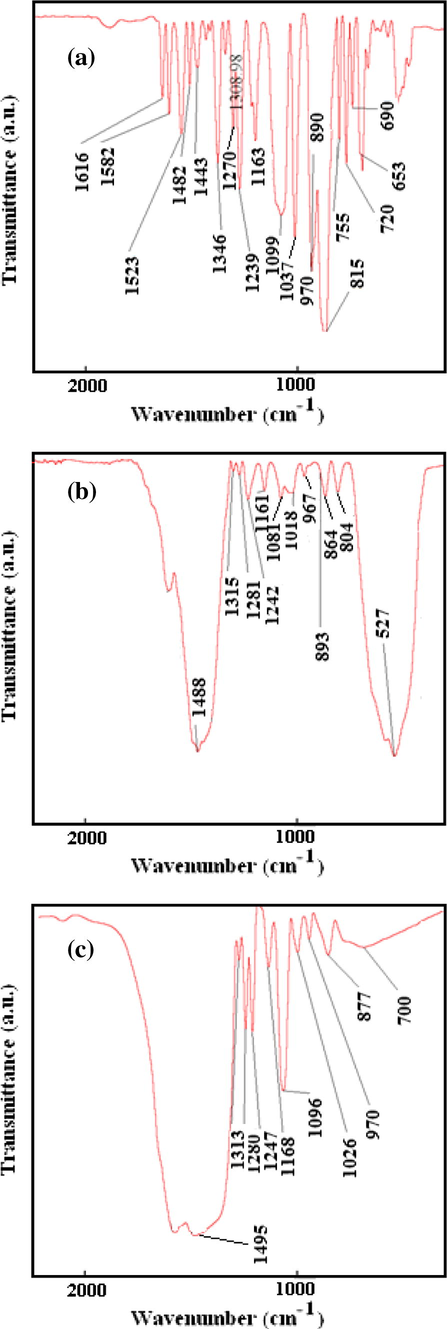
Infrared spectra of (a) fenitrothion, (b) after adsorption on NC-MgO, and (c) after adsorption on CM-MgO.
Proposed mechanism for adsorption of fenitrothion on MgO.
Finally, it is interesting to compare the adsorption of diazinon and fenitrothion on the surface of NC-MgO and CM-MgO. Since extraction of fenitrothion residue was not possible after adsorption, one can conclude that adsorptions of fenitrothion on both magnesium oxides are destructive. In contrast, adsorptions of diazinon on NC-MgO and CM-MgO, according to the FTIR and 31P NMR spectra, are destructive and non-destructive, respectively. The distinct difference in adsorption of diazinon and fenitrothion on the surface of magnesium oxides can be attributed to the higher concentration of more basic edge and corner type hydroxide groups on the surface of CM-MgO and higher stability of diazinon to a basic media.
4 Conclusion
Nanocrystalline magnesium oxide was prepared by the sol–gel method from magnesium methoxide and after characterization by XRD, TGA-DTA, TEM, BET surface area and FT-IR was used as a sorbent to investigate the adsorption of diazinon and fenitrothion. This study showed that hydroxyl groups on the surface of various nanocrystalline magnesium oxides are diverse and can be accumulated on edge/corner sites or flat panel of nanoparticle. These hydroxyl groups that are situated on edge/corner sites or flat panel of magnesium oxides with different acidic or basic character along with defects can have effects on their adsorptive activity. Furthermore, 31P NMR and FT-IR showed that the adsorption of fenitrothion on both NC-MgO and CM-MgO is destructive, where adsorption of diazinon on NC-MgO only is destructive. The distinct behavior of two nanocrystalline magnesium oxides was correlated to the edge and corner type hydroxide groups on the surface.
Acknowledgments
The authors thank Vice-President’s office for Research Affairs of Shahid Beheshti University for supporting this work and Ms. Tan Hui Ru of the Institute of Materials Research and Engineering (IMRE, Singapore) for the HRTEM analysis.
References
- Arab. J. Chem.. 2013;6:229-234.
- Can. J. Chem. Eng.. 2011;89:1274-1280.
- J. Phys. Chem. B. 2005;109:2404-2413.
- Chem. Mater.. 2002;14:2922-2929.
- J. Phys. Chem. B. 2006;110:15878-15886.
- J. Am. Chem. Soc.. 2007;129:6442-6452.
- Element of X-ray Powder Diffraction. New York, N.Y.: Wiley; 1978.
- Catal. Lett.. 2009;130:266-270.
- Chem. Mater.. 1993;5:71-77.
- Jeevanandam, P. 2009. In: Klabunde, K.L., Richards, R.M. (Eds.), Nanoscale Materials in Chemistry, 2nd Edition, John Wiley, New York.
- J. Phys. Chem. B. 2002;106:1515-1517.
- J. Phys. Chem.. 1996;100:12142-12153.
- Chem. Mater.. 1997;9:2468-2480.
- Mater. Sci. Eng.. 2008;61:1-39.
- Langmuir. 1991;7:1394-1399.
- Langmuir. 1985;1:600-605.
- Microporous Mesoporous Mater.. 2005;83:47-50.
- J. Phys. Chem. B. 2005;109:6982-6989.
- Langmuir. 2002;18:4819-4825.
- Chem. Eur. J.. 2006;12:7282-7302.
- J. Power Sources. 2007;173:502-509.
- Chem. Eur. J.. 2002;8:2602-2607.
- Chemical Applications Of Infrared Spectroscopy. New York, N.Y.: Academic Press; 1963.
- Introduction to the principles of ceramic processing. New York, N.Y.: Wiley; 1988.
- Chem. Mater.. 1996;8:1904-1912.
- J. Am. Chem. Soc.. 2003;125:12907-12913.
- Chem. Mater.. 1991;3:175-181.
- Arab. J. Chem.. 2012;5:447-452.
- J. Phys. Chem. B. 1999;103:3225-3228.
- Bull. Chem. Soc. Jpn.. 1989;62:2070-2072.


