

Translate this page into:
Adsorption of methyl orange onto protonated cross-linked chitosan
⁎Corresponding author. Tel.: +86 29 87092226. huangrh20022002@aliyun.com (Ruihua Huang)
-
Received: ,
Accepted: ,
This article was originally published by Elsevier and was migrated to Scientific Scholar after the change of Publisher.
Peer review under responsibility of King Saud University.

Abstract
The adsorption of methyl orange (MO) from aqueous solutions on protonated cross-linked chitosan was studied in a batch system. The results showed that the adsorption of MO onto protonated cross-linked chitosan was affected significantly by initial MO concentration, adsorbent dosage, adsorption temperature, and contact time. The pH value of solution had a minor impact on the adsorption of MO in a pH range of 1.0–9.1. The equilibrium isotherms at different temperatures (293, 303, and 313 K) and pH values (4.5, 6.7, and 9.1) were investigated. Langmuir model was able to describe these Equilibrium data fitted perfectly. The maximum monolayer adsorption capacities obtained from the Langmuir model were 89.29, 130.9, and 180.2 mg/g at 293, 303, and 313 K, respectively. Adsorption kinetics at different concentrations (100, 200 and 300 mg/L) and pH values (4.5, 6.7 and 9.1) were also studied. The kinetics was correlated well with the pseudo second-order model.
Keywords
Methyl orange
Protonated cross-linked chitosan
Adsorption
Isotherm

1 Introduction
Most of anionic dyes from textiles, clothing, printing and dyeing processes are considered as hazardous and toxic to some organisms. And once these dyes are discharged into water body, they would cause direct destruction to aquatic creatures. There are many studies on techniques for the removal of dyes from wastewater including photochemical degradation, biological degradation, coagulation, chemical oxidation, reverse osmosis, flotation and adsorption (Nataraj et al., 2009; Baseri et al., 2013; Azizian et al., 2009; Kant, 2013; Kiran et al., 2013). Among these techniques, adsorption is one of the most effective methods for the removal of dye. A large variety of adsorbent materials has been proposed and investigated their ability to remove dyes (Auta and Hameed, 2013; Nethaji et al., 2013). The adsorbent used commonly in wastewater treatment system is activated carbon (AC) because it has a large specific surface area. However, the lack of dispersion of AC powder brings a pity to its further application. Recently, some biosorbent materials, such as fungal, bacterial biomass or biopolymers, have attracted much attention from many researchers (Pradeep-Sekhar et al., 2009; Wang and Li, 2013).
Chitosan is a biopolymer with a linear polysaccharide based on glucosamine unit, which may be obtained by deacetylation of chitin. Chitosan is considered to be both a versatile and an environmentally friendly raw material as it is non-toxic, biodegradable, and widely distributed. It has been applied in many fields including food processing, agriculture, medicine, textile, wastewater treatment, etc. However, its broader application was limited to some degree due to its dissolution in acid medium. To overcome such a problem, cross-linking is one of the most effective methods to improve its stability in acid medium. Epichlorohydrin and glutaraldehyde are often used as its cross-linking agents. Cross-linked chitosan is insoluble in acid solution and its stability enhances accordingly. However, cross-linking is often at the cost of the consumption of hydroxyl and amino groups in chitosan, leading to a decrease in the adsorption capacity of chitosan. In order to raise its adsorption capacity, cross-linked chitosan would be protonated further for the improvement of the positively charged characteristic of chitosan. An increase in positively charged characteristic would facilitate the removal toward anion dye.
The objectives of this study are: (1) to prepare a protonated cross-linked chitosan.(2) to study the adsorption of methyl orange as an example of an anionic dye onto protonated cross-linked chitosan, and (3) to investigate the influence of various experimental conditions, such as initial dye concentration, adsorbent dosage, and pH of dye solution. Also, the adsorption capacity of protonated cross-linked chitosan was studied with the adsorption isotherm technique. The experimental data were then fitted into the Langmuir and Freundlich equations. The adsorption kinetics was determined quantitatively by pseudo-first order and pseudo-second order models.
2 Materials and methods
2.1 Materials
Chitosan was purchased from the Sinopharm Group Chemical Reagent Limited Company (China). The degree of deacetylation was 90% and the molecular weight was 100,000 g/mol. Methyl orange (MO) was supplied by Sigma chemical company, and used as adsorbate in the tests. The chemical structures of MO and chitosan are shown in Fig. 1. MO concentrations were measured using a UV–vis spectrometer at a wavelength corresponding to the maximum absorbance for MO: 464 nm. Sodium hydroxide, glacial acetic acid, glutaraldehyde, chlorhydric acid and all other reagents were of analytical grade. pH of MO solutions was adjusted by adding 0.1 M HCl (or) NaOH solution.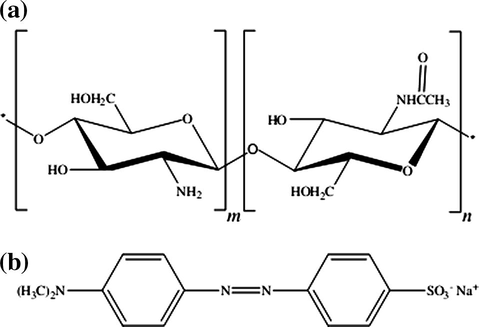
Chemical structures of (a) chitosan and (b) methyl orange.
2.2 Preparation of protonated cross-linked chitosan
Chitosan (3.6 g) was dissolved thoroughly in 2.0 wt% glacial acetic acid solution (120 ml). The chitosan solution was coated in culture vessels to form uniform membranes. Subsequently, these membranes were soaked in 0.1 M NaOH solution to separate from these culture vessels, and washed with distilled water to neutral pH, and dried at 60 °C. These dry membranes were cross-linked with 2.5 wt% glutaraldehyde solution and the ratio of glutaraldehyde to chitosan was approximately 25 mL/g of dry membranes. Cross-linking reaction occurred for 23 h at 60 °C and then these cross-linked membranes were washed with distilled water to remove any free glutaraldehyde.
After the cross-linked chitosan membranes were treated with concentrated HCl for 90 min for protonation of membranes (Viswanathan et al., 2009), the protonated cross-linked chitosan membranes were washed with distilled water to neutral pH, dried at 60 °C, and were ground to obtain particles of 100-mesh size, which was used for adsorption studies.
2.3 Adsorption experiments
The adsorption of MO onto protonated cross-linked chitosan was studied by a batch method. A certain amount of adsorbent was placed in a 250 mL erlenmeyer flask, into which 50 mL MO solution was added. The adsorption experiments were performed in a temperature-controlled water bath shaker at 200 rpm. The supernatant was measured using a UV–vis spectrometer at 464 nm for its residual MO concentration. The different parameters studied included: (i) effect of adsorbent dosage: (0.06–0.27 g) at a constant temperature (20 °C), pH unadjusted; (ii) effect of pH: (1–10.5) at a constant temperature (20 °C) and different concentrations (100, 200, and 300 mg/L); (iii) effect of MO concentration: (100–500 mg/L) at a constant temperature (20 °C), pH unadjusted. (iv) effect of contact time: (5–330 min) at a constant temperature (20 °C) and different concentrations (100, 200, and 300 mg/L). (v) effect of adsorption temperature: (20, 30, and 40 °C) at different concentrations ranging from 100 to 700 mg/L.
Besides, the adsorption isotherms at different temperatures and pH values of MO solutions were investigated to understand the adsorption behavior. And the kinetics was also evaluated at different concentrations and pH values of MO solutions to investigate the adsorption characteristic.
3 Results and discussions
3.1 Effect of adsorbent dosage
The effect of adsorbent dosage on MO adsorption was investigated by changing the adsorbent dosage from 0.09 to 0.27 g. The results (Fig. 2a) show that the removal percentage of MO increased as increasing adsorbent dosage. This was due to increased adsorbent surface and availability of more adsorption sites. However, even though the removal percentage toward MO enhanced, the adsorption capacity (mg of dye adsorbed/g of adsorbent) decreased with increasing adsorbent dosage. This decrease in adsorption capacity may be attributed to overlapping or aggregation of adsorption sites resulting in a decrease in total adsorbent surface area available to the dye and an increase in diffusion path length (Crini and Badot, 2008). When the adsorbent dosage exceeded 0.18 g, MO was almost removed completely. Considering the removal percentage together with adsorption capacity, 0.18 g of adsorbent dosage was chosen for further experiments.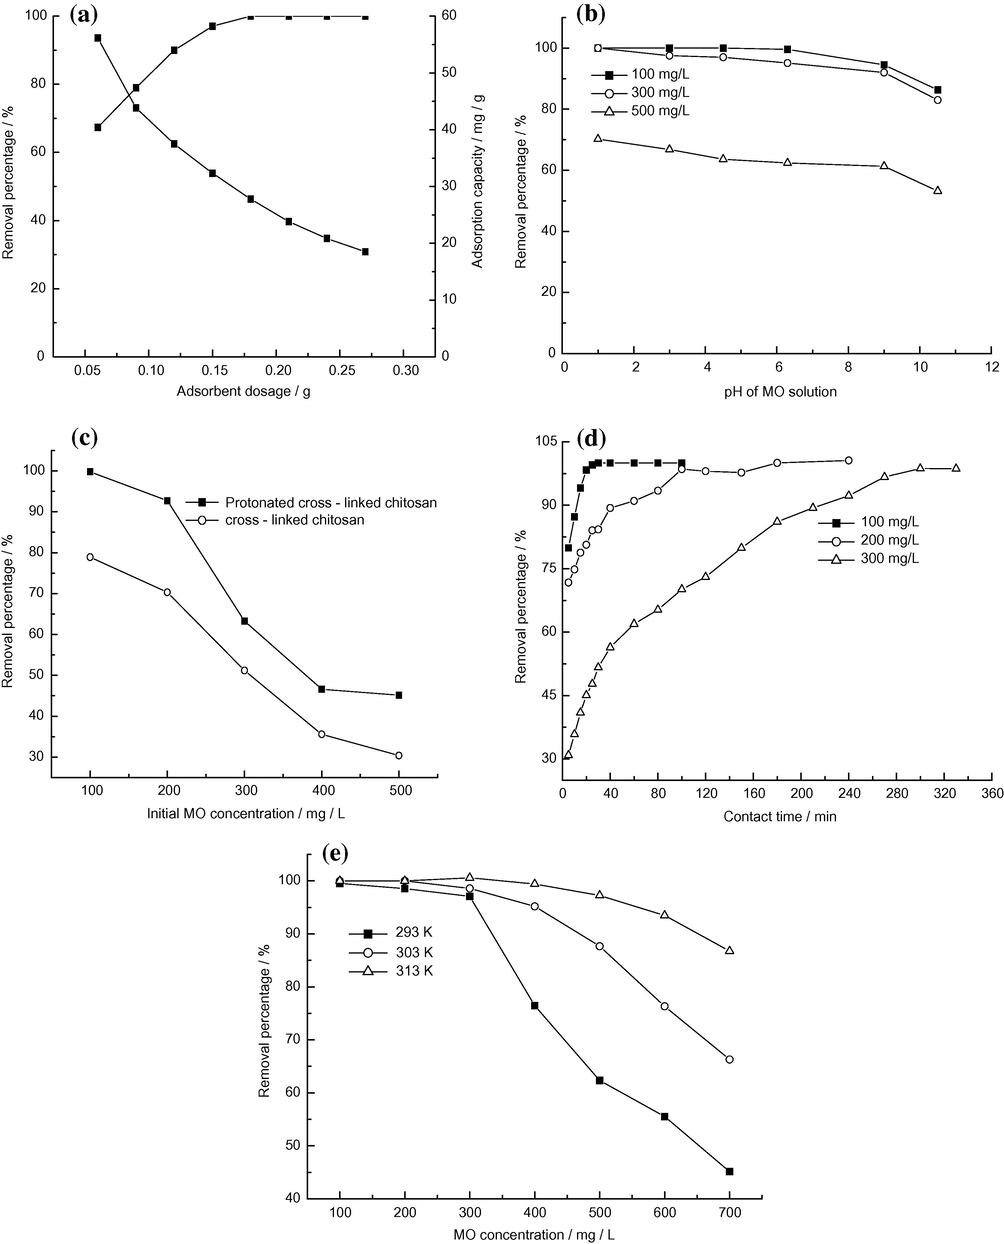
Effects of operation conditions on adsorption: adsorbent dosage (a); pH of MO solution (b); MO concentration (c); contact time (d) and adsorption temperature (e).
3.2 Effect of pH
The pH value of MO solution plays an important role in the whole adsorption process, influencing not only the surface charge of the adsorbent, and the dissociation of functional groups on the active sites of the adsorbent, but also the chemistry of MO solution. The effect of pH value of initial MO solutions on adsorption is shown in Fig. 2b. The removal percentage decreased by 5.3%, 5.5%, and 6.7% for 100, 200, and 300 mg/L MO concentrations, respectively, when the pH value of MO solutions varied from 1.0 to 9.1. MO removal decreased significantly at these pH values higher than 9.1. These results indicated that this adsorbent has shown a relatively stable removal toward MO in a wide range of pH (1.0–9.1). According to the literatures (Zhu et al., 2009; Javed et al., 2011; Chiou and Li, 2002), the optimum pH was frequently reported to be around pH 3–6 when chitosan was used as adsorbent. In this study, a great adsorption was observed in a wide pH range of 1.0–9.1. This may be attributed to the protonation of amine groups in chitosan before adsorption. Adsorption mechanism may be as follows:
First MO is dissolved in an aqueous solution after which the sulfonate groups of MO dye (R–SO3Na) become dissociated and converted into anionic dye ions. Second the adsorption process is performed due to electrostatic attractions between the adsorbent surface and the MO anions However, the adsorption weakened with increasing the pH value of MO solution. The decrease of MO adsorption can be explained by the competition of the abundant presence of OH− ions in basic solution for adsorption sites with MO anions. Since this adsorbent showed a strong adsorption at natural pH, the pH values of MO solutions were unadjusted for further experiments without special instructions.
3.3 Effect of initial MO concentration
Fig. 2c shows the effect of initial MO concentration on adsorption. The removal percentage reduced with an increase in initial MO concentration at a fixed adsorbent dosage (0.18 g). This trend may be explained as follows. In the case of lower concentrations, the ratio of initial number of dye molecules to the available adsorption sites was low and subsequently more adsorption sites were available for dye molecules, thus the removal percentage increased. However, at higher concentrations, the ratio of initial number of the available adsorption sites to dye molecules was low, thus the number of available adsorption sites becomes lower and subsequently the removal of dyes decreased. Fig. 2c also shows that the adsorption capacity of the protonated cross-linked chitosan increased compared with one of the cross-linked chitosans for the same MO concentration, as expected. Protonation was able to improve the adsorption of anion dye onto chitosan effectively.
3.4 Effect of contact time
Contact time is another important variable in adsorption processes. Fig. 2d shows the effect of contact time on adsorption for various MO concentrations. The results show that with increasing MO concentration, the time required to reach equilibrium increased accordingly. For initial dye concentrations of 100, 200, and 300 mg/L, the times reaching equilibrium were 30, 100 and 270 min, respectively. At low initial concentrations, the MO adsorption by chitosan was very intense and reached equilibrium very quickly. However, during the adsorption process, the adsorbent surface was progressively blocked by dye molecules, becoming covered after some time. The hindrance enhanced with increasing dye concentration, and thus the time for adsorption equilibrium increased accordingly. When Gibbs et al. (2003) investigated the adsorption of AG 25 onto chitosan, the similar results were also observed. The time attaining equilibrium increased with increasing concentrations. Their study found that 1–2 h was sufficient to achieve complete recovery of the dye at initial concentrations below 100 mg/l. However, for the highest concentration (200 mg/l), 8 h was necessary to reach equilibrium. In this work, in order to achieve adsorption equilibrium, the data were measured in 12 h for adsorption isotherms.
3.5 Effect of adsorption temperature
A plot of the removal percentage toward MO with initial concentration from 100 to 700 mg/L at different adsorption temperatures (20, 30, and 40 °C) is shown in Fig. 2e. The results reveal that the removal percentage increased with increasing temperatures for the same MO concentration. The increase in temperature would provide a faster rate of diffusion of adsorbate molecules from the solution to the adsorbent (Bernardin, 1985). Also, a rise in temperature would produce a swelling effect together with an increase in the internal structure of chitosan. The greater the particle pore sizes were, the smaller the resistance of dye molecules into chitosan was. Therefore, the above aspects resulted in an increase in removal percentage. Similar profiles were found by Dutta et al. (2001). When they studied the adsorption of reactive and direct dyes on chitosan, they also observed that as the temperature of the solution increased, so did the extent of adsorption. However, generally speaking, the adsorption process is not usually operated at high temperatures because this would increase operation costs. Therefore, in this study, room temperature was adopted for the following experiments.
3.6 Adsorption isotherms
The equilibrium adsorption isotherm can be obtained by plotting the concentration at the surface of a solid phase versus the concentration in the liquid phase. The distribution of the adsorbate between the sorbent and the liquid phase is a measure of the position of equilibrium in the adsorption process and can generally be expressed by isotherm models. In the present investigation, the equilibrium data were analyzed according to Langmuir (Eq. (1)) and Freundlich (Eq. (2)) adsorption isotherms:
The sorption data were analyzed according to the Eq. (1) of the Langmuir isotherm and Eq. (2) of the Freundlich isotherm. The plots of Ce/qe against Ce, and log qe against log Ce for solutions, are shown in Figs. 3 and 4, respectively. The parameters for the two isotherm models are summarized in Table 1. It can be seen that the Langmuir model was obviously the most appropriate to describe the adsorption process due to its high correlation coefficients relative to the ones obtained from Freundlich model. The equilibrium monolayer capacities, Q0, enhanced with increasing temperature from 20 to 40 °C, indicating that the adsorption of MO onto the protonated cross-linked chitosan was in favor of high temperatures. Also, the equilibrium monolayer capacities, Q0 changed slightly at three different pH values, and this fact suggests that the MO adsorption onto protonated cross-linked chitosan was stable in a wide range of pH, which was in accordance with the results mentioned in Section 3.2. Table 2 lists the comparison of maximum monolayer adsorption capacity of MO on various adsorbents. From Table 2, it was found that the protonated cross-linked chitosan studied had a relatively high adsorption capacity toward MO.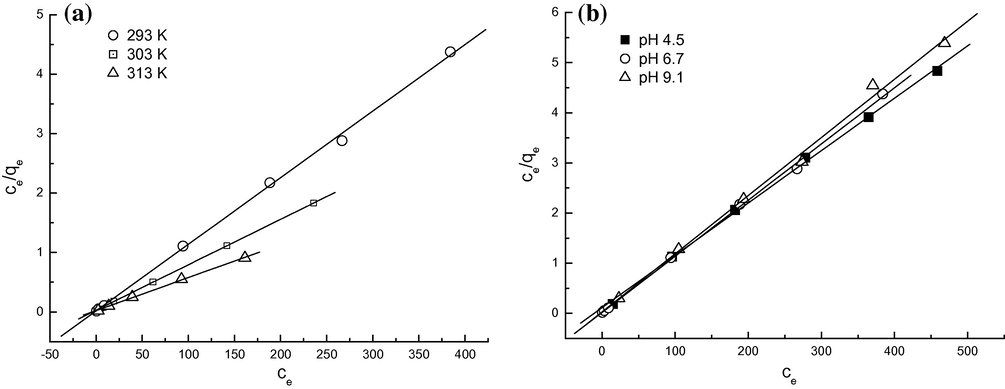
Langmuir models for MO adsorption onto protonated cross-linked chitosan at different temperatures (a) and at different pH values of solutions (b).
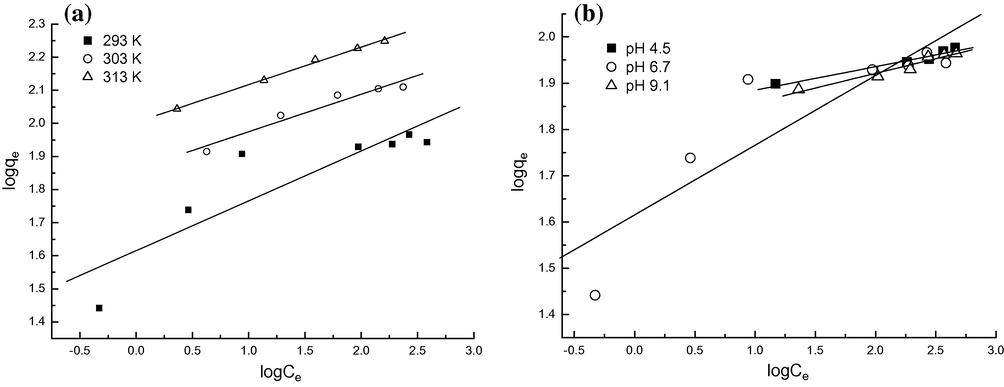
Freundlich models for MO adsorption onto protonated cross-linked chitosan at different temperatures (a) and at different pH values of solutions (b).
Parameters
Langmuir
Freundlich
b
Q0
R2
Kf
1/n
R2
Temperature/K
293
0.6094
89.29
0.9994
41.25
0.1506
0.8889
303
0.2616
130.9
0.9999
72.71
0.1133
0.9921
313
0.2383
180.2
0.9995
100.9
0.1135
0.9982
pH
4.5
0.0926
95.69
0.9993
68.27
0.0508
0.9722
6.7
0.6094
89.29
0.9994
41.25
0.1506
0.8889
9.1
0.5617
86.21
0.9976
62.30
0.0634
0.9706
Adsorbent
Adsorption capacity (mg/g)
References
Y-Fe2O3/SiO2/chitosan composite
34.29
Zhu et al. (2011)
Nanoporous core–shell Cu@Cu2O nanocomposite
344.84
Kou et al. (2013)
Acid modified carbon coated monolith
147.06
Willie et al. (2013)
Activated carbon derived from Phragmites australis
238.1
Chen et al. (2010)
Mesoporous Y-Fe2O3/SiO2 nanocomposites calcined
476
Deligeer et al. (2011)
MgNiAl layered double hydroxides
375
Hassina et al. (2012)
Calcined Lapindo volcanic mud
333.3
Aishah et al. (2010)
Chitosan
34.83
Saha et al. (2010)
Protonated cross-linked chitosan
89.30
This study
3.7 Adsorption kinetics
In order to investigate the adsorption characteristic further, the pseudo first-order and pseudo second-order equations were used to test the experimental data of various MO concentrations, and pH. The expressions of pseudo first-order and second-order equations were given according to Eqs. (3) and (4), respectively.
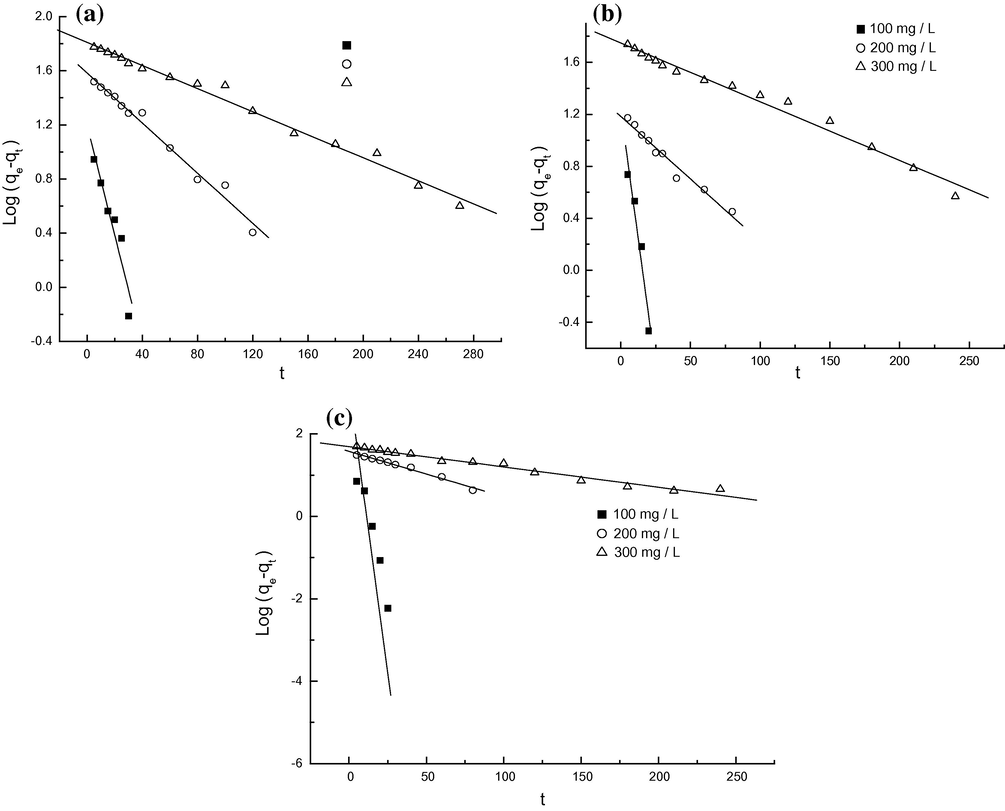
Pseudo first-order models for MO onto protonated cross-linked chitosan at pH 4.5 (a), 6.7 (b) and 9.1 (c).
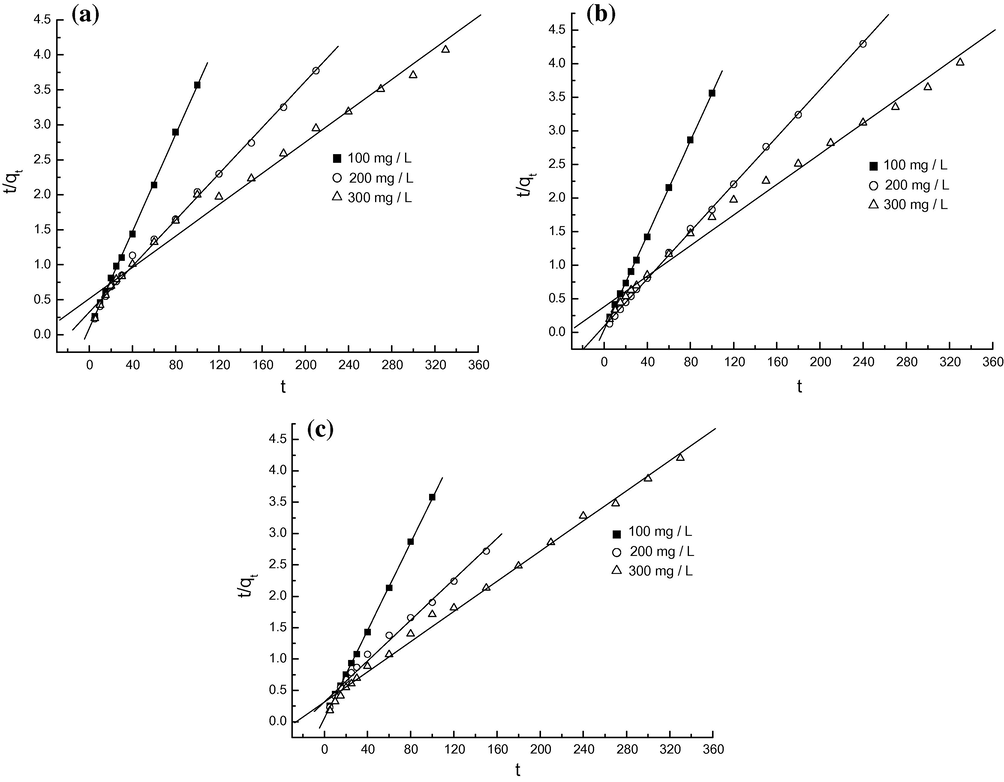
Pseudo second-order models for MO onto protonated cross-linked chitosan at pH 4.5 (a), 6.7 (b) and 9.1 (c).
Parameters
Pseudo-first-order kinetic model
qe (exp)
Pseudo-second-order model
k1
qe (cal)
R2
k2
qe (cal)
R2
pH 4.5
100
0.0932
15.73
0.9448
27.81
0.01291
28.84
0.9997
200
0.0213
38.38
0.9912
58.70
0.000842
60.64
0.9976
300
0.0099
64.59
0.9939
87.92
0.000243
89.37
0.9913
pH 6.7
100
0.1825
17.28
0.9692
27.65
0.03353
28.39
0.9999
200
0.0221
15.29
0.9851
54.74
0.003428
56.82
0.9998
300
0.0104
56.03
0.9911
85.58
0.0003410
87.87
0.9940
pH 9.1
100
0.3595
86.84
0.8843
27.81
0.021873
28.55
0.9998
200
0.0253
37.62
0.9919
52.56
0.000834
51.43
0.9951
300
0.0113
49.10
0.9875
80.63
0.00046
83.13
0.9975
4 Conclusions
This study investigates these factors affecting MO adsorption onto protonated cross-linked chitosan, including adsorbent dosage, initial MO concentrations, adsorption temperature, pH value of MO solution and contact time. The adsorption isotherms at different temperatures and various pH values of MO solution are studied. Also, the adsorption kinetics is measured at different concentrations and pH values of MO solution. The following results are obtained:
The adsorption of MO onto protonated cross-linked chitosan was affected significantly by initial MO concentration, adsorbent dosage, adsorption temperature, and contact time. However, the adsorption of MO onto protonated cross-linked chitosan was slightly influenced by pH value of MO solution in a pH range of 1.0–9.1.
Protonation can improve MO adsorption onto chitosan. The electrostatic interaction between the protonated amine groups (–NH3+) of chitosan and anionic dye was the main adsorption mechanism.
The Langmuir equation agreed with the equilibrium isotherm for all the cases we studied. The maximum monolayer adsorption capacities obtained from the Langmuir model were 89.29. 130.9, and 180.2 mg/g, respectively, at 20, 30 and 40 °C.
The pseudo second-order kinetic model described the dynamical behavior for the adsorption of MO onto protonated cross-linked chitosan well. The adsorption rates slowed with increasing MO concentration, and the equilibrium time prolonged.
Acknowledgements
The financial support extended to the projects by the National Natural Science Foundation of China (Grant No. 51003086) and National Higher-education Institution General Research and Development Project (No. QN2009049) is gratefully acknowledged.
References
- Adsorption of methyl orange from aqueous solution onto calcined Lapindo volcanic mud. J. Hazard. Mater.. 2010;181:755-762.
- [Google Scholar]
- Biosorption of reactive dyes by dried activated sludge: equilibrium and kinetic modeling. Biochem. Eng. J.. 2001;7:79-84.
- [Google Scholar]
- Equilibrium and kinetic modelling of biosorption of remazol black B by Rhizopus arrhizus in a batch system: effect of temperature. Process Biochem.. 2000;36:431-439.
- [Google Scholar]
- Coalesced chitosan activated carbon composite for batch and fixed-bed adsorption of cationic and anionic dyes. Colloids Surf., B. 2013;105:199-206.
- [Google Scholar]
- Adsorption of methyl violet onto granular activated carbon: equilibrium, kinetics and modeling. Chem. Eng. J.. 2009;146:36-41.
- [Google Scholar]
- Polyaniline nano composite for the adsorption of reactive dye from aqueous solutions: equilibrium and kinetic studies. Asian J. Chem.. 2013;25(8):4145-4149.
- [Google Scholar]
- Bernardin, F.E., 1985. Experimental design and testing of adsorption and adsorbates. In: Slejko, F.L., (Ed.), Adsorption Technology: A Step-By-Step Approach to Process Evaluation and Application. Marcel Dekker Inc., New York, pp. 37–90 (Chapter 2).
- Equilibrium and kinetic studies of methyl orange and methyl violet adsorption on activated carbon derived from Phragmites australis. Desalination. 2010;252:149-156.
- [Google Scholar]
- Equilibrium and kinetic modeling of adsorption of reactive dye on cross-linked chitosan beads. J. Hazard. Mater.. 2002;B93:233-248.
- [Google Scholar]
- Application of chitosan, a natural amino polysaccharide, for dye removal from aqueous solutions by adsorption processes using batch studies: a review of recent literature. Prog. Polym. Sci.. 2008;33:399-447.
- [Google Scholar]
- Adsorption of methyl orange on mesoporous Y-Fe2O3/SiO2 nanocomposites. Appl. Surf. Sci.. 2011;257:3524-3528.
- [Google Scholar]
- Adsorption for dyehouse effluent by low cost adsorbent (chitosan) Asian Text. J.. 2001;10:57-63.
- [Google Scholar]
- Adsorption of acid green 25 on chitosan: influence of experimental parameters on uptake kinetics and adsorption isotherms. J. Appl. Polym. Sci.. 2003;90:1073-1080.
- [Google Scholar]
- Removal of methyl orange from aqueous solution by uncalcined and calcined MgNiAl layered double hydroxides (LDHs) Chem. Eng. J.. 2012;187:142-149.
- [Google Scholar]
- Adsorption of acid yellow dye on flakes of chitosan prepared from fishery wastes. Arabian J. Chem.. 2011;4:389-395.
- [Google Scholar]
- Adsorption of dye olive BGL using two different samples of activated carbon by static batch method. Asian J. Chem.. 2013;25(4):1905-1908.
- [Google Scholar]
- Degradation and mineralization of azo dye reactive blue 222 by sequential photo-fenton’s oxidation followed by aerobic biological treatment using white rot fungi. Bull. Environ. Contam. Toxicol.. 2013;90(2):208-215.
- [Google Scholar]
- Adsorption behavior of methyl orange onto nanoporous core-shell Cu@Cu2O nanocomposite. Chem. Eng. J.. 2013;223:76-83.
- [Google Scholar]
- Nanofiltration and reverse osmosis thin film composite membrane module for the removal of dye and salts from the simulated mixtures. Desalination. 2009;249(1):12-17.
- [Google Scholar]
- Adsorption isotherms, kinetics and mechanism for the adsorption of cationic and anionic dyes onto carbonaceous particles prepared from Juglans regia shell biomass. Int. J. Environ. Sci. Technol.. 2013;10(2):231-242.
- [Google Scholar]
- Bio-polymer adsorbent for the removal of malachite green from aqueous solution. Chemosphere. 2009;77:842-847.
- [Google Scholar]
- Adsorption of methyl orange onto chitosan from aqueous solution. J. Water Resour. Prot.. 2010;2:898-906.
- [Google Scholar]
- Removal of fluoride from aqueous solution using protonated chitosan beads. J. Hazard. Mater.. 2009;161:423-430.
- [Google Scholar]
- Adsorption of CI reactive red 228 dye from aqueous solution by modified cellulose from flax shive: kinetics, equilibrium, and thermodynamics. Ind. Crops Prod.. 2013;42:153-158.
- [Google Scholar]
- Acid modified carbon coated monolith for methyl orange adsorption. Chem. Eng. J.. 2013;215–216:747-754.
- [Google Scholar]
- Adsorption of an anionic azo dye by chitosan/kaolin/γ-Fe2O3 composites. Appl. Clay Sci.. 2009;48:522-526.
- [Google Scholar]
- Preparation, characterization and dye adsorption properties of Y-Fe2O3/SiO2/chitosan composite. Appl. Surf. Sci.. 2011;258:1337-1344.
- [Google Scholar]


