Translate this page into:
Adsorption properties and mechanism of sepiolite to graphene oxide in aqueous solution
⁎Corresponding author. wellswang@usx.edu.cn (Wei Wang)
-
Received: ,
Accepted: ,
This article was originally published by Elsevier and was migrated to Scientific Scholar after the change of Publisher.
Peer review under responsibility of King Saud University.
Abstract
Graphene oxide (GO) is widely used in various fields such as improving the performance of cement-based materials and making composite materials due to its large specific surface area and abundant oxygen-containing functional groups. However, it has also caused water pollution. To remove GO in aqueous solution, sepiolite (SEP) was used to adsorb it. The effects of pH, adsorbent quality, GO concentration, temperature and adsorption time on the ability of SEP to adsorb GO were investigated. The materials were characterized by SAP and laser particle size analyzer, and the adsorption performance and mechanism of SEP for GO were further analyzed by XRD, FTIR, SEM, TEM, XPS, AFM, and Zeta potential microscopic tests. The results showed that: 1) Under the conditions of temperature 303 K, pH = 3, adsorbent mass 30 mg, and initial concentration of GO 100 mg/L, the adsorption effect was the best, and the adsorption rate reached 94.8 %. 2) The adsorption reached equilibrium at 2160 min, and the adsorption process was more in line with the pseudo-second-order adsorption kinetic equation, and the adsorption behavior was controlled by chemical effects. 3) The adsorption of SEP to GO is more consistent with the Langmuir and Temkin adsorption isotherm model, and the reaction is a spontaneous, endothermic, and entropy-increasing process. Experiments showed that SEP had a strong adsorption capacity for GO, which provides a reference for the treatment of toxic GO in aqueous solution and the realization of water ecological protection.
Keywords
Sepiolite
Graphene oxide
Adsorption mechanism
Adsorption isotherm
Adsorption dynamics
1 Introduction
Graphene has become the most popular carbon nanomaterial in recent years due to its unique physical and chemical properties, among which graphene oxide (GO) is the most important one. However, during the production, use and disposal of GO, there are risks of environmental pollution. Some literature shows that GO itself has certain toxicity; the higher the concentration, the stronger the toxicity (Jia et al., 2019; Seabra et al., 2014). Different concentrations of GO have toxic effects on the growth of algae, inhibit the formation of photosynthetic pigments, and cause algal cell death (Hazeem et al., 2017). GO has different toxic effects on different microorganisms, and the main influencing factors are the concentration and contact time of GO (Liu et al., 2011).
Therefore, many scholars have used different materials to adsorb GO in aqueous solution. There are a large number of clay minerals in nature. Studies have shown that when GO enters the surface environment, it is likely to contact and interact with clay minerals (Xia et al., 2015). For example, attapulgite in clay minerals can effectively remove GO in aqueous solution (Li et al., 2022b). In addition, some scholars have used Hainan calcareous sand (Lv et al., 2021) and iron tailings sand (Zhou et al., 2021b) to adsorb GO. The study found that the addition of adsorbed GO to the kaolinite suspension can increase the strength of the surface force interaction (Hoor et al., 2020).
However, GO also has the advantages of large specific surface area, and contains abundant oxygen-containing functional groups, such as hydroxyl, carboxyl, epoxy, etc., which make it have good dispersibility in water, and have excellent hydrophilic properties, thus broadening its application range in various fields. The application in cement-based materials has also received extensive attention. The oxygen-containing functional groups of GO provide adsorption sites for cement and water molecules, thereby significantly increasing the hydration rate of cement (Lin et al., 2016). The study found that the incorporation of GO can improve the crack resistance of the cement matrix (Li et al., 2017). Incorporating GO into cement-based materials can improve the compressive strength of cement by improving the bond strength of cement (Pan et al., 2015). It can be seen that although GO has been widely used, it will also pollute the ecological environment, so the environmental toxicity of GO has become a problem that cannot be ignored.
Sepiolite (SEP) is a kind of fibrous clay, which is a kind of natural one-dimensional clay mineral with fibrous crystal structure and water-rich magnesium-aluminosilicate (Ma et al., 2007). SEP has a special chain-layered structure, and a theoretical specific surface area of up to 900 m2/g. Compared to most other adsorbents, SEP has the advantages of relatively low price, abundant reserves, and simple processing technology (Adeyemo et al., 2017). SEP has a special chain-like structure, in which the layered structure is included. The two layers of silicon-oxygen tetrahedron are wrapped with magnesium-oxygen octahedron, and the three-dimensional structure is connected with silicon-oxygen bond. The unique crystal morphology can be extended in one direction, so the morphology shows fiber or rod shape (Beauger et al., 2013). This structure forms honeycomb pores, in which a large amount of water or polar substances, including low polar substances, can be absorbed. The special micromorphology and nanoscale pores give this kind of clay minerals excellent ion exchange ability and adsorption performance (Hojati and Khademi, 2013). SEP is an easily available adsorbent with abundant reserves. In recent years, the research on the properties of SEP has been deepened, and a large number of SEPs with different functions have been put into use, making sepiolite mineral a hot spot in research and development.
Fig. 1 is a network visualization diagram of keywords related to SEP analyzed by VOSviewer. The size of nodes and their labels is proportional to the frequency of keywords. The higher the frequency, the larger the size. The color of a keyword indicates the cluster it belongs to, and keywords of the same color also have a certain correlation, and the distance between keywords can also reflect the correlation. The closer the correlation, the smaller the distance between keywords in the map (Van Eck and Waltman, 2010). It can be seen that the word “adsorption” dominates the figure, so SEP is mainly used as an adsorbent. In addition, SEP is also widely used in agriculture, construction, medicine and so on.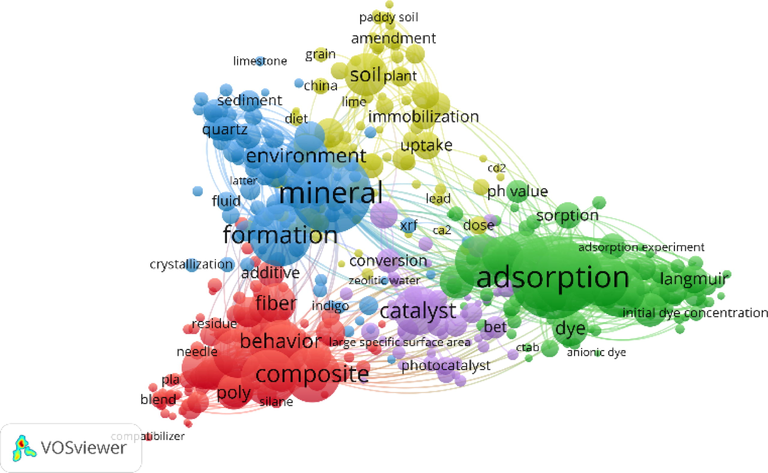
VOSviewer network visualization diagram of keywords related to “SEP”.
SEP is recognized as the clay mineral with the strongest adsorption capacity, and has been applied in the field of wastewater treatment. It mainly includes the treatment of wastewater containing a large number of organic compounds produced in the production process of papermaking, printing and dyeing industries, as well as the wastewater containing heavy metal ions produced in the production process of mining, industrial production and other fields. Some scholars have found that SEP is an effective amendment to repair Cd contaminated soil (Zhou et al., 2022). Using SEP as fixative to fix Cd2+ in rice planting soil can maintain stability for two years (Liang et al., 2016). By modifying SEP with chitosan, a new type of chitosan sepiolite can be obtained, which can be used to remove atrazine from water. Among them, the protonation of –NH2 group in chitosan makes sepiolite skeleton expand, thus increasing its adsorption capacity for atrazine (Liu et al., 2015). At the same time, SEP is also used to recover and treat cationic dyes in industrial wastewater (Acar, 2022), and to to remove uranium and lanthanide ions as well as Cd2+, Cu2+ and other heavy metal ions in wastewater (Gladysz-plaska, 2019; Hong and Park, 2019). Pd(II) in acidic solution was recovered by modifying SEP (Yong et al., 2020), which shows that SEP has good stability and reusability. In addition, some scholars have synthesized a magnetically modified SEP by chemical precipitation to adsorb U4+ (Linghu et al., 2017). It can be seen that SEP has shown excellent application prospects in the fields of soil remediation and water quality improvement, providing help for environmental governance. In today's society, people's requirements for the environment are increasing day by day. As an efficient, cheap and easy-to-regenerate adsorbent, SEP provides a driving force for the control of environmental pollution and meets the current goal of sustainable development.
In summary, SEP is a good adsorption material, which has been used by many scholars to adsorb heavy metal ions, harmful gases, etc., but there are few reports on the removal of GO in water environment. Therefore, this study will use SEP as an adsorbent to remove GO from aqueous solution. Experimental conditions are one of the factors affecting the adsorption capacity. In this paper, the effects of different pH values, adsorbent quality, GO concentration, temperature, and adsorption time were studied. At the same time, a series of microscopic experiments were carried out, in which a specific surface area and pore size analyzer (SAP), laser particle analyzer, X-ray diffraction (XRD), Fourier transform infrared spectroscopy (FTIR), scanning electron microscope (SEM), atomic force microscope (AFM), transmission electron microscope (TEM), X-ray photoelectron spectroscopy (XPS), nanoparticle size, and potentiometric analyzer (Zeta potential) are used to analyze the composition and characterization, and explore its adsorption mechanism.
2 Test materials and methods
2.1 Materials
The water used in the experiment was 18MΩ·cm deionized water, which was prepared by a UPW-R15 pure water machine produced by Shanghai Yidian Scientific Instrument Co., ltd. The HCl used to adjust the pH is the hydrochloric acid standard titration solution produced by Guangzhou Hewei Pharmaceutical Technology Co., ltd., and the NaOH is produced by Oulian Hongda Industry and Trade Co., ltd., both of which are of domestic analytical grade and do not need further purification. The GO aqueous solution used in this experiment was 2 mg/mL and purchased from Suzhou Tanfeng Technology Co., ltd., China. The specific surface area is 420 cm2/g, and the element composition is shown in Table 1. SEP was purchased from Shijiazhuang Yuxin Building Materials Co., ltd. Its main chemical components are Si and Mg, the chemical formula is Mg(H2O)4[Si6O16]2·(OH)4·8H2O. The content of SiO2 is generally from 50 % to 65 %, and the content of MgO is from 12 % to 24 %. The main chemical components is shown in Table 2. The elemental composition of GO and the chemical composition of SEP are obtained from the material manufacturer.
Element
C
O
H
S
Ash content
Content/%
41.70
51.49
2.41
2.00
<1.00
Chemical Composition
SiO2
MgO
Al2O3
Fe2O3
S
L
Content/%
50.00 ∼ 65.00
12.00 ∼ 24.00
<5.00
<0.15
<0.03
<0.05
The specific surface area and pore size are important factors that affect the adsorption process. Table 3 shows the specific surface area, average pore size, pore volume and pore volume data of SEP used in this experiment.
Sample
Specific surface area
(m2/g)Average pore size
(nm)Pore volume
(cm3/g)Micropore volume
(cm3/g)
Sepiolite
4.011
6.445
0.006
0.575 × 10⁻³
Fig. 2 shows the particle size distribution diagram of GO (a) and SEP (b). It can be seen from the figure that the particle size distribution of SEP and GO is normal distribution. The particle size distribution range of GO is 0.991um ∼ 186um, most of the particles are distributed around 27.4um, and the average particle size is 27.8um. The particle size distribution range of SEP is 0.405um ∼ 127um, most of the particles are distributed at 31.1um, and the average particle size is about 14.3um. The comparison shows that the particle size of GO is larger than that of SEP.
Particle size distribution of GO(a), SEP(b).
2.2 Test scheme
2.2.1 Microscopic characterization test
The pore size distribution and specific surface area of the samples were measured by a specific surface area and pore size analyzer (SAP, Trisia II 3020, Micromeritics, USA). The particle size distribution of the material was analyzed using a laser particle size analyzer (Mastersizer 3000, Malvern, UK). The crystal structure of the adsorbent was analyzed by X-ray diffraction (XRD, Empyrean, UK), and the functional groups were identified by Fourier transform infrared spectroscopy (FTIR, IR Prestigae-21, Japan) with a scanning range from 400 cm−1 to 4000 cm−1. The surface morphology and elemental structure morphology of the material was characterized by scanning electron microscopy (SEM, JSM- 6360 LV, Japan), atomic force microscope (AFM, Dimension Icon, USA) and transmission electron microscope (TEM, JEM-2100F, Japan). In addition, X-ray photoelectron spectroscopy (XPS, Thermo ESCALAB 250XI, USA) was used to analyze the surface elemental composition of the material. The surface charge types and charge amount of the material at different pH were determined by nanoparticle size and potentiometric analyzer (Zeta potential, Nano-ZS90, Malvern, UK).
2.2.2 Static adsorption experiment
According to the experimental design, the optimal pH of SEP adsorption GO was determined first. In this experiment, the optimal pH was 3. Under the condition of pH = 3, the influence of adsorbent quality on adsorption effect was further explored. Under the condition of a certain initial concentration of GO and pH, 10, 20, 30, 40, 50 mg SEP were taken for the test, and the adsorbent mass under the maximum adsorption rate was 30 mg. To continue to explore the impact of initial GO concentration on adsorption, dilute solutions with initial GO concentration of 60 mg/L, 80 mg/L, 100 mg/L, 120 mg/L and 140 mg/L were taken for testing respectively, and the initial GO concentration under the best adsorption effect was selected as 100 mg/L. Under the condition of pH = 3 and SEP mass of 30 mg, three temperatures of 293 K, 303 K and 313 K were set, the concentration was changed at the same time. The adsorption isotherm was drawn to fit the adsorption isotherm model, and the thermodynamic parameters were analyzed to explore the effect of temperature on the adsorption of GO by SEP. Finally, after determining the optimal pH, adsorbent quality and initial GO concentration, the effect of time on the adsorption performance was studied, and the test time interval was reasonably arranged according to the test conditions until the adsorption reached equilibrium. The test time for this experiment was 0–2880 min. The kinetic equation was fitted and the kinetic parameters were analyzed using the data obtained from the experiment. The test plan is shown in Table 4.
Serial number
pH
SEP mass (mg)
GO concentration (mg/L)
Reaction temperature (K)
Contact time (h)
Purpose
1
3,4,5,6,7,8,9,10
50
80
303
24
Selection of optimal pH
2
3
10,20,30,40,50
80
303
24
Selection of optimal adsorbent quality
3
3
30
60,80,100,120,140
303
24
Selection of optimal adsorbate concentration
4
3
30
100
293,303,313
24
Explore the effects of temperature changes, isotherm equation fitting, thermodynamic equation fitting
5
3
30
100
303
0–48
Exploring the effect of reaction time, kinetic model equation fitting
2.3 Test procedure
The specific operation of the test is:
① The appropriate amount of GO was taken with a pipette gun and added to a glass bottle. Then deionized water added to prepare 50 mL of GO aqueous solution.
② Adjust the pH of the solution by adding negligible volumes of sodium hydroxide solution and hydrochloric acid solution, then measure with a pH meter and adjust the pH to the desired value.
③ According to the experimental design, the corresponding mass of SEP powder was weighed and added to the aqueous solution.
④ The glass bottle was placed in a constant temperature vibrating shaker, and vibrated at 240 rpm for 3 h.
⑤ After vibration, put the glass bottle into the curing box and cure it for 24 h at the set temperature.
⑥ After being cured, 1 mL of the supernatant was taken with a pipette gun and placed in a test tube. Three groups were taken from the same sample and diluted to 25 mL with deionized water.
⑦ The absorbance of the sample was measured by UV–vis spectrophotometer at a wavelength of 210 nm.
The main operation process is shown in Fig. 3: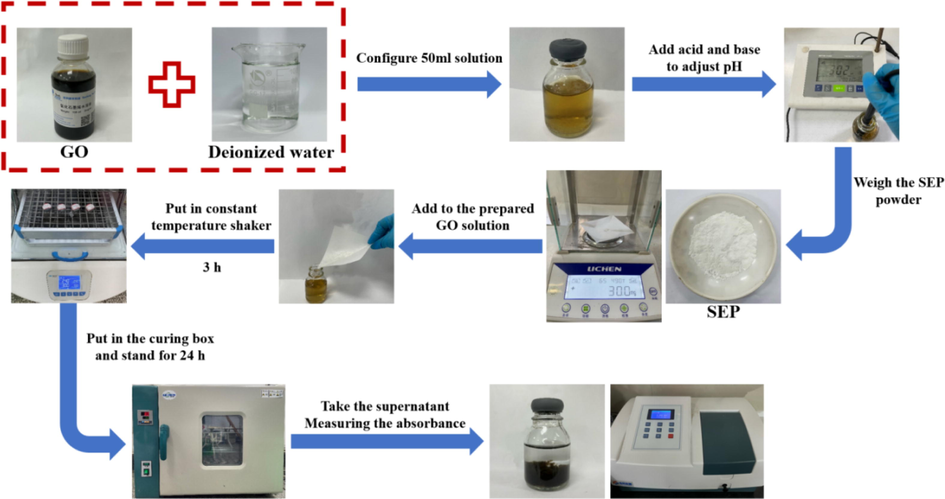
The main operation process of the test.
2.4 Test data processing
According to the initial GO concentration C0 (mg/L) and the equilibrium concentration Ce (mg/L), the adsorption amount Qe (mg/g), the adsorption rate R and the partition coefficient Kd (g/L) were calculated. The calculation formulas are as follows (Liu et al., 2021):
Where, m (mg) represents the mass of SEP powder, and V (mL) represents the volume of the solution. To ensure data accuracy, all experiments were repeated three times and the average value of the three experiments was taken for subsequent data analysis.
In order to explore the change of adsorption capacity with adsorption time and better study the adsorption mechanism, adsorption kinetics was introduced and the pseudo-first-order kinetic model and pseudo-second-order kinetic model were used to fit and analyze the data. The formulas are as follows (Yang et al., 2015):
The pseudo-first-order adsorption kinetic equation:
The pseudo-second-order adsorption kinetic equation:
Elovich adsorption kinetics equation:
Where, Qt represents the adsorption amount (mg/g) when the adsorption time is t, and k1 and k2 are pseudo-first-order and pseudo-second-order adsorption rate constants (g/(mg·min)), α is the initial adsorption rate constant (mg/g·min−2), β is the parameter related to the surface coverage of the adsorbent and the chemical adsorption activation energy (g/mg·min).
In order to further determine the control steps of the adsorption rate, the Intraparticle diffusion model, Boyd pseudo first model and Boyd-Ruthven-Ho model were used to fit the experimental data (Azari et al., 2021; Benjelloun et al., 2021b), the formula is as follows:
Intraparticle diffusion model:
Boyd pseudo first model:
Boyd-Ruthven-Ho model:
Where, kd is the coefficient of diffusion rate within the particle (mg/(g•min0.5)), C is the constant related to the boundary layer thickness (mg/g), ki,B is the rate constant of the particle diffusion model (mg·g−1·min−0.5), and B is the model parameter.
In order to explore the adsorption model of SEP for GO, GO with different concentrations was adsorbed at three temperatures of 293 K, 303 K, and 313 K, the adsorption isotherm was drawn. Langmuir, Freundlich and Temkin models were introduced to fit the adsorption data (Febrianto et al., 2009). The models are as follows:
Langmuir adsorption isotherm model:
Freundlich adsorption isotherm model:
Temkin adsorption isotherm model:
Where, Qe represents the equilibrium adsorption capacity (mg/g), Ce represents the equilibrium concentration (mg/L), Qmax represents the maximum adsorption capacity (mg/g), KL represents the adsorption equilibrium constant of Langmuir (L/mg), and KF represents the adsorption equilibrium constant of Freundlich (mg/g), n is a dimensionless constant related to temperature and adsorbent, KT is the adsorption equilibrium constant (L/mg) of Temkin, and C is the infinitesimal number related to temperature and the properties of the adsorption system.
According to the adsorption isotherms at different temperatures, the relevant thermodynamic parameters are obtained by calculation, and the specific calculation formulas are as follows (Cortes et al., 2019):
Where, R is the ideal gas constant, generally 8.3145 J/(mol·K), ΔG0 is the Gibbs free energy (kJ/mol), ΔH0 is the enthalpy change (kJ/mol), and ΔH0 is the entropy change (kJ/(mol·K)), T is the absolute temperature.
3 Test results and analysis
3.1 Micro analysis
3.1.1 XRD and FTIR analysis
To further reveal the reaction mechanism, GO, SEP and SEP/GO were analyzed and compared by XRD, and the detection results are shown in Fig. 4. It can be seen that GO has a strong diffraction peak at 2θ = 9.5°, which disappears after reacting with SEP. This is mainly because GO entered the interior of the SEP and was successfully loaded on the surface of the SEP, and the residual GO content was too low to be detected by the instrument (Li et al., 2022c). XRD analysis shows that the main components of SEP used in this paper are dolomite, calcite, amphibole, etc. Referring to the ICSD standard on the PDF card, 10.5° and 12.2° are marked as amphibole (1 1 0), 28.54° as amphibole (3 1 0), 29.5° as calcite CaCO3 (1 0 4), and 30.9° as dolomite CaMg(CO3)2 (1 0 4). It can be seen from Fig. 4 that the intensity of the characteristic diffraction peaks of SEP/GO is mostly lower than that of SEP, and no new diffraction peaks appear. After the adsorption reaction occurred, the front at 29.5° (1 0 4) and 30.9° (1 0 4) decreased significantly, indicating that calcite CaCO3 and dolomite CaMg(CO3)2 may be involved in the reaction.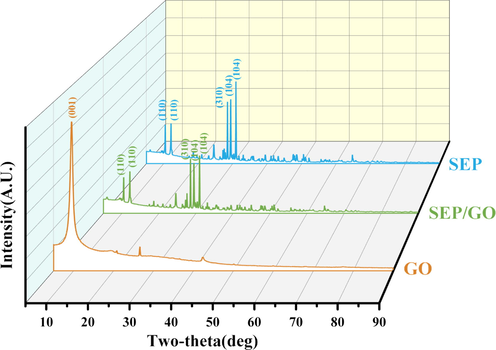
XRD patterns of GO, SEP, SEP/GO.
In addition, changes of functional groups before and after adsorption were observed by FTIR. It can be clearly seen in Fig. 5 the characteristic absorption peaks before and after the adsorption of GO by SEP. By observing the FTIR spectrum of GO, it can be seen that the absorption peaks at 3191 cm−1 and 1734 cm−1 represent the stretching vibration adsorption of —OH and C⚌O on the carboxyl group, respectively (Singh, 2021). The adsorption peak at 1622 cm−1 is the vibrational adsorption of C⚌C (Boukhoubza et al., 2020). The absorption peak at 1122 cm−1 is due to adsorption of C—O—C (Depan et al., 2011). The spectra of SEP and SEP/GO are similar, no new characteristic peaks appear, but the intensities are weakened. The absorption peak at 3676 cm−1 is generated by —OH combined with Mg+ (Qiu et al., 2013). The absorption peak at 3448 cm−1 is caused by the stretching vibration adsorption of zeolite water in the pores of SEP (Sabah and Çelik, 2002). The deformation of the water level H—O—H bending corresponds to 1428 cm−1 in the spectrum (Li et al., 2020). The characteristic peak at 993 cm−1 is attributed to the antisymmetric stretching vibration adsorption of the Si-O bond (Soheilmoghaddam et al., 2014). The symmetric stretching vibration of Si—O—Si and the vibrational absorption peak of octahedral Mg-O at 685 cm−1 and 758 cm−1 (Wang et al., 2010). The disappearance of the 1734 cm−1 front may be caused by the combination of Ca2+ in SEP and O—C⚌O in GO (Chowdhury et al., 2015), which is consistent with the change rule of CaCO3 and CaMg(CO3)2 in XRD. New characteristic peaks appeared at 685 cm−1 and 758 cm−1, indicating that GO was successfully loaded on the SEP surface.
FTIR spectra of GO, SEP, SEP/GO.
3.1.2 SEM and TEM analysis
SEM and TEM were used to observe the changes of the surface morphology of SEP before and after GO adsorption, as shown in Fig. 6. In Fig. 6(a) and (b), it can be observed that SEP is mainly rod-shaped and has a fibrous coarse surface structure with some impurity particles attached to the surface. It can be seen from Fig. 6(c) and (d) that GO is in the form of a smooth surface flake with slight wrinkles on the surface. Fig. 6(e) and (f) show the images of SEP/GO, it can be observed that the fibrous structure is attached to the surface of the tulle with obvious agglomeration and stacking, indicating that GO is attached to the surface of SEP.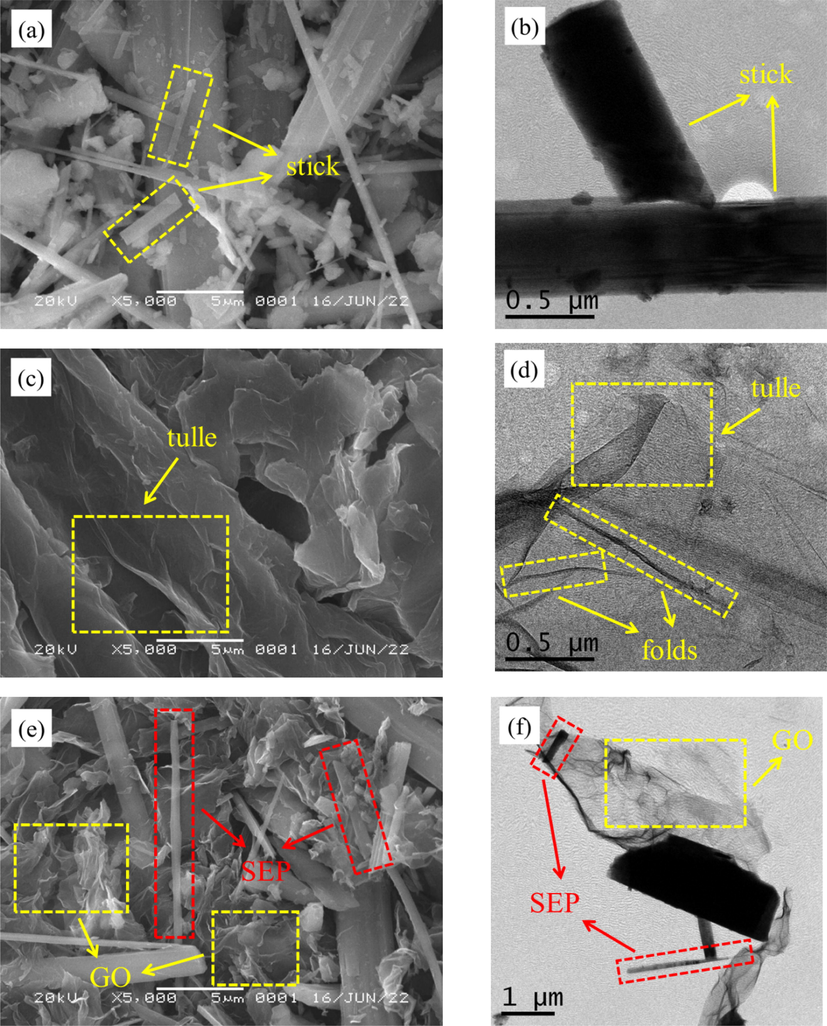
SEM(a) and TEM(b) of SEP, SEM (c) and TEM(d) of GO, SEM(e) and TEM(f) of SEP/GO.
3.1.3 XPS and AFM analysis
The types of elements contained in the material can be observed by XPS. It can be seen from Fig. 7(a) that there are O1s and C1s adsorption peaks in the XPS spectra of GO and SEP/GO, but the intensity of the peaks decreases after adsorption, and new energy peaks of Mg1s, Ca2p, and Si2p appear, which is consistent with the results described by XRD. Fig. 7(b) shows the C1s peak splitting results of GO. After peak splitting, three satellite peaks with binding energies of 284.8, 286.92, and 288.43 eV are obtained, and the corresponding chemical bonds are C—C, C—O, and O-C⚌O (Yang et al., 2009). Comparing the positions of the center fronts of SEP/GO in Fig. 7(c), the satellite front corresponding to the C—C bond changes from 284.8 eV to 284.77 eV, and the front corresponding to the O—C⚌O bond changes from 288.43 eV to 288.51 eV. It can be seen from the figure that both the intensity and position of the C1s front have changed after adsorption. The surface area ratio of C—O⚌C peak increases from 8.1 % to 11.2 %, that of C—O peak decreases from 47.4 % to 41.4 %, and that of C—C peak increases from 44.4 % to 47.4 %. The change of peak surface area ratio indicates that C—C, C—O, and O—C⚌O bonds are involved in the interaction between SEP and GO, but there is little damage to oxygen-containing functional groups, which was consistent with the results of FTIR.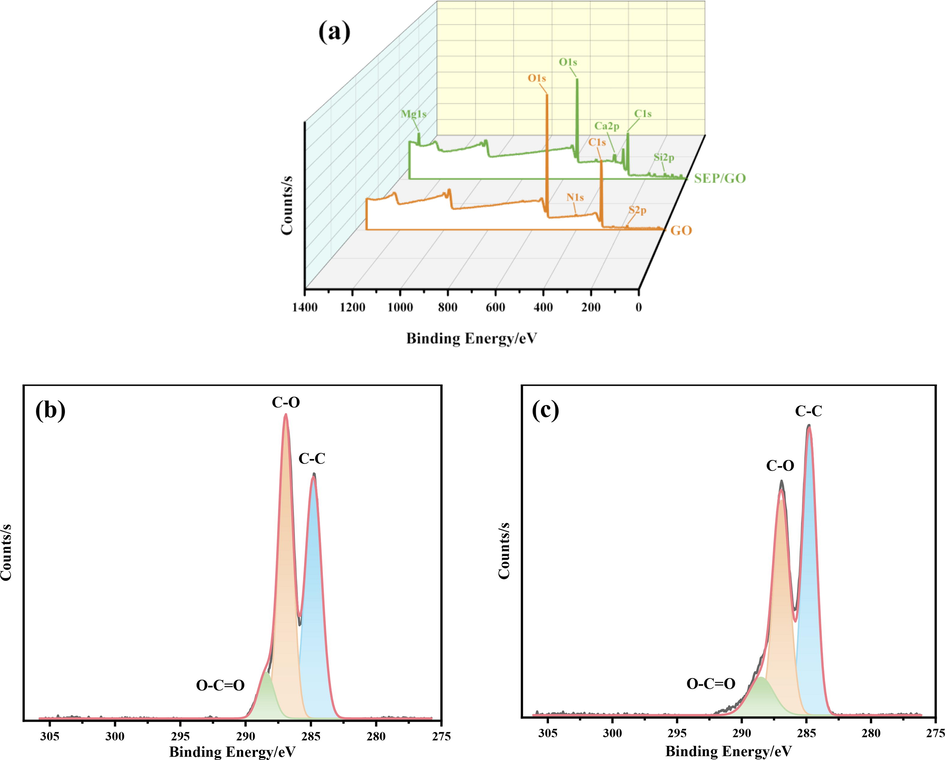
XPS spectrum of GO and SEP/GO (a), high-resolution photoelectron spectrum of C1s of GO (b) and SEP/GO (c).
AFM was used to characterize the size and thickness of the material sheets before and after adsorption. Fig. 8 and Fig. 9 show the AFM test results of GO and SEP/GO. It can be seen that the maximum thickness of GO is 1.13 nm, while that of SEP/GO is 1.69 nm. The thickness of SEP/GO is larger than that of GO. The initial GO is relatively flat, and the surface thickness increases after adsorption. This is due to the attachment of GO to the surface of the SEP, which is consistent with the results of the TEM (Fig. 6(f)), indicating that SEP can effectively remove GO in aqueous solution.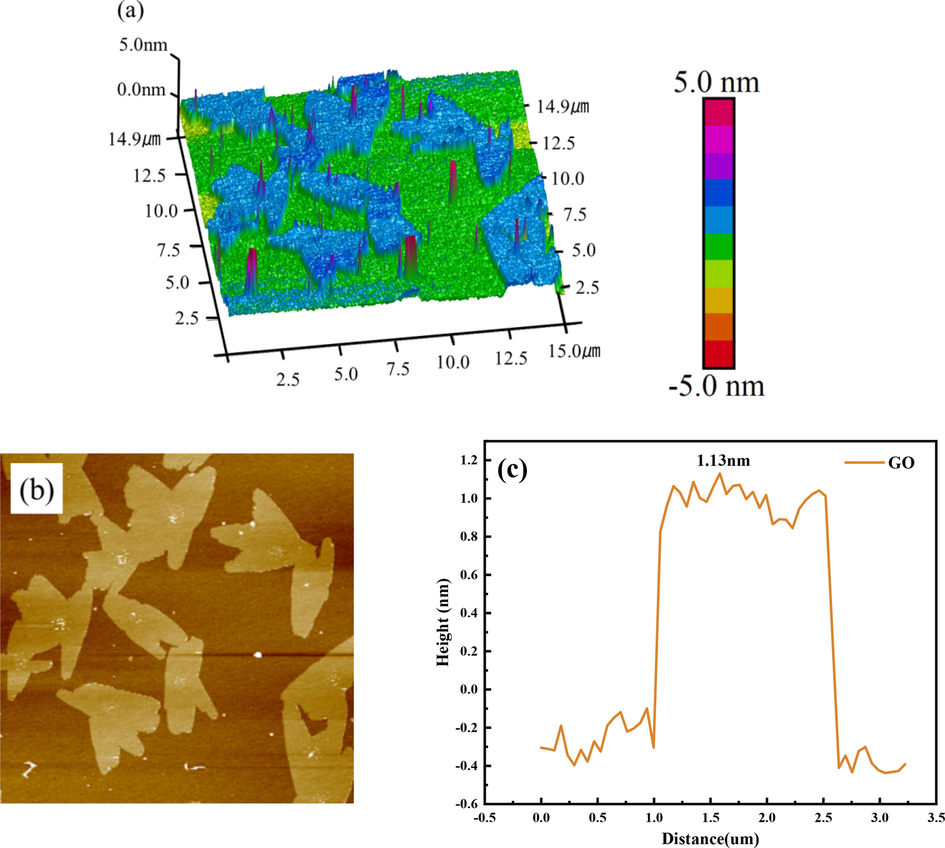
3D height topographic image (a), AFM image (b) and height profile (c) of GO.
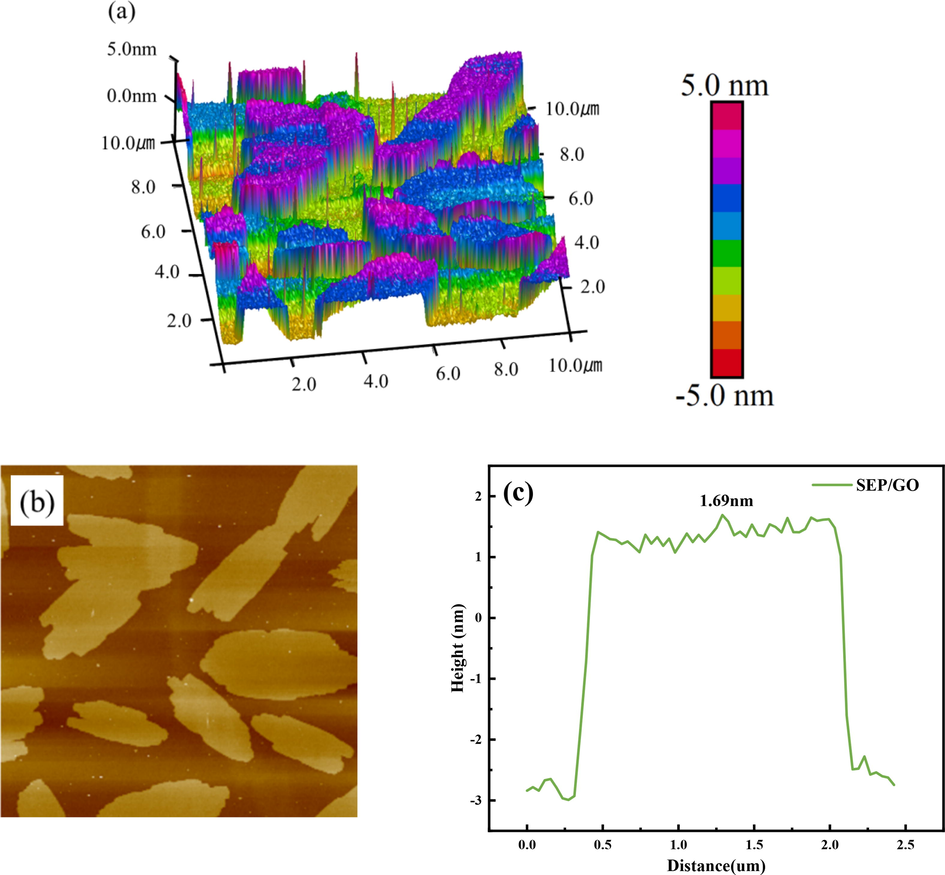
3D height topographic image (a), AFM image (b) and height profile (c) of SEP/GO.
3.2 Effect of pH
pH is one of the important parameters affecting the adsorption and ion exchange performance of clay minerals (Doğan et al., 2009). SEP naturally has good acid and alkali resistance. When it is in a medium with a pH value of < 3 or > 10, the internal structure of SEP will be corroded. When the pH value is between 3 and 10, SEP will show strong stability performance (Komadel and Madejová, 2006). The adsorption results at different pH are shown in Fig. 10. It can be seen that, with the increase in pH, the adsorption capacity Qe and adsorption rate R of SEP for GO basically show a downward trend. When pH = 3, the adsorption rate is the highest, reaching 93.1 %. The good adsorption effect under acidic conditions may be due to the following reasons: firstly, GO has strong self-cohesion under acidic conditions, and large-scale aggregation will occur (Shih et al., 2012). Secondly, the melting of Mg2+, Ca2+ and other cations in SEP weakens the bonding force between layers, makes the interlayer lattice crack, expands the interlayer spacing, and expends the micropores and voids, thus increasing the specific surface area and enhance the adsorption capacity of SEP (Huang et al., 2017). Thirdly, under acidic conditions, the positively charged adsorption sites on the adsorbent surface increase, thus improving the electrostatic attraction to the negatively charged GO solution (Badi et al., 2019). Fourth, when the pH is high, the carboxyl groups on the surface of GO act to protonate, which inhibits the binding between cations and GO (Zhao et al., 2017).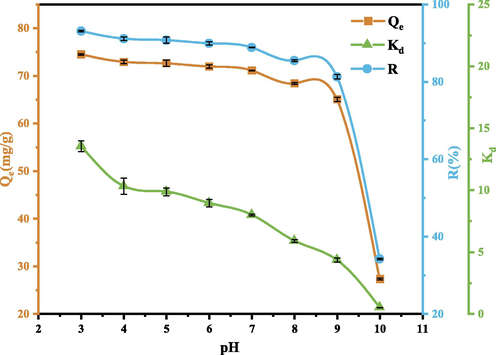
Effect of pH on GO adsorption. (Operating conditions: pH = 3,4,5,6,7,8,9,10, C0 = 80 mg/L, m = 50 mg, T = 303 K).
Considering the buffering properties of SEP, the final pH of the solution after the reaction was determined, resulting in Fig. 11. It can be seen from the figure that when the initial pH of the prepared solution is between 4 and 9, the pH after the reaction between SEP and GO is maintained between 7.73 and 8.58. This is due to the buffering properties of clay minerals (SEP), whose surface O2– and H+ form —OH. These hydroxyl groups have both acid-base characteristics and generate variable charge (Jeon and Nam, 2019), which also makes SEP have strong buffering capacity when removing GO from aqueous solution. Combining with Fig. 10, it can be seen that when the initial pH of the solution is between 4 and 9, the adsorption rate of SEP on GO is 85.1 %-91.2 %, indicating that the initial pH of the solution within this range has little effect on the adsorption of GO by SEP. In the case of pH = 3, the final pH of the solution was maintained at 7.33, and the adsorption rate reached the highest. When pH reached 10, the buffering capacity of SEP decreased and the solution was maintained at a higher pH of 9.88, which may be because the hydroxyl groups on the surface of SEP were protonated, which inhibited the progress of the adsorption reaction.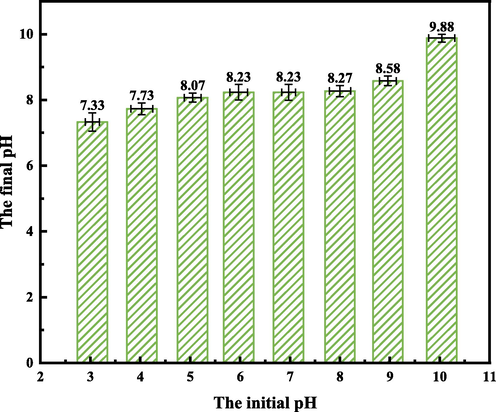
Initial pH and final pH of the solution. (Operating conditions: pH = 3,4,5,6,7,8,9,10, C0 = 80 mg/L, m = 50 mg, T = 303 K).
Zeta potential is an important parameter for the quantitative characterization of particle dispersibility and stability. The larger the absolute value is, the more stable the colloidal particles are in the sol system and the better the dispersibility is (Dembek et al., 2022). For non-metallic ore particles, acid groups are generally formed due to the existence of broken bonds on the surface, which makes the surface negatively charged (Yu et al., 2019). Fig. 12 shows the effect of different pH on the zeta potential for GO adsorption by SEP. It can be seen that the pH value directly affects the type and amount of charge on the material surface. Zeta potentials at different pH are all negative, and with the increase of pH, the hydroxyl group on the surface of SEP is protonated or deprotonated, leading to the decrease of the positive charge of SEP (Yang et al., 2016). When pH = 3, the zeta potential values of SEP/GO and GO are the largest, which are −11.9 mV and −12.7 mV respectively; when pH = 10, the zeta potential values of SEP/GO and GO are the smallest, which are −41.6 mV and −46.4 mV respectively. It shows that the solution system of SEP/GO is more active at pH = 3. However, when pH = 10, the amount of negative charge on the surface is the largest. Due to the protonation of oxygen-containing functional groups on the surface of GO at high pH, the surface of GO is also negatively charged, generating strong electrostatic repulsion with the negative charge on the surface of SEP (Jiang et al., 2022), making it difficult to aggregate, resulting in poor adsorption of GO by SEP. Therefore, the increase of pH is not conducive to GO adsorption, but it is beneficial to the adsorption under weak acidic conditions.
Zeta potential of GO and SEP/GO at different pH. (Operating conditions: pH = 3,4,5,6,7,8,9,10, C0 = 80 mg/L, m = 50 mg, T = 303 K).
3.3 Effect of adsorbent quality
The effect of adsorbent quality on GO adsorption is further studied, and the results are shown in Fig. 13. It can be seen that when the SEP quality is 30 mg, the adsorption rate is the highest, which is 94.4 %. With the increase of SEP quality, the adsorption capacity Qe decreases continuously, the adsorption rate R first increases, and then decreases when SEP quality exceeds 30 mg, and then tends to be flat. Therefore, 30 mg of SEP was selected for subsequent experiments. This is mainly because the number of effective adsorption sites of SEP increases with the increase of SEP quality, thereby improving the adsorption rate and partition coefficient. However, as the quality of the SEP increases, the number of particles per unit volume increases, which is prone to collision and agglomeration, resulting in a decrease in the number of effective active adsorption sites per unit quality of the SEP and a decrease in the specific surface area of the SEP, which ultimately leads to a decrease in the adsorption effect (Benjelloun et al., 2021a).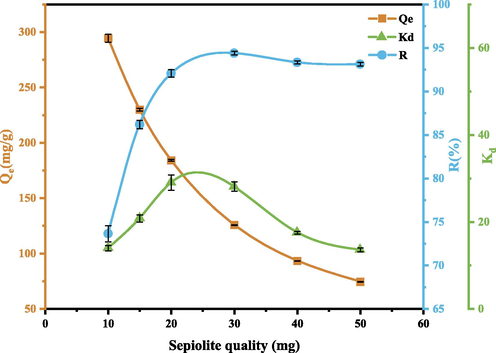
Effect of SEP quality on GO adsorption. (Operating conditions: pH = 3, C0 = 80 mg/L, m = 10,20,30,40,50 mg, T = 303 K).
3.4 Effect of GO concentration
Under conditions of SEP quality of 30 mg and pH = 3, the effect of initial GO on the adsorption capacity of SEP is explored. The results are shown in Fig. 14. It can be seen that the adsorption rate R first increases and then decreases with increasing GO concentration. The adsorption capacity Qe increases continuously. This may be because: SEP quality is constant, when GO concentration is low, SEP provides more adsorption sites and the removal rate is high; when GO concentration is too high, the particles are prone to collision and agglomeration, the adsorption sites on the surface of SEP are limited, and the adsorption process is also restricted (Zazouli et al., 2016). Then, with the increase of GO concentration, the adsorption capacity Qe increases, but the adsorption rate decreases, which may be because the increase of GO concentration inhibits the electrostatic interaction between SEP and GO (RezaeiKalantary et al., 2014). It can be seen from Fig. 14 that when GO concentration is 100 mg/L, the adsorption rate is the highest, reaching 94.8 %.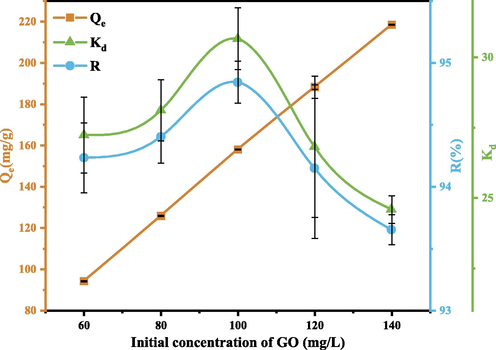
Effect of initial GO concentration. (Operating conditions: pH = 3, C0 = 60,80,100,120,140 mg/L, m = 30 mg, T = 303 K).
3.5 Adsorption kinetics
In order to explore the change of SEP adsorption GO with time, the adsorption kinetics was introduced. The adsorption kinetics characteristics were observed under the optimal conditions that the mass of adsorbent was 30 mg, pH = 3, and the initial concentration of GO was 100 mg/L. The relevant kinetic parameters were calculated according to formulas (4)–(6). The calculation results are shown in Table 5. The change of adsorption capacity with time is shown in Fig. 15.
Operating conditions
Pseudo-first-order model
Pseudo-second-order model
Elovich kinetic model
Qe
(mg/g)k1
g/(mg·min)R2
Qe
(mg/g)k2
g/(mg·min)R2
α
(mg/g·min)β
(g/mg)R2
pH = 3,
C0 = 100 mg/L,
m = 30 mg,
T = 303 K152.701
0.015
0.872
162.686
1.501 × 10⁻⁴
0.918
25.159
0.044
0.829
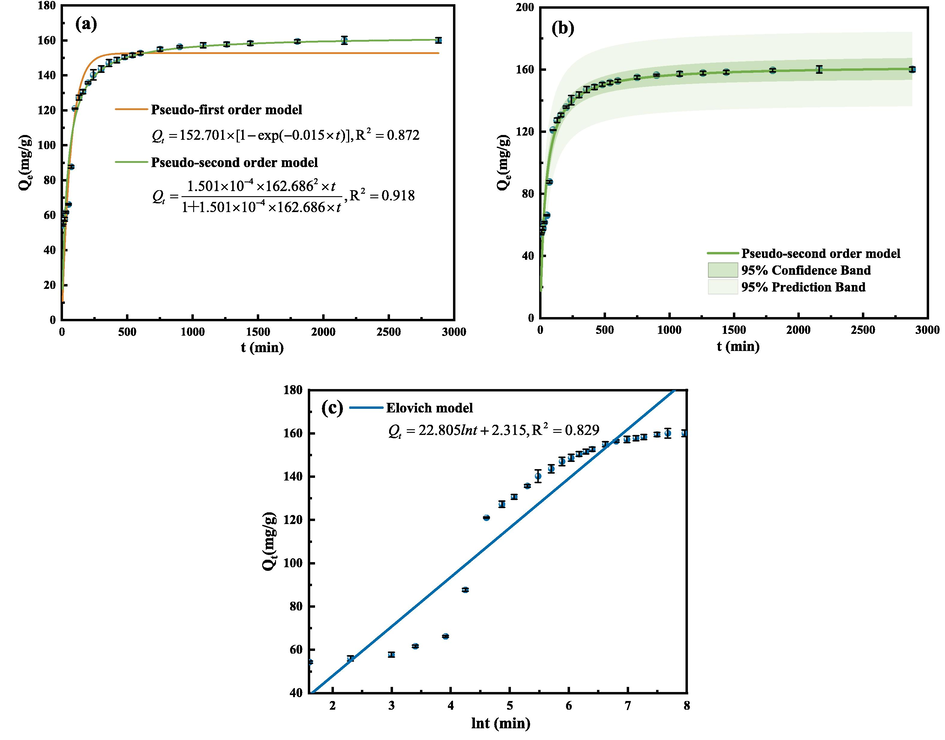
Curves of adsorption capacity changing with time and fitting curves of pseudo-first-order model and pseudo-second-order model (a), fitting curve of pseudo-second-order kinetic model (b), fitting curve of Elovich kinetic model (c). (Operating conditions: pH = 3, C0 = 100 mg/L, m = 30 mg, T = 303 K).
It can be seen from Fig. 15 that GO adsorption of GO by SEP reaches equilibrium at 2160 min. In the early stage of adsorption, the adsorption capacity increases rapidly. When the adsorption time is 100 min, the adsorption capacity increases sharply, and then slowly increases until equilibrium, which may be due to the gradual saturation of the adsorption potential on the surface of SEP. It can be seen in Table 5 that the correlation coefficient R2 fitted by the pseudo-first-order kinetic equation is 0.872, and the adsorption capacity Qe is 152.7 mg/g. The correlation coefficient R2 adapted to the pseudo-second-order kinetic equation is 0.918, and the adsorption capacity Qe is 162.7 mg/g. The R2 of the Elovich model is only 0.829. Compared with the pseudo-second-order kinetic model, the Elovich model is not suitable for describing the data obtained in this experiment. The correlation coefficient R2 of the pseudo-second-order kinetics is higher, and the adsorption capacity Qe is closer to the experimental result. Therefore, the pseudo-second-order kinetic equation can better describe the adsorption of GO by SEP, which indicates that the adsorption behavior of GO by SEP is controlled by chemical effects (Gong et al., 2008).
Considering that the pseudo-second-order kinetic model cannot identify the role of intraparticle diffusion in the adsorption process, the Intraparticle diffusion model, Boyd pseudo first model and Boyd-Ruthven-Ho model are introduced to identify whether intraparticle diffusion is the adsorption kinetics The rate-limiting step in (Eyni et al., 2019). Fig. 16 shows the fitting curves of the three models, and the relevant parameters calculated according to the formulas (7)–(9) are shown in Table 6 and Table 7: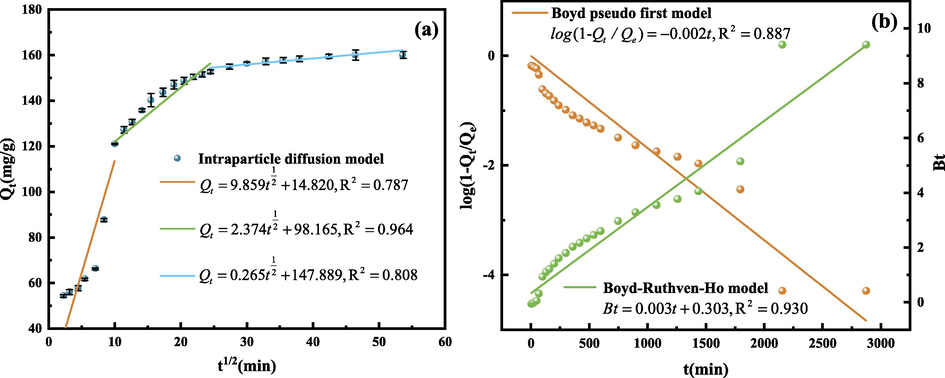
Intraparticle diffusion model fitting curve (a), Boyd pseudo first model and Boyd-Ruthven-Ho model fitting curve (b). (Operating conditions: pH = 3, C0 = 100 mg/L, m = 30 mg, T = 303 K).
Operating conditions
kd1
(mg/g·min1/2)C
(mg/g)R2
kd2
(mg/g·min1/2)C
(mg/g)R2
kd3
(mg/g·min1/2)C
(mg/g)R2
pH = 3,
C0 = 100 mg/L,
m = 30 mg,
T = 303 K9.859
14.820
0.787
2.374
98.165
0.964
0.265
147.889
0.808
Operating conditions
Boyd-Ruthven-Ho model
Boyd pseudo first model
K
C
R2
ki,B
(mg·g−1·min−0.5)R2
pH = 3, C0 = 100 mg/L, m = 30 mg, T = 303 K
0.003
0.303
0.930
0.005
0.887
Intraparticle diffusion model is divided into 3 sections. The first straight line is steeper, which is the rapid adsorption stage. At this time, there are a large number of active adsorption sites on the surface of SEP; the second section is relatively slow, which is the slow adsorption stage. The fitting degree of this stage is relatively high, and the R2 is 0.964, indicating that the adsorption rate is affected by the diffusion in the particles after entering this stage. The third stage is the adsorption equilibrium stage, which is mainly because after a long time of adsorption reaction, there are few active adsorption sites on the SEP surface, or the concentration of the residual GO solution is low, so the adsorption reaction is no longer carried out. It can also be seen from Fig. 16 that the fitting curve does not pass through the origin, indicating that internal diffusion is not the only speed limiting step (Jaafari et al., 2018).
It can be seen from Table 7 that the correlation coefficient R2 of Boyd-pseudo-first model fitting is 0.887, and the correlation coefficient R2 of Boyd-Ruthven-Ho model is 0.930, so Boyd-Ruthven-Ho model is more suitable for describing the experimental data obtained in this study. The Boyd-Ruthven-Ho model fitting curve is a straight line and the intercept is not 0, which indicates that the rate of the slow adsorption phase is not solely controlled by the intra particle diffusion, which is consistent with the fitting result of the Intraparticle diffusion model. The adsorption may be controlled by the liquid film diffusion or chemical reaction at the same time (Cáceres-Jensen et al., 2013).
3.6 Adsorption isotherm and thermodynamic analysis
At different temperatures (293, 303, 313 K) and different initial concentrations of GO (60, 80, 100, 120, 140 mg/L), the equilibrium adsorption experiment was carried out, and the adsorption effect was further observed by drawing the adsorption isotherm. The experimental results are shown in Fig. 17. It can be seen that: ① Under the same GO concentration, the adsorption capacity of SEP increases with the increase of temperature, indicating that the increase of temperature is beneficial to the adsorption, but has little effect; ② At the same temperature, the adsorption capacity of SEP increases with the increase of GO concentration; ③ The higher the concentration, the more obvious the effect of temperature on SEP adsorption of GO.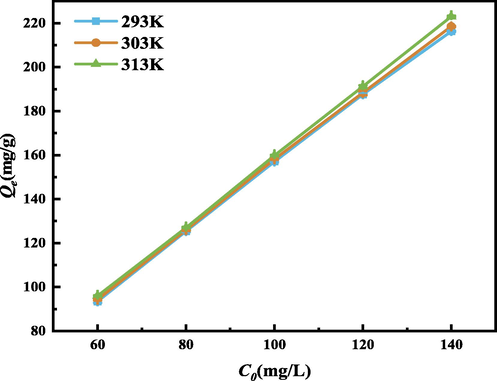
Adsorption isotherm. (Operating conditions: pH = 3, m = 30 mg, C0 = 60,80,100,120,140 mg/L, T = 293,303,313 K).
Therefore, the optimal temperature for GO adsorption by SEP is at 303 K with better adsorption effect. This is mainly because SEP loses part of free water and surface bound water when a certain temperature rises, and the adsorption resistance decreases, which is conducive to the diffusion of adsorbate molecules and improves the adsorption performance of SEP (Raya et al., 2022). The number of exposed broken bonds increases, leading to an increase in the specific surface area and an increase in activity; at the same time, it makes the molecules in GO diffuse faster from the solution to SEP (Foo and Hameed, 2013). However, adsorption at high temperature will increase the operating cost, so this study chose to conduct experiments at 303 K.
In order to further understand the adsorption mechanism, Langmuir, Freundlich and Temkin models were used to fit the adsorption process of GO by SEP, the relevant parameters were calculated according to formulas (10) ∼ (12), as shown in Table 8. The fitting curve is shown in Fig. 18.
C0
(mg/L)pH
Temperature
(K)Langmuir
Freundlich
Temkin
Qm
(mg/g)KL
(L/mg)R2
KF
(mg/g)n
R2
KT
(L/mg)C
R2
100
3
293 K
572.760
0.061
0.953
43.086
1.422
0.937
0.467
122.837
0.977
303 K
813.261
0.042
0.958
38.306
1.242
0.948
0.486
132.355
0.982
313 K
1440.754
0.030
0.998
44.179
1.122
0.997
0.731
137.833
0.916
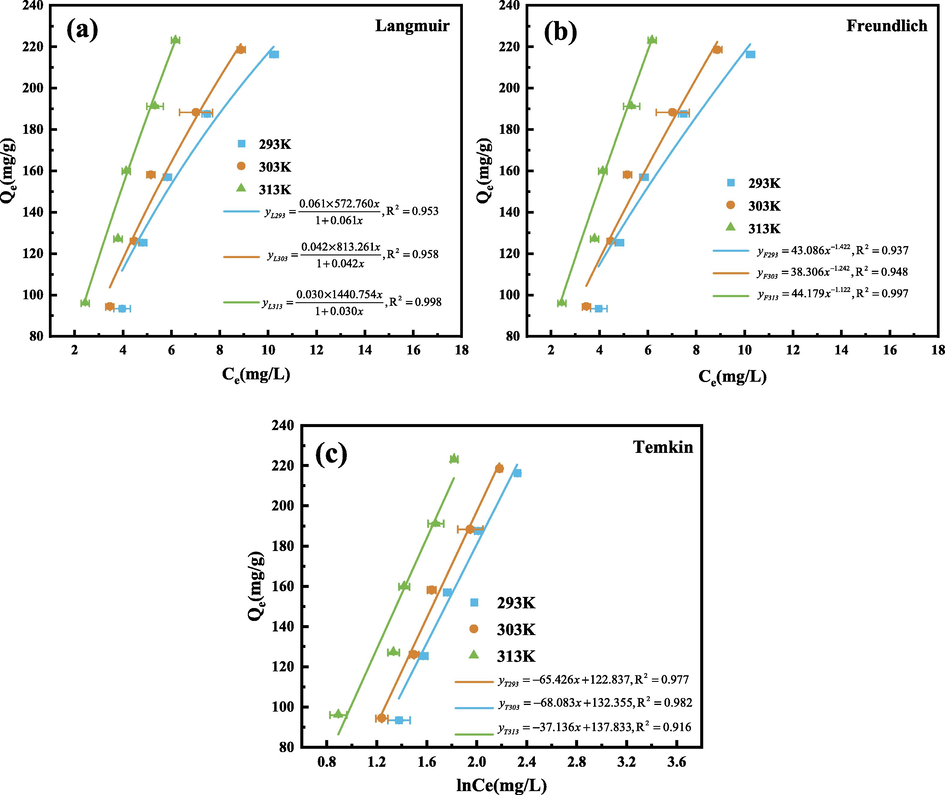
Langmuir isothermal model fitting curve (a), Freundlich isothermal model fitting curve (b), Temkin isothermal model fitting curve (c). (Operating conditions: pH = 3, m = 30 mg, C0 = 60,80,100,120,140 mg/L, T = 293,303,313 K).
It can be seen from Table 8 that the correlation coefficient R2 of Langmuir model is higher than that of Freundlich model, so Langmuir model can better describe the adsorption of GO by SEP, and the adsorption process is mainly uniform monolayer adsorption (Sari et al., 2009), which is consistent with the SEM results. Compared with the Freundlich model, the Temkin model is more suitable for describing the adsorption of the studied adsorbent. It assumes that the decrease of the heat of adsorption is linear, and the C in the table are all positive values, indicating that the adsorption process is endothermic in nature (Hameed et al., 2008).The maximum adsorption capacity Qmax in the Langmuir model increases with increasing temperature, indicating that the increase of temperature has a certain promotion effect on the adsorption effect. In Freundlich model, it is generally considered that n > 1, which means that the adsorption is easy to carry out. It can be seen from the table that n is>1, indicating that the adsorption is a favorable preferential adsorption (Dwivedi et al., 2008).
In order to further describe the relationship between adsorption and temperature, according to the experimental data of adsorption at different temperatures, formulas (13) to (15) are substituted. Relevant thermodynamic parameters can be calculated as shown in Table 9, and the linear relationship between lnkd and 1/T was obtained as shown in Fig. 19.
C0 (mg/L)
ΔG (kJ/mol)
ΔH (kJ/mol)
ΔS (J•mol−1 •K−1)
293 K
303 K
313 K
60
−7.693
−8.326
−9.554
22.432
101.911
80
−7.939
−8.404
−9.132
10.048
61.145
100
−8.02
−8.624
−9.507
14.534
76.685
120
−7.849
−8.286
−9.317
14.234
75.138
140
−7.43
−8.067
−9.335
20.615
95.226
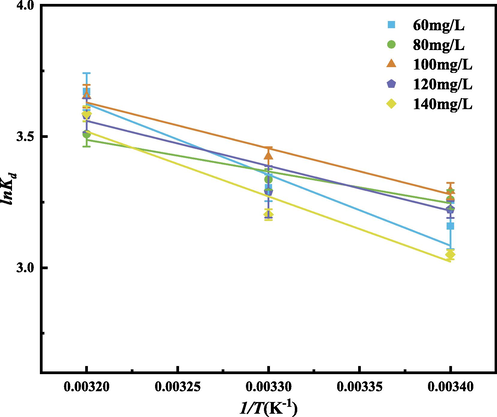
Relationship between lnKd and 1/T. (Operating conditions: pH = 3, m = 30 mg, C0 = 60,80,100,120,140 mg/L, T = 293,303,313 K).
It can be seen from Table 9 that the ΔG values at different temperatures are all negative values. With the same concentration, the absolute value of ΔG increases with the increase of temperature, which indicates that the adsorption reaction is a spontaneous reaction. With the increase of temperature, the reaction is more likely to proceed spontaneously. Under different concentrations, ΔH is all positive, indicating that the adsorption reaction is an endothermic process (Heshmati et al., 2014). The higher the temperature is, the more favorable the adsorption is, which is consistent with the fitting results of the Temkin model. ΔS > 0 indicates that the disorder of the solid–liquid interface increases after adsorption (Mata et al., 2009), the system becomes more disordered, and the process is generally realized as an increase process (Xu et al., 2022).
4 Conclusion and foresight
4.1 Conclusion
In this study, the factors affecting the performance of SEP adsorption on GO were investigated, and the data were analyzed. Combining microscopic experiments to characterize the samples before and after adsorption, the adsorption mechanism was deeply explored. The following conclusions can be drawn:
The adsorption capacity of SEP for GO was studied by changing the pH, adsorbent quality, initial GO concentration, and temperature. It can be found that SEP has the best adsorption performance for GO under the condition of 30℃, pH = 3, 30 mg of SEP quality and 100 mg/L of GO concentration, the adsorption rate R is 94.8 %. The increase in temperature is helpful to improve the adsorption effect. The higher the concentration is, the more obvious the effect of temperature on GO adsorption is.
Comparing the fitting parameters of the pseudo-first-order, pseudo-second-order kinetic models and the Elovich kinetic model, it can be seen that the adsorption of SEP on GO is more in line with the pseudo-second-order kinetic fitting equation. The adsorption process is controlled by chemical action, and the adsorption capacity increases rapidly with the increase of time at 0 ∼ 100 min, and reaches equilibrium at 2160 min. According to the Intraparticle diffusion model and Boyd-Ruthven-Ho model, the rate in the slow adsorption stage is jointly controlled by the intraparticle diffusion and liquid film diffusion.
By comparing the parameters of Langmuir, Freundlich and Temkin isothermal models, it can be seen that the adsorption of GO by SEP is more consistent with the Langmuir and Temkin isothermal models, and the adsorption process is mainly monolayer adsorption and endothermic. From the perspective of thermodynamic parameters, the adsorption of SEP to GO is a spontaneous, endothermic and entropy-increasing process.
Through microscopic experiments, it can be known that the adsorbed GO aggregates and stacks on the surface of SEP, and GO adheres to the surface of SEP. From FTIR, it can be known that the adsorption process is accompanied by the vibration deformation of chemical bonds and the interaction of functional groups. The XPS results further indicated that the adsorption of GO by SEP is mainly due to the coordination reaction of Mg2+ and Ca2+ dissolved in the solution with O-C⚌O.
In summary, SEP is a material that can effectively adsorb GO in aqueous solution with a strong adsorption capacity. Through experiments, the adsorption performance of SEP is deeply understood, which provides a reference for the removal of GO in aqueous solution, and helps to improve the ecosystem and promote sustainable development.
4.2 Foresight
Table 10 summarizes other relevant research results for comparison with this study. Due to the lack of theoretical knowledge and the limitation of experimental conditions, the following research can be carried out in the future:
The changes in the adsorption performance of SEP for heavy metal ions under different pH, solution concentration, adsorbent quality and temperature can be further explored.
Comparing the adsorption of GO by SEP with other materials, especially with the adsorption properties on different types of clay minerals, it is helpful to deepen the understanding of the adsorption of GO by materials.
| Adsorbents | Adsorbate | Isotherm | Kinetic model | pH | Adsorbent quality (mg) | Adsorbate concentration (mg/L) | Adsorption capacity (mg/g) | Optimal removal rate (%) | Reference |
|---|---|---|---|---|---|---|---|---|---|
| Illite | Graphene Oxide | Langmuir | Pseudo-Second-Order Model | 3 | 150 | 80 | – | 93.80 % | (Li et al., 2022c) |
| Red Sandstone | Graphene Oxide | Langmuir | Pseudo-Second-Order Model | 4 | 40 | 80 | 90 | 89.08 % | (Li et al., 2022a) |
| Layered Double Hydroxide | Graphene Oxide | – | – | 3 | 10 | 160 | 1472 | 92.00 % | (Kang et al., 2021) |
| Iron tailings | Graphene Oxide | Langmuir | Pseudo-First-Order Model | 7 | 50 | 60 | 51.55 | – | (Zhou et al., 2021a) |
| Graphene Oxide | 2,4-Dichlorophenol | Langmuir | Pseudo-Second-Order Model | 5 | 750 | 10 | 84.74 | 100 % | (Azari et al., 2017) |
| chitosan | methyl orange | Langmuir | Pseudo-Second-Order Model | 1.0–9.1 (pH has little effect) | 180 | 100 | 89.3 | – | (Huang et al., 2017) |
| Sepiolite | Acid Orange II | Langmuir | Pseudo-Second-Order Model | 1 | 200 | 200 | 110.05 | – | (Yu et al., 2020) |
| Sepiolite | Graphene Oxide | Langmuir | Pseudo-Second-Order Model | 3 | 30 | 100 | 158.073 | 94.80 % | This study |
Acknowledgment
This research was funded by the National Natural Science Foundation of China (Grant No.52179107).
Declaration of Competing Interest
The authors declare that they have no known competing financial interests or personal relationships that could have appeared to influence the work reported in this paper.
References
- An experimental and theoretical investigation of cationic azine dye adsorption on natural sepiolite in single and multi-component systems. Chem. Eng. Res. Des.. 2022;187:507-515.
- [CrossRef] [Google Scholar]
- Adsorption of dyes using different types of clay: a review. Appl Water Sci. 2017;7:543-568.
- [CrossRef] [Google Scholar]
- Efficiency of magnitized graphene oxide nanoparticles in removal of 2, 4-dichlorophenol from aqueous solution. J. Mazandaran Univ. Medical Sci.. 2017;26:265-281.
- [Google Scholar]
- Magnetic multi-walled carbon nanotubes-loaded alginate for treatment of industrial dye manufacturing effluent: adsorption modelling and process optimisation by central composite face-central design. Int. J. Environ. Anal. Chem.. 2021;1–21
- [CrossRef] [Google Scholar]
- Degradation of dimethyl phthalate using persulfate activated by UV and ferrous ions: optimizing operational parameters mechanism and pathway. J. Environ. Health Sci. Eng.. 2019;17:685-700.
- [CrossRef] [Google Scholar]
- Nafion®–sepiolite composite membranes for improved proton exchange membrane fuel cell performance. J. Membr. Sci.. 2013;430:167-179.
- [CrossRef] [Google Scholar]
- Recent advances in adsorption kinetic models: their application to dye types. Arab. J. Chem.. 2021;14:103031
- [CrossRef] [Google Scholar]
- Recent advances in adsorption kinetic models: their application to dye types. Arab. J. Chem.. 2021;14:103031
- [CrossRef] [Google Scholar]
- Graphene oxide concentration effect on the optoelectronic properties of ZnO/GO nanocomposites. Nanomaterials. 2020;10
- [CrossRef] [Google Scholar]
- Sorption kinetics of diuron on volcanic ash derived soils. J. Hazard. Mater.. 2013;261:602-613.
- [CrossRef] [Google Scholar]
- Aggregation and stability of reduced graphene oxide: complex roles of divalent cations, pH, and natural organic matter. Environ. Sci. Technol.: ES&T.. 2015;49:10886-10893.
- [CrossRef] [Google Scholar]
- Preparation of carbonaceous materials from pyrolysis of chicken bones and its application for fuchsine adsorption. Environ. Sci. Pollut. Res.. 2019;26:28574-28583.
- [CrossRef] [Google Scholar]
- Solvent Influence on Zeta Potential of Stationary Phase—Mobile Phase Interface. Molecules. 2022;27
- [CrossRef] [Google Scholar]
- Structure-process-property relationship of the polar graphene oxide-mediated cellular response and stimulated growth of osteoblasts on hybrid chitosan network structure nanocomposite scaffolds. Acta Biomater.. 2011;7:3432-3445.
- [CrossRef] [Google Scholar]
- Adsorption of copper (II) ions onto sepiolite and electrokinetic properties. Desalination. 2009;238:257-270.
- [CrossRef] [Google Scholar]
- Column performance of granular activated carbon packed bed for Pb(II) removal. J. Hazard. Mater.. 2008;156:596-603.
- [CrossRef] [Google Scholar]
- Kinetics, equilibrium and isotherms of Pb2+ adsorption from aqueous solutions on carbon nanotubes functionalized with 3-amino-5a, 10a-dihydroxybenzo [b] indeno [2, ld] furan-10-one. New Carbon Mater.. 2019;34:512-523.
- [CrossRef] [Google Scholar]
- Equilibrium and kinetic studies in adsorption of heavy metals using biosorbent: a summary of recent studies. J. Hazard. Mater.. 2009;162:616-645.
- [CrossRef] [Google Scholar]
- Utilization of oil palm biodiesel solid residue as renewable sources for preparation of granular activated carbon by microwave induced KOH activation. Bioresour. Technol.. 2013;130:696-702.
- [CrossRef] [Google Scholar]
- Adsorption Properties of Sepiolite in Relation to Uranium and Lanthanide Ions. Minerals.. 2019;9
- [CrossRef] [Google Scholar]
- Adsorption behavior of cationic dyes on citric acid esterifying wheat straw: kinetic and thermodynamic profile. Desalination. 2008;230:220-228.
- [CrossRef] [Google Scholar]
- Adsorption isotherm, kinetic modeling and mechanism of 2, 4, 6-trichlorophenol on coconut husk-based activated carbon. Chem. Eng. J.. 2008;144:235-244.
- [CrossRef] [Google Scholar]
- Toxicity effect of graphene oxide on growth and photosynthetic pigment of the marine alga Picochlorum sp during different growth stages. Environ. Sci. Pollut. Res.. 2017;24:4144-4152.
- [CrossRef] [Google Scholar]
- Adsorptive removal of Thorium(IV) from aqueous solutions using synthesized polyamidoxime chelating resin: equilibrium, kinetic, and thermodynamic studies. J. Dispers. Sci. Technol.. 2014;35:501-509.
- [CrossRef] [Google Scholar]
- Thermal behavior of a natural sepiolite from Northeastern Iran. J. Sci., Islamic Republic of Iran.. 2013;24:129-134.
- [CrossRef] [Google Scholar]
- Removal of Cd2+, Cu2+, Pb2+, Ni2+ in aqueous solution by thermally treated sepiolite. J. Korean Soc. Environ. Eng.. 2019;41:372-380.
- [CrossRef] [Google Scholar]
- Surface force arising from Adsorbed graphene oxide in kaolinite suspensions. Colloids and Surf. A-Physicochem. Eng. Aspects. 2020;592
- [CrossRef] [Google Scholar]
- Adsorption of methyl orange onto protonated cross-linked chitosan. Arab. J. Chem.. 2017;10:24-32.
- [CrossRef] [Google Scholar]
- Adsorption of p-Cresol on Al2O3 coated multi-walled carbon nanotubes: response surface methodology and isotherm study. J. Ind. Eng. Chem.. 2018;57:396-404.
- [CrossRef] [Google Scholar]
- Change in the site density and surface acidity of clay minerals by acid or alkali spills and its effect on pH buffering capacity. Sci. Rep.. 2019;9:1-10.
- [CrossRef] [Google Scholar]
- Nanotoxicity of different sizes of graphene (G) and graphene oxide (GO) in vitro and in vivo. Environ. Pollut.. 2019;247:595-606.
- [CrossRef] [Google Scholar]
- Performance and mechanisms of fly ash for graphene oxide removal from aqueous solution. Environ. Sci. Pollut. Res.. 2022;29:3773-3783.
- [CrossRef] [Google Scholar]
- Performance and mechanism of layered double hydroxide to remove graphene oxide in aqueous solution. Nat. Environ. Pollut. Technol.. 2021;20
- [CrossRef] [Google Scholar]
- Highly efficient scavenging of Ni (II) by porous hexagonal boron nitride: kinetics, thermodynamics and mechanism aspects. Appl. Surf. Sci.. 2020;521:146373
- [CrossRef] [Google Scholar]
- Study on the adsorption performance and adsorption mechanism of graphene oxide by red sandstone in aqueous solution. Adsorpt. Sci. Technol.. 2022;2022
- [CrossRef] [Google Scholar]
- Adsorption properties and mechanism of Attapulgite to graphene oxide in aqueous solution. Int. J. Environ. Res. Public Health. 2022;19
- [CrossRef] [Google Scholar]
- Effects of graphene oxide aggregates on hydration degree, sorptivity, and tensile splitting strength of cement paste. Compos. Part A-Appl. Sci. Manuf.. 2017;100:1-8.
- [CrossRef] [Google Scholar]
- Performance and mechanism of illite in removing graphene oxide from aqueous solution. Appl. Clay Sci.. 2022;230:106711
- [CrossRef] [Google Scholar]
- Two-year stability of immobilization effect of sepiolite on Cd contaminants in paddy soil. Environ. Sci. Pollut. Res.. 2016;23:12922-12931.
- [CrossRef] [Google Scholar]
- Catalytic behavior of graphene oxide for cement hydration process. J. Phys. Chem. Solid. 2016;89:128-133.
- [CrossRef] [Google Scholar]
- Sorption of U (VI) on magnetic sepiolite investigated by batch and XANES techniques. J. Radioanal. Nucl. Chem.. 2017;314:1825-1832.
- [CrossRef] [Google Scholar]
- Enhanced atrazine adsorption from aqueous solution using chitosan-modified sepiolite. J. Cent. South Univ.. 2015;22:4168-4176.
- [CrossRef] [Google Scholar]
- Antibacterial activity of graphite, graphite oxide, graphene oxide, and reduced graphene oxide: membrane and oxidative stress. ACS Nano. 2011;5:6971-6980.
- [CrossRef] [Google Scholar]
- Magnetic Fe3O4/attapulgite hybrids for Cd(II) adsorption: performance, mechanism and recovery. J. Hazard. Mater.. 2021;412
- [CrossRef] [Google Scholar]
- Study on the adsorption mechanism of graphene oxide by Calcareous Sand in South China Sea. Adsorpt. Sci. Technol.. 2021;2021
- [CrossRef] [Google Scholar]
- Preparation of polypropylene/sepiolite nanocomposites using supercritical CO2 assisted mixing. Eur. Polym. J.. 2007;43:4931-4939.
- [CrossRef] [Google Scholar]
- Gold(III) biosorption and bioreduction with the brown alga Fucus vesiculosus. J. Hazard. Mater.. 2009;166:612-618.
- [CrossRef] [Google Scholar]
- Mechanical properties and microstructure of a graphene oxide-cement composite. Cem. Concr. Compos.. 2015;58:140-147.
- [CrossRef] [Google Scholar]
- Investigation of solution chemistry effects on sorption behavior of Sr(II) on sepiolite fibers. J. Mol. Liq.. 2013;180:244-251.
- [CrossRef] [Google Scholar]
- Kinetic, isotherm, and thermodynamic studies on Cr (VI) adsorption using cellulose acetate/graphene oxide composite nanofibers. Appl. Phys. A. 2022;128:1-9.
- [CrossRef] [Google Scholar]
- Adsorption and magnetic separation of lead from synthetic wastewater using carbon/iron oxide nanoparticles composite. J. Mazandaran Univ. Medical Sci.. 2014;24:172-183.
- [Google Scholar]
- Interaction of Pyridine Derivatives with Sepiolite. J. Colloid Interface Sci.. 2002;251:33-38.
- [CrossRef] [Google Scholar]
- Biosorption of palladium(II) from aqueous solution by moss (Racomitrium lanuginosum) biomass: Equilibrium, kinetic and thermodynamic studies. J. Hazard. Mater.. 2009;162:874-879.
- [CrossRef] [Google Scholar]
- Nanotoxicity of graphene and graphene oxide. Chem. Res. Toxicol.. 2014;27:159-168.
- [CrossRef] [Google Scholar]
- Understanding the pH-dependent behavior of graphene oxide aqueous solutions: a comparative experimental and molecular dynamics simulation study. Langmuir. 2012;28:235-241.
- [CrossRef] [Google Scholar]
- Thermo gravimetric analysis and FTIR analysis of electrochemically synthesized Graphene Oxide (GO)/reduced Graphene Oxide (rGO) IOP Conf. Ser.: Mater. Sci. Eng.. 2021;1116:012003
- [CrossRef] [Google Scholar]
- Characterization of bio regenerated cellulose/sepiolite nanocomposite films prepared via ionic liquid. Polym. Test.. 2014;33:121-130.
- [CrossRef] [Google Scholar]
- Software survey: VOSviewer, a computer program for bibliometric mapping. Scientometrics. 2010;84:523-538.
- [CrossRef] [Google Scholar]
- Amino-functionalized Fe3O4@SiO2 core–shell magnetic nanomaterial as a novel adsorbent for aqueous heavy metals removal. J. Colloid Interface Sci.. 2010;349:293-299.
- [CrossRef] [Google Scholar]
- Transport of sulfide-reduced graphene oxide in saturated quartz sand: cation-dependent retention mechanisms. Environ. Sci. Tech.. 2015;49:11468-11475.
- [CrossRef] [Google Scholar]
- Adsorption of cadmium (II) in wastewater by magnesium oxide modified biochar. Arab. J. Chem.. 2022;15:104059
- [CrossRef] [Google Scholar]
- Effect of microbes on Ni(II) diffusion onto sepiolite. J. Mol. Liq.. 2015;204:170-175.
- [CrossRef] [Google Scholar]
- Enhanced removal of bisphenol A from aqueous solution by organo-montmorillonites modified with novel Gemini pyridinium surfactants containing long alkyl chain. Chem. Eng. J.. 2016;285:27-38.
- [CrossRef] [Google Scholar]
- Chemical analysis of graphene oxide films after heat and chemical treatments by X-ray photoelectron and Micro-Raman spectroscopy. Carbon. 2009;47:145-152.
- [CrossRef] [Google Scholar]
- Application of modified sepiolite as reusable adsorbent for Pd (II) sorption from acidic solutions. Trans. Nonferrous Metals Soc. China.. 2020;30:1375-1386.
- [CrossRef] [Google Scholar]
- Adsorption of Acid Orange Ⅱ with two step modified sepiolite: optimization, adsorption performance, kinetics, thermodynamics and regeneration. Int. J. Environ. Res. Public Health. 2020;17:1732.
- [CrossRef] [Google Scholar]
- Adsorption performance of copper ions on arsenopyrite surfaces and implications for flotation. Appl. Surf. Sci.. 2019;488:185-193.
- [CrossRef] [Google Scholar]
- Adsorption of methylene blue from aqueous solution onto activated carbons developed from eucalyptus bark and Crataegus oxyacantha core. Water Sci. Technol.. 2016;74:2021-2035.
- [CrossRef] [Google Scholar]
- Preparation and Application of Carboxylated Graphene Oxide Sponge in Dye Removal. Int. J. Environ. Res. Public Health. 2017;14
- [CrossRef] [Google Scholar]
- Study on the adsorption properties of iron tailings for GO. Coatings. 2021;11:768.
- [CrossRef] [Google Scholar]
- Study on the Adsorption Properties of Iron Tailings for GO. Coatings. 2021;11
- [CrossRef] [Google Scholar]
- Cadmium adsorption by thermal-activated sepiolite: application to in-situ remediation of artificially contaminated soil. J. Hazard. Mater.. 2022;423:127104
- [CrossRef] [Google Scholar]


