

Translate this page into:
Adsorption studies of Cd(II) on ball clay: Comparison with other natural clays
⁎Corresponding author. Tel.: +91 0571 2703167x3000. rakrao1@rediffmail.com (Rifaqat Ali Khan Rao),
-
Received: ,
Accepted: ,
This article was originally published by Elsevier and was migrated to Scientific Scholar after the change of Publisher.
Peer review under responsibility of King Saud University.
Abstract
Ball clay was found to exhibit excellent adsorption capacity toward Cd(II) ions over a wide concentration range. The adsorption capacity was studied by heating it at different temperatures. It was found that the sample heated at 200 °C showed maximum adsorption capacity toward Cd(II) ions. This research was focused on the effect of pH, time, temperature, adsorbent doses and initial Cd(II) concentration by batch experiments. The equilibrium data of Cd(II) adsorption were explained well by Langmuir and Freundlich adsorption isotherms. The kinetics data for the adsorption process obeyed pseudo-first-order and pseudo-second-order models at lower initial concentrations of Cd(II) while with the increased concentration of Cd(II) pseudo-first-order model failed. The Cd(II) desorption was performed using batch process with various desorbing solutions and 100% desorption was achieved with HCl solution.
Keywords
Adsorption
Cadmium
Desorption
Kinetics
Point of zero charge

1 Introduction
Some heavy metals are essential to life and play irreplaceable roles in the human metabolic system, for example, the functioning of critical enzyme sites. Other metals are xenobiotics, i.e. they have no useful role in human physiology (and most other living organisms) and may be toxic even at trace levels of exposure. Heavy metals enter into the environment through human activities and some natural phenomena (Abollino et al., 2003). Among these contaminants, cadmium is an important metal which is used in batteries predominantly in rechargeable nickel–cadmium batteries, and it also finds use in the preparation of alloys, due to its low coefficient of friction and a very good fatigue resistance (Scoullos et al., 2001). Cadmium containing ores are rare to find, however, traces do naturally occur in the phosphate form and they are transmitted to food through the use of fertilizers, which contain cadmium in the form of cadmium phosphate (Jiao et al., 2004). It was until after World War (I) that cadmium came into wide use, rich deposits of cadmium can be found in the Vilyui River basin in Siberia (Fleischer, 1980). Cadmium is a very toxic metal, and cadmium containing compounds are known as carcinogens which can induce many types of cancers (11th Report on Carcinogens, 2008). Acute high dose exposure can cause severe respiratory irritation. Occupational levels of cadmium exposure are a risk factor for chronic lung disease and testicular degeneration (Benoff et al., 2000). Cadmium also damages a specific structure of the functional unit of the kidney (Satarug et al., 2000). The WHO allowable limit for Cd(II) in drinking water is 0.005 mg L−1 (Mohan et al., 2006). Adsorption is the most recent technology for the removal of heavy metals particularly if present at very low concentrations in water and wastewater because it is cheap and more effective than other techniques. Adsorption on activated carbon has been a well known process during the last few decades for the removal of heavy metals but it is costly and difficult to regenerate. Therefore there is a need to develop new and low cost materials which can adsorb inorganic and organic pollutants. Recently the removal of various hazardous dyes from wastewater using different adsorbents has been successfully studied (Mittal, 2006a,b; Gupta et al., 2006; Mittal and Gupta, 2010; Mittal et al., 2010a,b,c; Mittal et al., 2009a,b,c; Gupta et al., 2009; Mittal et al., 2008a,b; Mittal et al., 2006). Clay, a natural earthy material composed of very small particles of weathered rock is a matter of attention to adsorb traces of heavy metal ions. Clay is composed primarily of fine grained minerals which show plasticity through a variable range of water content and which can be hardened when dried. Organic materials which do not imply plasticity may also be part of clay deposits (Guggenheim and Martin, 1995). Clay is being use in pottery, ceramics making and in children’s toys. Recent studies have investigated clay's adsorption capacities in various applications such as the removal of heavy metals from wastewater and air purification. Knowledge of the nature of clay was well understood in the 1930s with advancements in X-ray diffraction technology which is necessary to analyze and examine the molecular nature of the particles of clay (Bailey, 1980). Clay can be classified according to its general composition and properties. Kaolin is fine white clay; ball clay contains kaolinite and has strong bonding properties.
Ball clay is a variety of kaolinite and has high plasticity and less refractoriness and thus is also known as plastic clay. The wide use of ball clay is mainly due to its contribution of workability and the strength it provides to the bodies in drying. Ball clay is sedimentary in origin and is used in agriculture, horticulture and many amenity industries. It is also used as extenders in insecticides, polymers, adhesives etc. Ball clay is a vital and indispensable material in ceramics as many ceramic products contain ball clay.
In the present study we have explored and compared its adsorption properties with other clay materials.
2 Materials and methods
2.1 Adsorbent solution
Stock solution of cadmium (100 mg L−1) was prepared by dissolving the desired quantity of Cd(NO3)2·H2O (A.R. grade) in double distilled water (DDW).
2.2 Adsorbent
Ball clay was purchased from Asian chemicals (INDIA). The clay was washed several times with DDW to remove dust and other adhering particles. It was crushed and sieved to obtain 100–150 μm particle size for adsorption studies.
2.3 Instrumentation
A pH meter (ELICO-LI 120, India) was used to measure pH. Heavy metal determination was performed using Atomic Absorption Spectrophotometer (GBC-902, Australia). EDX and SEM were recorded using (Ametek, USA) instrument. A water bath incubator shaker (Narang Scientific Work-CE 0434, India) was used in the isotherm study.
2.4 Effect of temperature
Ball clay was heated in a furnace at 200, 400, 600, 800 and 1000 °C for 1 h in a silica crucible. After heating, the material was cooled at room temperature, crushed again and used as such for adsorption studies.
2.5 Adsorption studies
Adsorption of Cd(II) on ball clay was carried out by batch process. 0.5 g of adsorbent was treated with 50 mL solution of desired concentration in a 250 mL conical flask for specified time period at room temperature (30 °C). Residual metal concentration in the supernatant liquid was then determined by Atomic Absorption Spectrophotometric analysis (model GBC 902, Australia). The effect of time on the adsorption of Cd(II) was determined by analyzing the residual metal ions in the liquid after contact periods of 2,3,5,10,15,20,30,60,120 and 180 min. Effect of adsorbent dose was studied by varying adsorbent amount from 0.1 to 1.0 g at fixed concentration (50 mg L−1) of Cd(II) and fixed volume (50 mL) at different temperatures.
2.6 Effect of pH
The effect of pH on the adsorption of Cd(II) was studied as follows: 50 mL of Cd(II) solution was taken in a beaker and the pH of the solution was adjusted by adding 0.1 M HCl or 0.1 M NaOH solution using pH meter. The solution was taken in conical flak, treated with 0.5 g of the adsorbent and after the attainment of equilibrium the final concentration of Cd(II) was determined. The % adsorption was then calculated by subtracting final concentration from initial concentration. In order to investigate the effect of electrolyte, 50 mL Cd(II) solution containing the desired concentration of electrolyte (NaNO3) was taken in a conical flask and its pH was adjusted as described above. The solution was then treated with 0.5 g adsorbent and % adsorption of Cd(II) was then determined as described above. The final or equilibrium pH was also recorded.
2.7 Point of zero charge
The point of zero charge (pHpzc) was determined by solid addition method (Lataye et al., 2006). 40 mL of 0.1 M NaNO3 solution was transferred to a series of 100 mL conical flasks and the initial pH (pHi) of the solutions was roughly adjusted between 2 and 8 by adding either 0.1 M HCl or 0.1 M NaOH. The total volume of the solution in each flask was adjusted exactly to 50 mL by adding NaNO3 of the same strength and the initial pH (pHi) of the solutions was then accurately noted with the help of pH meter. Later 0.5 g of adsorbent was then added to each flask and allowed to equilibrate for 24 h with intermittent manual shaking and the final pH (pHf) of the supernatant liquid was noted. The difference between the initial pH (pHi) and final pH (pHf) values (ΔpH = pHi–pHf) were plotted against pHi, the point of intersection of the resulting curve with abscissa, at which ΔpH = 0, gave the pHpzc. The same procedure was repeated using DDW and 0.01 M NaNO3 solutions.
2.8 Desorption studies
Batch process was used for desorption studies. 0.5 g adsorbent was taken in a conical flask and treated with 50 mL of Cd(II) solution of desired concentration. After 24 h the solution was filtered and the filtrate was analyzed for residual Cd(II) concentration. The adsorbent was washed several times with double distilled water (DDW) to ensure complete removal of Cd(II) ions and it was then treated with 50 mL of desorbing solution. The amount of Cd(II) desorbed or recovered in the supernatant liquid was then determined by AAS.
All the experiments were carried out in triplicate and mean value was reported. The standard deviation was within ±3%.
3 Results and discussion
3.1 Adsorption of heavy metals on different clay materials
Clay minerals have shown high affinity toward heavy metals. The affinity order of some heavy metals on various clay minerals along with ball clay is reported in Table 1. The results showed excellent ability of ball clay to adsorb Cd2+ ions in comparison to other natural clays.
Clay minerals
Affinity order
References
Ca-montmorillonite
Cr3+ > Cu2+ > Zn2+ > Cd2+ > Pb2+
Hongping et al., 2000
Illite
Cr3+ > Pb2+ > Cu2+ > Zn2+ > Cd2+
Hongping et al., 2000
Kaolinte
Cr3+ > Pb2+ > Zn2+ > Cu2+ > Cd2+
Hongping et al., 2000
Kaolin
Cr3+ > Zn2+ > Cu2+ = Cd2+ = Ni2+ > Pb2+
Chantawong et al., 2003
Ball clay
Cd2+ > Cu2+ > Ni2+ > Zn2+ > Pb2+ > Cr3+
This study
3.2 SEM and EDX studies
The energy dispersive X-ray (EDX) of native ball clay showed the presence of high percentage of silica and alumina while EDX of Cd(II) treated ball clay showed the presence of 1.27% Cd(II) (Table 2). The scanning electron microscopy (SEM) of native ball clay when treated with Cd(II) showed distinct morphology indicating that Cd(II) was adsorbed on the surface of the ball clay.
% Weight
Carbon (C)
Oxygen (O)
Alumina (Al)
Silica (Si)
Iron (Fe)
Cadmium (Cd)
Native ball clay
18.18
37.34
15.21
26.06
1.62
Nil
Treated ball clay
21.16
38.36
13.28
24.43
Nil
1.27
3.3 Chemical composition of ball clay
Ball clay was tested by National Test House (Govt. of India) Ghaziabad (UP). The chemical composition (Table 3) indicated that it was mainly composed of silica SiO2 (53.70%), alumina Al2O3 (31.31%) and moisture (10.03%) or loss on ignition. The Si atoms at surface maintain their tetrahedral coordination with oxygen (Dogan et al., 2000).The different types of Silanol groups are shown as (Dogan et al., 2000).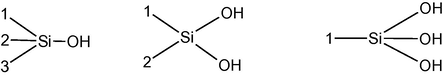
Natural clays
Elemental composition (% weight)
SiO2
Fe2O3
Al2O3
TiO2
Loss on ignition
CaO
NaO
K2O
MgO
References
Montmorillonite
65.34
2.38
12.89
0.52
8.06
0.24
0.53
1.54
0.95
Bosco et al. (2006)
Indigenous clay
46.22
0.68
38.40
–
13.47
0.86
–
–
0.37
Sharma (2008)
Pure smectite
50.08
6.00
17.40
–
20.31
0.28
1.39
0.84
3.95
Bedoui et al. (2008)
Kaolinite clay
53.70
2.00
43.60
0.10
–
–
–
0.50
–
Jiang et al. (2010)
Illitic clay
62.72
5.58
14.34
0.82
–
7.27
1.01
3.59
1.82
Ghorbel-Abid et al. (2010)
Beidellite
58.08
2.96
29.92
0.22
–
0.63
1.85
0.22
5.48
Etci et al. (2010)
Zeolite
46.50
3.00
15.00
0.30
–
10.00
0.60
6.00
2.30
Panuccio et al. (2009)
Pumice
72.00
2.10
11.90
0.10
–
0.60
–
5.10
0.10
Panuccio et al. (2009)
Vermiculite
39.00
8.00
12.00
–
–
3.00
–
4.00
20.00
Panuccio et al. (2009)
Kaolin
46.70
0.75
37.33
<0.01
13.68
<0.10
<0.10
0.93
<0.10
Chantawong et al. (2003)
Ball clay
53.70
1.99
31.31
1.91
10.03
0.41
0.44
Nil
Nil
(Present study)
The surface groups in alumina are given as (Dogan et al., 2000; Hohl and Stumm, 1976).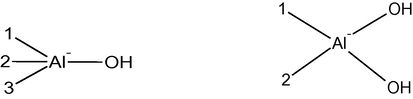
These groups give the adsorption properties to ball clay. The elemental composition of various natural clays (Table 3) showed that all these minerals contain high percentage of Silica and alumina that was responsible for the adsorption of metal ions.
3.4 Effect of heating on weight loss and percent adsorption
The effect of heating temperature is shown in Fig. 1. It is clear from the figure that weight loss up to 200 °C was 6% and continued (7%) up to 600 °C. This could be due to the loss of moisture content and this process continued up to 600 °C. The weight loss was maximum (13.8%) at 800 °C which might be due to the release of interlayer structural water from ball clay. The % adsorption decreased very little (80–76%) in the temperature range 200–600 °C but decreased sharply to 54% at 800 °C indicating that adsorption of Cd(II) on ball clay occurred on SiOH or Al-OH sites. These sites were lost at or above 800 °C hence there was a sharp decrease in metal binding capacity of the ball clay. When temperature was increased further (1000 °C) the weight loss became almost constant due to the formation of anhydrous oxides of alumina and silica and hence % adsorption of Cd(II) increased very little (54–62%).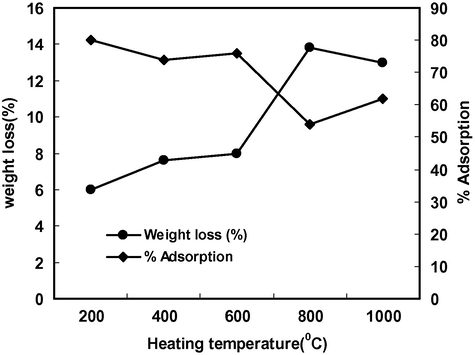
Effect of heating temperature on weight loss and % adsorption of Cd(II) on ball clay.
3.5 Effect of pH and electrolyte concentration
Solution pH is the most important variable governing the adsorption of metal ions. In order to investigate the effect of initial pH on the adsorption of Cd(II), equilibrium pH and effect of initial pH on % adsorption in the presence of electrolyte, batch experiments were conducted at different initial pH values in the range 2–9. Fig. 2 showed that equilibrium pH was not much affected in strongly acidic solution (pH = 2) and the adsorption of Cd(II) was minimum (60%) but when initial pH was adjusted to 4 the equilibrium pH or final pH increased to 4.6 indicating that Cd(II) ions were adsorbed (84.4%) along with some H+ ions resulting in an increase in the final pH. Similarly at initial pH 6 the final pH increased to 6.7 indicating that adsorption of H+ ions and Cd(II) ions continued. However, when initial pH was adjusted to 8, final pH decreased to 6.9 due to the formation of Cd(OH)+ which was the dominating species of Cd(II) in the pH range 8–10 (Naiya et al., 2009). It can be concluded that the maximum amount of Cd(II) was adsorbed in the form of Cd2+ ions up to pH 8 but above this pH adsorption of Cd(II) occurred in the form of Cd(OH)+ or micro-precipitation on the surface of the adsorbent. Fig. 3 shows that there was no common point of intersection of all the curves of different concentrations of electrolyte (NaNO3) at ΔpH = 0 hence second charge reversal cannot be considered as pHpzc. However, ΔpH value below pH 3 was not affected by the change in electrolyte concentration therefore first charge reversal that occurred at pH 2 (ΔpH = 0) may be considered as pHpzc (Tripathy and Kanugo, 2005). The surface of the adsorbent is positive at pH < pHpzc, neutral at pH = pHpzc and negative at pH > pHpzc therefore the adsorption of Cd(II) was least at pH 2 and increased with increase in pH due to electrostatic attraction between positively charged Cd(II) ions and negatively charged surface of the adsorbent. The adsorption of Cd(II) was strongly influenced in the presence of high concentration of electrolyte (Fig. 4). The % adsorption of Cd(II) increased with increase in pH in the presence of 0.1 M NaNO3 but remained lower than that observed in DDW and 0.01 M NaNO3.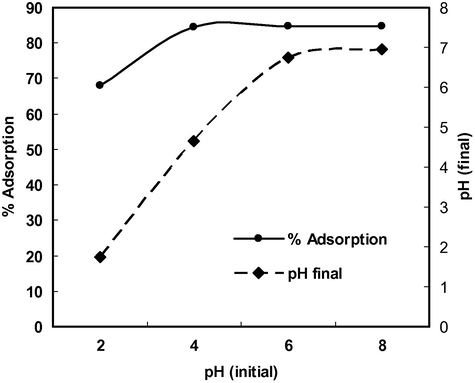
pH change during Cd(II) adsorption.
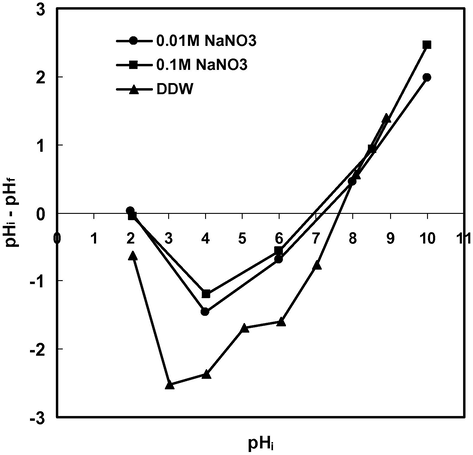
Point of zero charge.
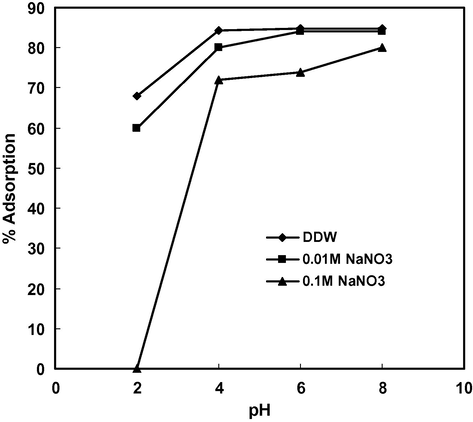
Effect of pH and electrolyte on the adsorption of Cd(II).
3.6 Effect of adsorbent doses
The effect of adsorbent dose was studied by varying the adsorbent quantity from 0.1 to 1.0 g 50 mL−1 maintaining the initial Cd(II) concentration at 50 mg L−1 at different temperatures (30, 40 and 50 °C). The results are shown in Fig. 5. The % adsorption increased from 72 to 90 with increasing adsorbent dose because of the increased availability of adsorption sites therefore in order to achieve maximum removal efficiency, 1 g dose of adsorbent was sufficient for fixed initial concentration of Cd(II) (50 mg L−1) and fixed volume of solution (50 mL). The adsorption density (mg g−1) decreases from 18 to 2.25 mg g−1 with increase in adsorbent dosage, this might be due to the fact that some adsorbent sites remained unsaturated at higher adsorbent dose resulting in decreased adsorption density at constant initial metal ion concentration as a fixed mass of adsorbent can only adsorb a certain amount of Cd(II). When the same experiment was repeated at higher temperatures, it was found that % adsorption increased with increase in temperature (% adsorption at 30, 40 and 50 °C was 90%, 95.5% and 96%, respectively) indicating that the adsorption process was endothermic in nature.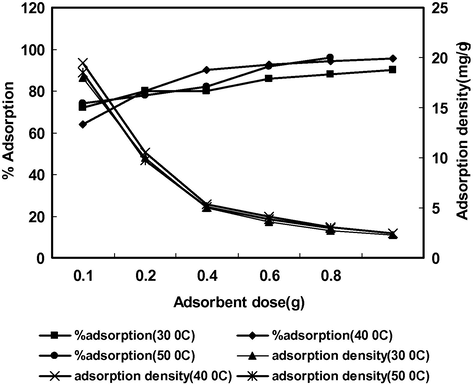
Effect of adsorbent doses at different temperatures.
3.7 Adsorption isotherms
The Langmuir and Freundlich adsorption isotherms were used to describe the Cd(II) adsorption on ball clay. Langmuir isotherm is based on the assumption of homogeneous adsorbent surface where all the adsorption sites are identical. The Langmuir adsorption isotherm assumes monolayer adsorption onto a surface with a finite number of identical sites and is represented as:
Dose (g)
qe(exp) (mg g−1)
qe(cal) (mg g−1)
qm (mg g−1)
b (L mg−1)
RL
R2
χ2
0.1
18.00
5.68
27.17
0.018
0.526
0.9414
26.77
0.6
3.58
3.17
0.8
2.75
2.76
1.0
2.25
2.34
The essential characteristics and the feasibility of the Langmuir isotherm can be represented in terms of a dimensionless constant separation factor or equilibrium parameter RL (Khan et al., 2010) which is defined as:
The chi-square test (χ2) was also carried out to support the best fit model. The equation used to evaluate chi-square test may be written as:
Lower the value of χ2 better the fit of the model. Table 4 shows that the values of qe(exp) differed appreciably from the values of qe calculated qe(cal) from the Langmuir model at low adsorbent doses, but when adsorbent dose was increased the values of qe(exp) became closer to the qe(cal) values indicating that the Langmuir model failed at lower adsorbent dose. This was also supported by high χ2 test values.
The Freundlich adsorption isotherm is an empirical equation used to describe heterogeneous system. The linear form of Freundlich isotherm is represented as:
Where Kf is Freundlich constant and n is another constant representing heterogeneity of the adsorbent, Ce is the equilibrium concentration (mg L−1); qe is the amount of Cd(II) adsorbed per unit weight of adsorbent (mg g−1). The linear plot of log qe versus log Ce was used to calculate the values of Kf and n. The values of Kf, n, regression coefficient (R2), qe(exp), qe(cal) along with chi-square test are reported in Table 5a. The values of qe(exp) and qe(cal) were quite close even at lower adsorbent doses indicating that the Freundlich model was better obeyed by the system as indicated by the small value of χ2 and high value of regression coefficient (R2 = 0.9861). The n value obtained for the adsorption process (n = 0.47) also indicated beneficial adsorption. Table 5b shows Freundlich isotherm parameters of various clays. The values of coefficient of regression (R2) indicated that most of them follow Freundlich isotherm and adsorption was favorable as the values of n were between 1 and 10.
Dose (g)
qe(exp) (mg g−1)
qe(cal) (mg g−1)
Kf
n
R2
χ2
0.1
18.00
17.4
0.066
0.47
0.9861
0.1175
0.6
3.58
4.04
0.8
2.75
2.91
1.0
2.25
1.98
Clay
n
K
R2
References
Bentonite
0.43
0.13
0.97
Sim et al. (2009)
CTAB Bentonite
0.43
0.09
0.99
Sim et al. (2009)
Beidellite
0.36
6.50
0.73
Etci et al. (2010)
Kaolinite
1.43
0.15
0.98
Jiang et al. (2010)
Ball clay
0.45
0.34
0.99
Chantawong et al. (2003)
Kaolin
0.50
0.06
0.95
Chantawong et al. (2003)
Montmorillonite
0.85
424.4
–
Jobstmann and Singh, 2001
Hydroxy-Al interlayered Montmorillonite
0.52
56.99
–
Jobstmann and Singh, 2001
Ball clay Heated at 200 °C
0.47
0.06
0.98
Present study
The maximum monolayer adsorption capacity (qm) of ball clay was found to be 27.27 mg g−1. The adsorption capacity was compared with other natural clays studied earlier and it was found that the adsorption capacity of ball clay was comparable with these adsorbing materials (Fig. 6).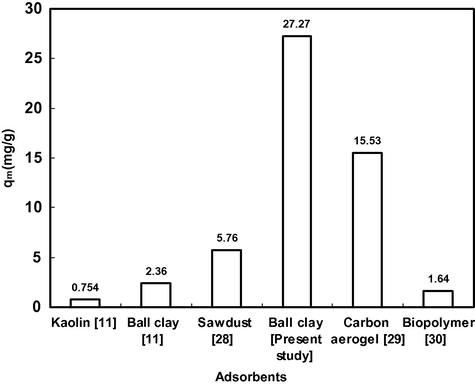
Cd(II) adsorption capacity of various natural clays.
3.8 Adsorption kinetics
The rate constants were calculated by using pseudo first-order and pseudo-second order kinetic models (Banat et al., 2003). The first order expression is given as:
Where qe is the amount of metal ions adsorbed per unit weight of adsorbent at equilibrium or adsorption capacity (mg g−1), qt is the amount of Cd(II) adsorbed per unit weight of adsorbent at any given time t and K1 is the pseudo-first order rate constant for adsorption. The values of K1 were calculated from slope of the linear plots of log (qe − qt) versus t at various concentrations (Figure not shown). The values of regression coefficient (R2) and rate constant at various concentrations are reported in Table 6.
Concentration (mg L−1)
qe(exp) (mg g−1)
qe(cal) (mg g−1)
K1 (min−1)
R2
0.1
0.006
0.006
0.166
0.9927
5.0
0.047
0.050
0.069
0.9941
50.0
4.000
2.760
0.650
0.9969
The pseudo second-order kinetic rate equation is given as:
Where h is the initial adsorption rate which is equal to
and K2 is the pseudo-second order rate constant for the adsorption of Cd(II) (g mg−1 min−1). The values of h were calculated from the intercept of the linear plots of t/qt verses t at various initial Cd(II) concentrations (figure not shown). Table 7 provides pseudo-second-order rate constants K2, h, calculated equilibrium sorption capacity qe(cal) and experimental equilibrium sorption capacity qe(exp) at various initial Cd(II) concentrations. The qe values calculated from the pseudo-first order kinetic model were very close to qe(exp) values in the concentration range 0.1–5 mg L−1. However, in the pseudo-second-order kinetic model the qe(exp) values were very close to qe(cal) at all the studied concentrations. The values of correlation coefficients obtained from both the models were high (R2 > 0.99) showing that both the models were obeyed by the system at lower initial Cd(II) concentrations but when the concentration of Cd(II) was increased, the pseudo-first-order model failed while pseudo-second-order model was still obeyed (up to 50 mg L−1) Cd(II). The pseudo-first-order model suggested that the process which controlled the rate might be boundary layer and if pseudo-second-order model was obeyed, it indicated that process controlling the rate might be chemical adsorption. The fitness of pseudo-first-order model at lower concentration of Cd(II) suggested that the adsorption rate was boundary controlled but when the concentration of Cd(II) was increased, the rate of adsorption was controlled by chemical adsorption.
Concentration (mg L−1)
K2 (g mg−1 min−1)
qe(exp) (mg g−1)
qe(cal) (mg g−1)
h (mg g−1)
R2
0.1
50.00
0.006
0.006
0.0018
0.997
5.0
5.52
0.470
0.470
1.2200
1.000
50.0
1.88
4.000
4.004
30.2100
1.000
3.9 Adsorption and desorption of Cd(II) from aqueous solution
Desorption of Cd(II) was performed using various desorbing solutions and results are reported in Fig. 7. The desorption of Cd(II) was negligible with NaCl, Na2SO4, acetic acid and EDTA. However, excellent results were obtained when desorption was carried out with HCl solution. The desorption of Cd(II) was 100% with 0.5, 1 and 2 M HCl. This behavior of ball clay indicated that adsorption of Cd(II) was chemical in nature. Adsorption was reversible and adsorbed Cd(II) could be completely recovered with 0.5 M HCl solution.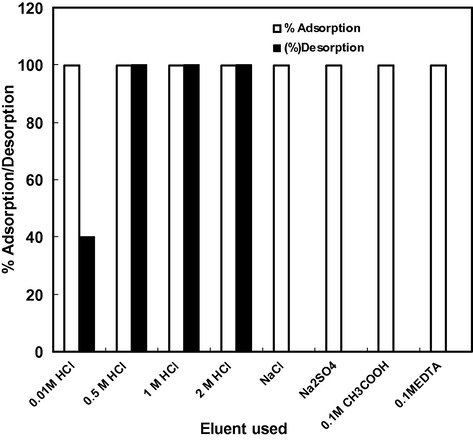
Adsorption and desorption of Cd(II). Initial Cd(II) concentration = 50 mg/L.
4 Conclusion
Ball clay can be used as an effective adsorbent for the removal and recovery of Cd(II) from aqueous solution. The adsorption properties of ball clay were comparable to other previously studied natural clays. Adsorption of Cd(II) was pH dependent and the maximum adsorption occurred at pH 6. Adsorption followed pseudo-first order and second order kinetics at lower initial concentrations of Cd(II). The % adsorption of Cd(II) increased with increase in adsorbent dose. 100% adsorption was possible by batch process when adsorbent was treated with 50 mL of Cd(II) solution containing 50 mg L−1 Cd(II) and 100% desorption could be achieved using 0.5 M HCl as the desorbing agent.
Acknowledgment
Authors are thankful to the Chairman, Department of applied chemistry, Z.H. College of Engineering and Technology for providing research facilities.
References
- Adsorption of heavy metals on Na-montmorillonite: Effect of pH and organic substances. Water Res.. 2003;37:1619-1627.
- [Google Scholar]
- Summary of recommendations of AIPEA nomenclature committee on clay minerals. Am. Mineralogist. 1980;65:1-7.
- [Google Scholar]
- Kinetics and equilibrium study of cadmium ion sorption onto Date-pits, An Agriculture Waste. Adsorption Sci. Tech.. 2003;21:245-260.
- [Google Scholar]
- Removal of cadmium (II) from aqueous solution using pure smectite and Lewatite S 100: the effect of time and metal concentration. Desalination. 2008;223:269-273.
- [Google Scholar]
- Male Infertility and environmental exposure to lead and cadmium. Hum. Reprod. Update. 2000;6:107-121.
- [Google Scholar]
- Removal of Mn(II) and Cd(II) from wastewaters by natural and modified clays. Adsorption. 2006;12:133-146.
- [Google Scholar]
- Comparison of heavy metal adsorptions of thai kaolin and ball clay. Water Air Soil Pollut.. 2003;148:111-125.
- [Google Scholar]
- Adsorption of methylene blue from engum solution onto Perlite. Water Air Soil Pollut.. 2000;120:229.
- [Google Scholar]
- Single and binary adsorption of lead and cadmium ions from aqueous solution using the clay mineral beidellite. Environ. Earth Sci.. 2010;61:231-240.
- [Google Scholar]
- Retention of chromium (III) and cadmium (II) from aqueous solution by illitic clay as a low-cost adsorbent. Desalination. 2010;256:190-195.
- [Google Scholar]
- Definition of clay and clay minerals: Journal report of the AIPEA nomenclature and CMS nomenclature committees. Clays Clay Miner.. 1995;43:225-256.
- [Google Scholar]
- Adsorption of carmoisine A from wastewater using waste materials–bottom ash and deoiled soya. J. Colloid Interface Sci.. 2009;335:24-33.
- [Google Scholar]
- Adsorption of a hazardous dye, erythrosine, over hen feathers. J. Colloid Interface Sci.. 2006;304:52-57.
- [Google Scholar]
- Experimental study of the selective adsorption of heavy metals onto clay minerals. Chin. J. Geochem.. 2000;19:105-109.
- [Google Scholar]
- Adsorption of Pb(II), Cd(II), Ni(II) and Cu(II) onto natural kaolinite clay. Desalination. 2010;252:33-39.
- [Google Scholar]
- Effects of phosphorus and zinc fertilizer on cadmium uptake and distribution in flax and durum wheat. J. Agric. Food Chem.. 2004;84:777-785.
- [Google Scholar]
- Cadmium sorption by Hydroxy- aluminium interlayered Montmorillonite. Water Air Soil Pollut.. 2001;131:203-215.
- [Google Scholar]
- Adsorption studies of Dichloromethane on some commercially available GACs: effect of kinetics, thermodynamics and competitive ions. J. Hazard. Mater.. 2010;178:963-972.
- [Google Scholar]
- Removal of pyridine from aqueous solution by adsorption on bagasse fly ash. Ind. Eng. Chem. Res.. 2006;45:3934-3943.
- [Google Scholar]
- Use of hen feathers as potential adsorbent for the removal of a hazardous dye, Brilliant Blue FCF, from wastewater. J. Hazard. Mater.. 2006;128:233-239.
- [Google Scholar]
- Adsorption kinetics of removal of a toxic dye, Malachite Green, from wastewater by using hen feathers. J. Hazard. Mater.. 2006;133:196-202.
- [Google Scholar]
- Adsorptive removal and recovery of the azo dye Eriochrome Black T. Toxicol. Environ. Chem.. 2010;92:1813-1823.
- [Google Scholar]
- Removal and recovery of Chrysoidine Y from aqueous solutions by waste materials. J. Colloid Interface Sci.. 2010;344:497-507.
- [Google Scholar]
- Adsorption of hazardous dye crystal violet from wastewater by waste materials. J. Colloid Interface Sci.. 2010;343:463-473.
- [Google Scholar]
- Decoloration treatment of a hazardous triarylmethane dye, Light Green SF (Yellowish) by waste material adsorbents. J. Colloid Interface Sci.. 2010;342:518-527.
- [Google Scholar]
- Adsorptive removal of hazardous anionic dye “Congo red” from wastewater using waste materials and recovery by desorption. J. Colloid Interface Sci.. 2009;340:16-26.
- [Google Scholar]
- Adsorption studies on the removal of colouring agent phenol red from wastewater using waste materials as adsorbents. J. Colloid Interface Sci.. 2009;337:345-354.
- [Google Scholar]
- Batch and bulk removal of a triarylmethane dye, Fast Green FCF, from wastewater by adsorption over waste materials. J. Hazard. Mater.. 2009;163:568-577.
- [Google Scholar]
- Applicability of waste materials–bottom ash and deoiled soya–as adsorbents for the removal and recovery of a hazardous dye, brilliant green. J. Colloid Interface Sci.. 2008;326:8-17.
- [Google Scholar]
- Removal and recovery of hazardous triphenylmethane dye, Methyl Violet through adsorption over granulated waste materials. J. Hazard. Mater.. 2008;150:364-375.
- [Google Scholar]
- Process development for the removal and recovery of hazardous dye erythrosine from wastewater by waste materials-Bottom Ash and De-Oiled Soya as adsorbents. J. Hazard. Mater.. 2006;138:95-105.
- [Google Scholar]
- Trivalent chromium removal from wastewater using low cost activated carbons derived from agricultural waste materials and activated carbon fabric cloth. J. Hazard. Mater.. 2006;135:280-295.
- [Google Scholar]
- Adsorption of Cd(II) and Pb(II) from aqueous solutions on activated alumina. J. Colloid Interface Sci.. 2009;333:14-26.
- [Google Scholar]
- Cadmium adsorption on vermiculite, zeolite and pumice. Batch experimental studies. J. Environ. Manage.. 2009;90:364-374.
- [Google Scholar]
- Removal of basic dye from effluent using wood as an adsorbent. J. Water Pollut. Control Fed.. 1978;50:926-935.
- [Google Scholar]
- Safe levels of cadmium intake to prevent renal toxicity in human subjects. Br. J. Nutr.. 2000;84:791-802.
- [Google Scholar]
- Mercury, Cadmium, Lead. In: Handbook for sustainable heavy metals policy and regulation. Springer; 2001.
- [Google Scholar]
- Thermodynamics of removal of cadmium by adsorption on indigenous clay. Chem. Eng. J.. 2008;145:64-68.
- [Google Scholar]
- Physicochemical characteristics for adsorption of MTBE and cadmium on clay minerals. Environ. Earth Sci.. 2009;59:537-545.
- [Google Scholar]
- Adsorption of Co2+, Ni2+, Cu2+ and Zn2+ from 0.5 M Nacl and major ion sea water on a mixture of δ-MnO2 and amorphous FeOOH. J. Colloid. Interface. Sci.. 2005;284:30-38.
- [Google Scholar]
- 11th Report on carcinogens, National Toxicology Program, 2008. US department of Health and Human Service, Public Health Service, Section 262, PL 95–622.


