

Translate this page into:
Amendment of palladium nanocubes with iron oxide nanowires for boosted formic acid electro−oxidation
⁎Corresponding authors. islam.ahmed@bue.edu.eg (Islam M. Al-Akraa), ammohammad@cu.edu.eg (Ahmad M. Mohammad)
-
Received: ,
Accepted: ,
This article was originally published by Elsevier and was migrated to Scientific Scholar after the change of Publisher.
Peer review under responsibility of King Saud University.
Abstract
To quickly move the formic acid (FA) fuel cells closer to a real commercialization, an inexpensive, efficient, and durable electrocatalyst for the direct FA electro-oxidation (FAEO) was developed. This involved a sequential modification of a glassy carbon (GC) substrate with palladium nanocubes (ca. 70 nm, nano-Pd) and iron oxide nanowires (nano-FeOx, ca. 40 nm and 150 nm in average diameter and length, respectively). The deposition sequence and loading level of nano-FeOx in the catalyst were optimized to minimize the catalyst's poisoning with CO that might probably release from a parallel dehydration of FA or from CO2 reduction. Surprisingly, the FeOx/Pd/GC catalyst exhibited a high (21.6 mA cm−2) specific activity for FAEO, which denoted ca. 7 times that of the “pristine” Pd/GC catalyst. This was synchronized with a better (up to fivefold increase in turnover frequency) “long-termed” stability that extended for 90 min of continuous electrolysis at room temperature. A successful effort was dedicated to improving more the catalyst's stability by activating the catalyst electrochemically at –0.5 V vs Ag/AgCl/KCl (sat.) in 0.2 mol L−1 NaOH. The CO stripping agreed perfectly with the impedance analysis in appending the observed enhancement in the catalytic efficiency of FAEO to a favorable electronic modulation at the Pd surface that boosted the oxidative desorption of poisoning CO species at a lower potential.
Keywords
Fuel cells
Formic acid
Iron oxide
Electrocatalysis
Pd nanocubes

1 Introduction
Securing the society with energy, water, food, and drugs (EWFD), in order to fulfill the global goals of sustainability, has become essential not only under normal conditions but also during pandemics and disasters. However, unfortunately, receding resources with the increased demand associated with the change in human demographics, land use, and climate change have impeded the achievement of these goals. In the energy sector, the sole dependence on traditional combustion schemes utilizing fossil fuels must be replaced with cleaner renewable technologies (Carmo et al., 2013, Nishimura et al., 2014). One of these green technologies depends on the solar production of hydrogen from water splitters. Hydrogen is then used directly as in electric vehicles or saved to produce electricity via fuel cells (FCs). These FCs look like the regular combustion engines in oxidizing the fuel but they, moreover, feature an enhanced efficiency, durability, reliability, scalability, eco-friendliness, less noisiness, moving flexibility, and easiness of installation which qualified FCs to supply direct power to numerous stationary and portable electronic applications (Braunchweig et al., 2013, Oishi and Savadogo 2013). The fuel cell vehicles (FCVs) received their power from the H2/O2 FCs (HFCs) with a power exceeding 140 kW (e.g., Honda Clarity, Toyota Mirai, Hyundai Tucson, etc.) (Eppinger and Huang 2017). Nevertheless, the low (2.2 kW h L−1) volumetric energy densities of H2, expensive miniaturization of its containers, high energy losses associated with the H2 compression, liquefaction, and boil-off, and potential risks and challenges associated with its use, storage, and transport have all stimulated a great interest to replace hydrogen with liquid fuels (Egeland-Eriksen et al., 2021).
In this regard, several liquids such as methanol, ethanol, and formic acid (FA) were recommended as low-carbon fuels with favorable convenience in handling and storage. These fuels could simply be obtained from biomass, and they keep high energy densities (up to 1 kW h kg−1) (Mardini and Biçer 2021) and own, moreover, simple structures that simplified their reaction mechanisms and minimized undesired intermediates and byproducts (Zhang 2008). However, comparatively, the ethanol electro−oxidation and the corresponding direct ethanol FCs (DEFCs) received the least attention due to the relatively higher carbon content of ethanol and its complex oxidation mechanism that included several undesired byproducts (Akhairi and Kamarudin 2016). On the other hand, the methanol (MO) and FA electro−oxidations were less complicated with the capability to sustain large volumetric energy densities up to 4820 and 1750 kW h L−1, respectively (Choun 2016).
However, if compared together, the direct formic acid FCs (DFAFCs) appeared more practical than the direct methanol FCs (DMFCs) in terms of safety, efficiency, and fuel/membrane crossover and compatibility (Wang et al., 2004, Al-Akraa et al., 2021). Indeed, the DMFCs suffer from the toxicity, flammability, and high crossover (through Nafion membranes) of methanol together with the slow kinetics of MO. On the other hand, the non-toxicity, volumetric capacity (53 g H2/L) and low flammability (under ambient conditions) of FA enabled the maturity of the DFAFCs and presaged its use as a H2 carrier in FCVs with the adaptation of the existing gasoline infrastructure for FA distribution (Eppinger and Huang 2017). Furthermore, FA exhibits much lower crossover (through Nafion membranes) than methanol, perhaps as a result of repulsion between HCOO– and –SO3– groups in the membrane that permits using very thin membranes and highly concentrated fuel solutions in DFAFCs while keeping the loss of open circuit voltage minimum (Yu and Pickup 2008, Zhang et al., 2010, Eppinger and Huang 2017). Last but not least, the theoretical open-circuit potential and energy efficiency (1.40 V, 1.062 %) of the DFAFCs exceed those of the DEFCs (1.145 V, 0.969 %), DMFCs (1.21 V, 0.967 %) and HFCs (1.23 V, 0.830 %) under standard condition (25 °C, 1 atm) (Qian et al., 2006, Zhang 2008).
To commercialize the DFAFCs on a large scale, their overall performance including their power and energy densities, voltage, price, and lifetime have to be optimized. The degradation of the Nafion membrane and the carbon supports has to be resolved, and the water–CO2 management should be precisely controlled. The electrocatalysis of FAEO denotes a major dilemma as well in justifying the DFAFCs' performance. Since the 1960 s, Pt and Pd represented the most effective catalysts for FAEO (Breiter 1963, Aguilo 1969, El-Deab et al., 2014, El-Nagar et al., 2015, El-Nagar et al., 2017, Asal et al., 2021, Al-Akraa et al., 2022). Other catalysts as gold (Xiang et al., 2001), osmium (Orozco and Gutiérrez 2000), rhodium (Adić and Tripković 1979), and iridium (Ferrer and Victori 1993) were tested but showed much less efficiencies toward FAEO. While employing Pt and Pt-based catalysts for FAEO in DFAFCs was substantial, their high cost, long-term instability, and reduced tolerance against CO poisoning (deactivation) remained challenging (El-Nagar et al., 2014a, 2014b, Al-Akraa and Mohammad 2020). In fact, poisoning the Pt surface originates from the strong adsorption of released intermediates (e.g., CO) during FAEO and this precludes a large Pt area from the participation in the direct FAEO unless a high overpotential is applied.
Comparatively, Pd is less expensive and possesses a much lower tendency for CO poisoning with a better catalytic activity than Pt (Han et al., 2009, Hu et al., 2014, Al-Akraa et al., 2015a, 2015b, 2015c). While several inspections of FAEO on Pd-based surfaces disclaimed the release of CO as a poisoning intermediate (Hu et al., 2012a, 2012b, Zhang et al., 2012, Asal et al., 2022), other reports endorsed its formation in an indirect competing avenue with CO2 formation (Wang et al., 2014). This poisoning with CO and CO-like intermediates might rationalize the observed gradual deactivation of Pd surfaces in the catalysis of FAEO (Hu et al., 2012a, 2012b, Yuan and Liu 2013). The dissolution of Pd under highly oxidizing conditions would as well contribute to this deactivation (Hu et al., 2012a, 2012b, Yuan and Liu 2013). To ensure a proper functionality for the DFAFCs, the deterioration of their catalytic performance that is inspired by the catalyst's poisoning needs to be overcome. This could happen with a simple amendment or alloying of Pd with other metals (e.g., Au (Liu et al., 2010, Lee et al., 2014), Pt (Jayashree et al., 2005, Al-Akraa et al., 2015a, 2015b, 2015c), Ag (Cui et al., 2014), Ir (Wang et al., 2008, Al-Akraa et al., 2015a, 2015b, 2015c), Ru (Liu et al., 2012), Sn (Liu and Zhang 2009), Cr (Wen et al., 2013), Ni (Shen et al., 2013), Cu (El-Nagar et al., 2014a, 2014b), Co (Wang and Xia 2008), Pb (Li et al., 2010), V (Larsen et al., 2005), Co/Ir (Wang and Xia 2008), Ni/Pt (Sneed et al., 2014), Ni/P (Chang et al., 2014)), with a structural tailoring of Pd to enrich a favorable orientation (Pd (1 0 0)) at the surface (Hoshi et al., 2006) or exposing the Pd surface to trace amounts of boosting impurities (Haan et al., 2010). From another perspective, the Pd surfaces refinement with nanostructured transition metal oxides as CoOx, MnOx, NiOx, TiOx, and FeOx could enrich the surface with oxygen moiety that boosted the oxidative stripping of poisoning CO at lower overpotentials (Al-Qodami et al., 2018, Elnabawy et al., 2018, Al-Qodami et al., 2022a, Al-Qodami et al., 2022b). The electron vacancy in d-orbitals of these oxides could further accommodate electrons during oxidation to mediate and speed up the kinetics of the reaction (Jin et al., 2022). We, herein, report on the promising electrocatalysis of FAEO on the FeOx/Pd/GC catalyst whereby Pd nanoparticles (nano-Pd) were directly deposited onto a glassy carbon (GC) substrate before a modification with peerless inexpensive and earth-abundant iron oxide nanowires (nano-FeOx).
2 Experimental
All reagents were of analytical grades and employed as received. Iron (II) sulfate heptahydrate (FeSO4·7H2O) was purchased from Riedel-de Haën, sulfuric acid and sodium hydroxide pellets were purchased from Sigma-Aldrich. A glassy carbon (GC, 3.0 mm in diameter with a geometric area of 0.071 cm2) electrode was used as working electrode after mechanical polishing with emery paper followed by aqueous slurries of finer alumina powder on a cleaning microcloth. An Ag/AgCl/KCl (sat.) and spiral Pt wire were used as reference and counter electrodes, respectively. All potentials in this investigation were measured with respect to the Ag/AgCl/KCl (sat.) reference electrode.
The electrodeposition of nano-Pd onto the bare GC and FeOx/GC electrodes were carried out in 0.1 mol L–1 H2SO4 electrolyte containing 1.0 mmol L–1 PdCl2 at a constant potential electrolysis of 0 V for 300 s. Whereas nano-FeOx was deposited electrochemically on the GC and Pd/GC electrodes from 0.02 mol L–1 FeSO4·.7H2O electrolyte using cyclic voltammetry (CV) between –0.855 V and –1.205 V at 50 mV s–1 (Al-Qodami et al., 2018, Al-Qodami et al., 2022a, Al-Qodami et al., 2022b). The impact of nano-FeOx loading to the Pd/GC catalyst on the catalysis of FAEO was analyzed by depositing nano-FeOx with variable potential cycles. The anodic activation of the FeOx/Pd/GC catalyst was achieved at –0.5 V for 10 min in 0.2 mol L–1 NaOH electrolyte before electrochemical measurements to enrich the catalyst's surface with highly oxidized states of iron specious which can presumably boost the catalyst's performance toward FAEO.
All the electrochemical and electrocatalytic measurements were performed in a two compartment three-electrode conventional glass cell at a room temperature (∼25 °C) using an EG&G scanning potentiostat (model 273A) operated with Echem 270 software. The current densities were calculated according to the real surface area of the working electrode (to be calculated based on the charge consumed during the hydrogen desorption using a standard value of 0.21 mC cm−2) (Al-Akraa et al., 2015a, 2015b, 2015c). The electrocatalytic activity of the prepared catalysts toward FAEO was measured in 0.3 mol L–1 formic acid (FA) solution (pH 3.5) by CV and linear sweep voltammetry (LSV) at scan rate of 100 mV s−1. The pH was adjusted at 3.5 (by adding appropriate amount of NaOH) to ionize appropriate amount (about one third) of formic acid to formate anion which reduces the polarization resistance and enhance the ionic conductivity of the electrolyte (El-Nagar et al., 2013). The CO stripping voltammetry and the electrochemical impedance spectroscopy were measured at open circuit potential in 0.5 mol L–1 H2SO4 and 0.3 mol L–1 formic acid solution (pH 3.5), respectively.
The surface morphology and the elemental composition of the prepared catalysts were examined using a Zeiss Ultra 60 field emission scanning electron microscope (FE-SEM) and energy-dispersive X-ray spectroscopy (EDX, equipped to the Zeiss FE-SEM), respectively. The crystal structure of the catalysts was identified using X-ray diffractometer (XRD, PANalytical, Empyrean) operated with Cu target (λ = 1.54 Å) in the range of 2θ = 20−100°. The surface chemical analysis of the best catalyst was evaluated using a “Thermo Scientific™ K-Alpha™ X-ray Photoelectron Spectrometer” (XPS, Thermo Fisher Scientific, USA) that operated with a monochromatic micro-focused X ray Al K-alpha radiation (10 to 1350 eV) and spot size of 400 mm at a pressure of 109 mbar with a spectrum pass energy of 200 eV and at a narrow spectrum of 50 eV.
3 Results and discussion
3.1 Electrochemical characterization
3.1.1 Effect of deposition order
Cyclic voltammetry (CV) is a powerful tool for following the kinetics of electrochemical reactions with a precise capability for identifying and assessing very minor electroactive species (Al-Akraa et al., 2013). Fig. 1A shows CVs of the Pd/GC, Pd/FeOx/GC and FeOx/Pd/GC catalysts in 0.5 mol L–1 H2SO4. The Pd/GC catalyst displays the identical characterization of a clean Pd substrate with the surface oxidation extending from 500 to 1200 mV with a subsequent reduction at ca. 450 mV. This was coupled with the hydrogen adsorption/desorption (Hads/des) peaks which appeared in the potential range from 0.0 to –200 mV (Al-Akraa et al., 2015). Similar behaviors were observed at the Pd/FeOx/GC and FeOx/Pd/ GC catalysts but the intensities of the PdO reduction peak (at ca. 450 mV) were shorter; informing about the relative decrease in the real surface area of Pd. This was also acceptable in view of the different loaded amounts and/or the partial consumption of the Pd surface in the deposition of nano-FeOx. The FeOx/Pd/GC catalyst displayed a short redox peak couple at 450 mV and 80 mV that corresponded to the Fe2+/Fe3+ transformation (Al-Qodami et al., 2018). The weakness of this peak couple agreed with the instabilities of nano-FeOx in acidic media (Fu et al., 2021). Alternatively, the CVs of the same set (Pd/GC, FeOx/GC, Pd/FeOx/GC and FeOx/Pd/GC) of catalysts were recorded in 0.5 mol L–1 KOH (Fig. 1B). Similar behaviors for the Pd surface as those in Fig. 1A appeared in 0.5 mol L–1 KOH (Fig. 1B) but at different potentials; the Pd oxidation at (–100 to 600 mV), the PdO reduction at (ca. –400 mV) and the Hads/des at (orange circles, ca. −850 mV for desorption and less than −1.0 V for adsorption). In addition, a new redox peak (blue circles, oxidation at −640 mV and reduction at −850 mV) appeared for nano-FeOx which corresponded to the reversible Fe(II)/Fe(III) oxide transformation (Doyle and Lyons 2013). Existence of nano-FeOx in FeOx/Pd/GC catalyst improved largely the Hads/des; as indicated at ca. −850 mV (Faid et al., 2019).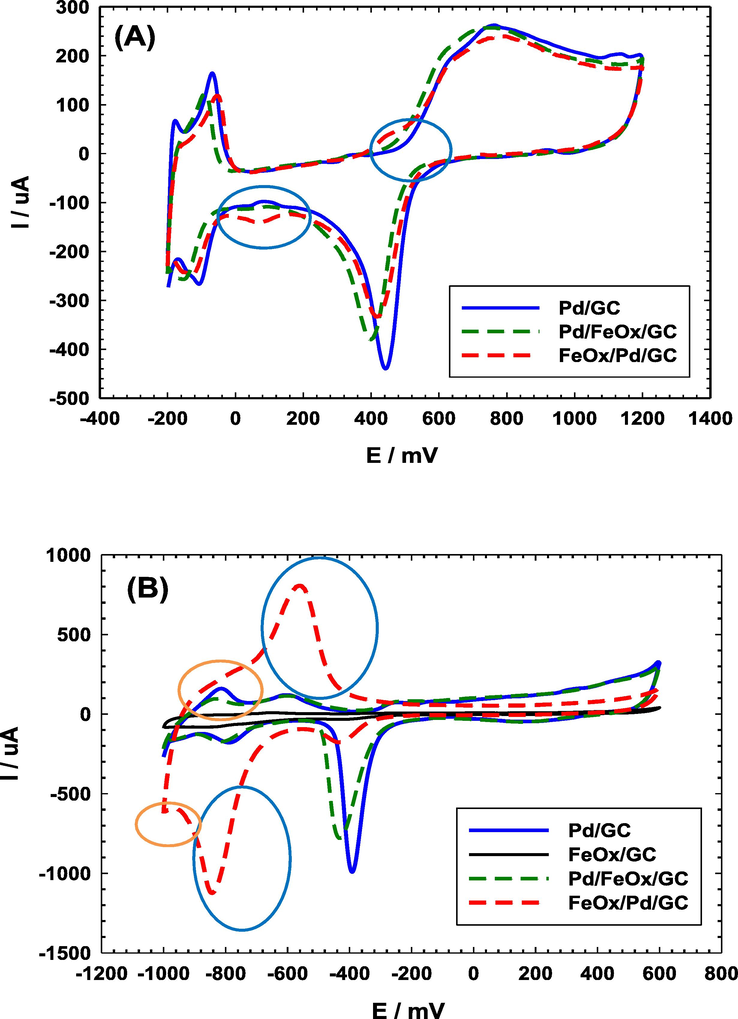
CVs obtained at “pristine” and FeOx-modified GC electrodes in (A) 0.5 M H2SO4 and (B) 0.5 M KOH (4 potential cycles were applied for the deposition of nano-FeOx).
3.1.2 Effect of nano-FeOx loading
The loading of nano-FeOx in the FeOx/Pd/GC catalyst was optimized for FAEO. Fig. 2A and B show the characteristic CVs in acidic and alkaline media, respectively, of the Pd/GC catalyst and several FeOx/Pd/GC catalysts of variable nano-FeOx loading (the loading was varied by increasing the deposition cycles, N). Fig. 2A shows a drop in the intensities of the PdO reduction peak and the Hdes peak in 0.5 M H2SO4 with the nano-FeOx loading. The same behavior was repeated in 0.5 mol L–1 KOH (Fig. 2B); concurrently with a gradual rise in the intensity of the redox peak couple (observed from ca. –800 mV to –600 mV). As obviously seen, the peak potential for PdO reduction was shifted to lower overpotentials at the nano-FeOx-modified catalysts if compared to the Pd/GC catalyst; recommending a vital moderation in the electronic properties of Pd at the catalyst' surface. Needless to indicate that the surface coverage of Pd decreased significantly with the loading of nano-FeOx. It is also easy to notice the unique characteristics for the FeOx/Pd/GC catalyst that was loaded with nano-FeOx for 4 cycles. This included the highest negative shift in the peak potential of PdO reduction (almost similar to the case of 2 cycles deposition of nano-FeOx), in addition to the obvious detection (higher intensities) of Fe(II)/Fe(III) oxide transformation (at ca. 480 mV in the anodic scan and ca. 80 mV in the cathodic scan, Fig. 2A). The same Fe(II)/Fe(III) oxide transformations appeared at lower overpotentials in an alkaline medium (Fig. 2B).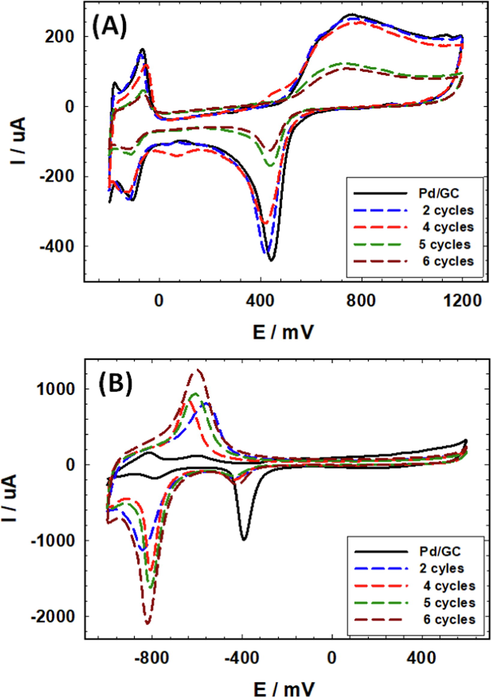
CVs obtained in (A) 0.5 M H2SO4 and (B) 0.5 M KOH at the unmodified Pd/GC (solid black line) and FeOx-modified Pd/GC (dashed lines) catalysts with various loadings of nano-FeOx (Legend indicates the no. of cycles involved in the deposition of nano-FeOx).
3.1.3 Effect of activation
Moreover, an anodic activation of the FeOx/Pd/GC was carried out at –0.5 V to enrich the catalyst's surface principally in the oxide form. Fig. 3 shows the characteristic CVs of FeOx/Pd/GC before and after activation. In Fig. 3A, the intensity of the PdO reduction peak increased after activation which recommended a significant dissolution of nano-FeOx during the activation. A similar behavior was observed in an alkaline medium (Fig. 3B).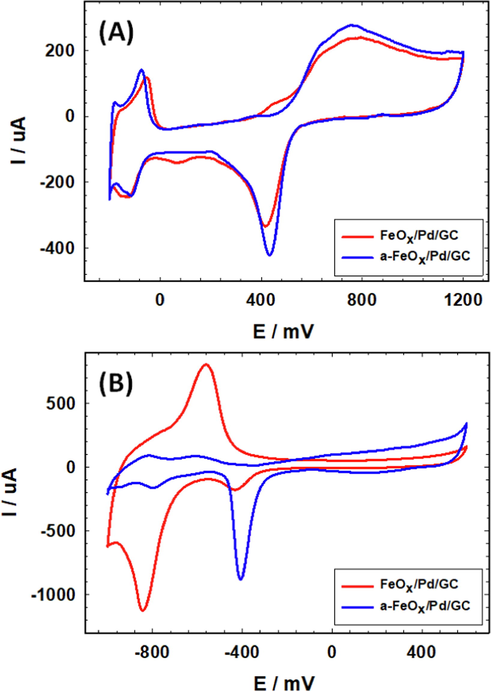
CVs obtained at the inactivated FeOx/Pd/GC and activated a-FeOx/Pd/GC catalysts in (A) 0.5 M H2SO4 and (B) 0.5 M KOH (4 potential cycles were applied for the deposition of nano-FeOx).
3.2 Material's characterization
Fig. 4 represents the FE-SEM surface morphologies of the Pd/GC, FeOx/GC, a-FeOx/GC, Pd/FeOx/GC, FeOx/Pd/GC and a-FeOx/Pd/GC catalysts. The Pd/GC catalyst (Fig. 4A) indicated the deposition of Pd in nanocubes of an average edge size of ca. 70 nm. Whereas the FeOx/GC catalyst (Fig. 4B) indicated the deposition of nano-FeOx mostly as individual intersected nanowires (ca. 40 nm in diameter and 150 nm in length). These nanowires appeared clustered intensively (white aggregates) in several areas. The catalyst's activation (a-FeOx/GC catalyst, Fig. 4C) did not change the nanowire texture but rather enhanced the fusion of aggregated particles. This denied the conceptional view of being nano-FeOx dissolved completely during activation. For the Pd/FeOx/GC catalyst (Fig. 4D), nano-Pd (ca. 90 nm) appeared relatively larger than in the Pd/GC catalyst (Fig. 4A) which agreed perfectly with the data in Fig. 1 (larger surface area of Pd in the Pd/FeOx/GC catalyst). Interestingly, when nano-FeOx was deposited onto the Pd/GC surface, the agglomeration of nano-FeOx disappeared significantly (Fig. 4E) but returned back after activation in a well-defined nanowire structured assembly (Fig. 4F). The exposure of the underneath Pd and GC surfaces were obvious in Fig. 4 E-F, which predicts the participation of nano-Pd in the catalysis of FAEO.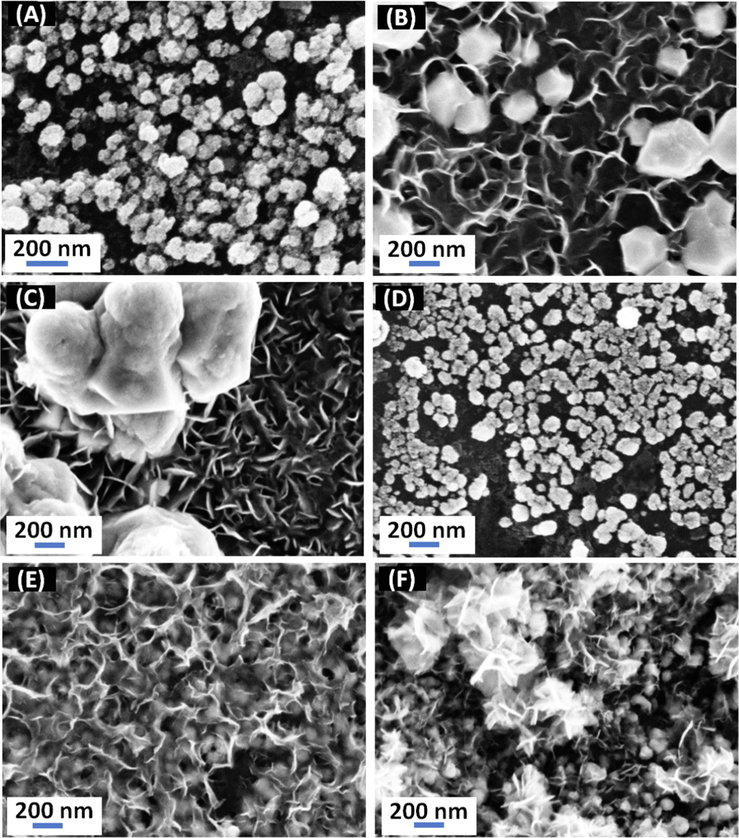
FE-SEM (high magnification) images for (A) Pd/GC, (B) FeOx/GC, (C) a-FeOx/GC, (D) Pd/FeOx/GC, (E) FeOx/Pd/GC and (F) a-FeOx/Pd/GC catalysts (4 potential cycles were applied for the deposition of nano-FeOx).
The elemental compositions of the catalysts were evaluated from the EDX analyses (Fig. 5). The relative compositions of the catalytic constituents of all catalysts are given in Table 1. The EDX measurements revealed the effective electrodeposition of Pd (43.90 wt%) and Fe (90.82 wt%) onto the Pd/GC and FeOx/GC electrodes, resepctively. The activation at –0.5 V led to reducing the amount of Fe (78.30 wt%) with the increase of oxygen content which accounted on the further oxidation and the possible dissolution of Fe. Data for the successive deposition of both metals on the GC substrate are shown in Fig. 5 and Table 1. For the Pd/FeOx/GC catalyst, the EDX spectrum could not detect Fe perhaps due to the complete coverage of Fe with Pd, taking into consideration the limitation of EDX to detect the small amount of Fe at the surface. However, in the case of FeOx/Pd/GC catalyst, the EDX spectrum detected both Fe (73.55 wt%) and Pd (15.21 wt%) which agreed with the layers' hierarchy.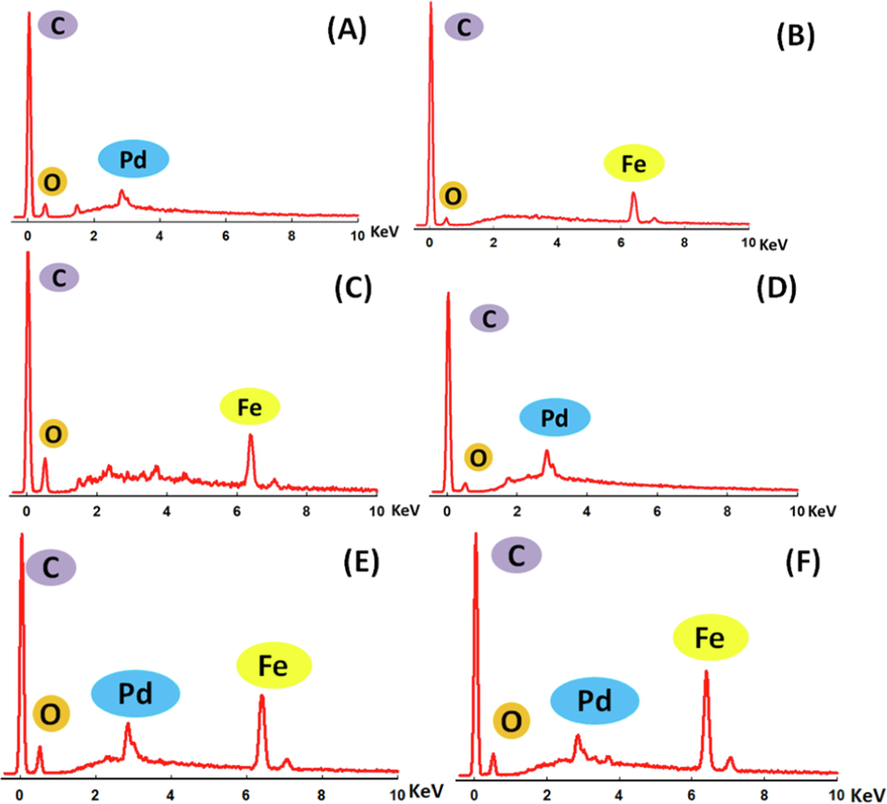
EDX spectra of (A) Pd/GC, (B) FeOx/GC, (C) a-FeOx/GC, (D) Pd/FeOx/GC, (E) FeOx/Pd/GC and (F) a-FeOx/Pd/GC catalysts (4 potential cycles were applied for the deposition of nano-FeOx).
Catalyst
Pd (mass %)
Fe (mass %)
O (mass %)
Pd/GC
43.90
0
56.10
FeOx/GC
0
90.82
9.18
a-FeOx/GC
0
78.30
21.70
Pd/FeOx/GC
59.41
0
40.59
FeOx/Pd/GC
15.21
73.55
11.24
a-FeOx/Pd/GC
22.03
60.89
17.08
Furthermore, the crystal structures of the Pd/GC, FeOx/Pd/GC and a-FeOx/Pd/GC catalysts were examined with the XRD technique (Fig. 6A). Fig. 6A (a) shows several diffraction peaks for the Pd/GC catalyst at ca. 25°, 39°, 43°, 64° and 78° corresponding, respectively, to the (0 0 2) plane of C (JCPDS card No. 075–1621) (Asal et al., 2022), (1 1 1), (2 0 0), (2 2 0) and (3 1 1) planes of Pd (JCPDS card No. 96–101-1105) (Asal et al., 2022) that reflected its face-centered cubic (fcc) structure (Al-Akraa et al., 2015). The XRD spectra of FeOx/Pd/GC and a-FeOx/Pd/GC (Fig. 6A (b and c)) showed no clear difference compared to the Pd/GC catalyst; recommending the retention of the same crystal structure of nano-Pd in all the catalysts. Unfortunately, the sensitivity of the spectroscope was not sufficient to detect nano-FeOx which existed at the electrode's surface. However, assembling of nano-FeOx in the FeOx/Pd/GC catalyst decreased the ratio of diffraction peak intensities of Pd (2 0 0): Pd (1 1 1) but it increased back after activation. The deposition of nano-FeOx onto the Pd (2 0 0) facet is presumable.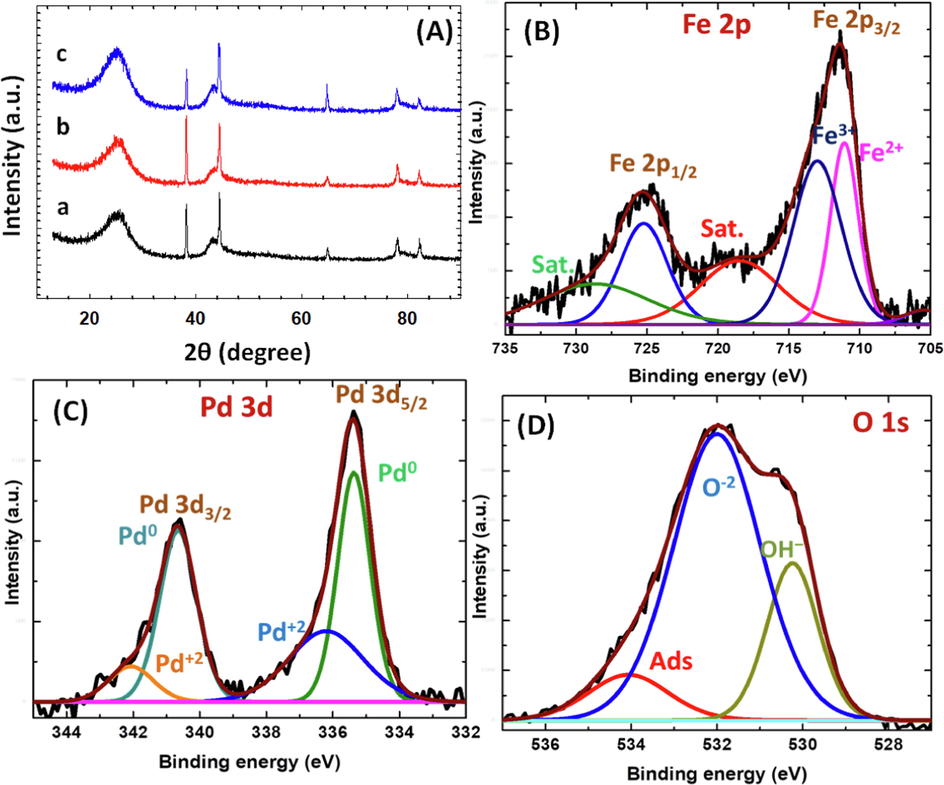
(A) XRD spectra of (a) Pd/GC, (b) FeOx/Pd/GC and (c) a-FeOx/Pd/GC catalysts. (B-D) XPS spectra of Fe 2p (B), Pd 3d (C) and O 1 s (D) peaks of FeOx/Pd/GC catalyst (4 potential cycles were applied for the deposition of nano-FeOx).
The chemical oxidation states of the elements at the surface of the FeOx/Pd/GC catalyst were estimated by XPS. The Fe 2p peak of the FeOx/Pd/GC catalyst was deconvoluted in two peaks at binding energies of 713.1 and 725.1 eV (Fig. 6B), which were assigned to the 2p3/2 and 2p1/2 peaks of Fe+3 (Al-Qodami et al., 2022a, 2022b). These peaks accompanied two shake-up satellites at 719.7 (Fe 2p3/2, sat) and 729.1 (Fe 2p1/2, sat) eV resulting from the charge transfer or shake-up processes associated with Fe+3. The peak observed at 710.7 was assigned to Fe+2 (Al-Qodami et al., 2022a, 2022b). Fig. 6C shows the Pd 3d spectrum for FeOx/Pd/GC catalyst that was deconvoluted into Pd 3d5/2 and Pd 3d3/2 at ca. 335 and 341 eV, respectively and assigned to metallic Pd (Maji et al., 2020). Two other peaks at 336.2 and 342.1 eV were assigned to Pd 3d5/2 and Pd 3d3/2 of PdO (Maji et al., 2020). These analyses of Pd 3d spectrum confirmed the existence of Pd at the surface in both Pd (0) and Pd (II) species. The O 1s peak in (Fig. 6D) was deconvoluted into three different peaks at ∼ 530, 532, and 534 eV corresponding, respectively, to the lattice oxygen of Fe—O—Fe bonding in FeOOH, lattice oxygen of Fe—O—H bonding in FeOOH and oxygen in the H—O—H bonding of chemisorbed water at the FeOOH surface (Al-Qodami et al., 2022a, 2022b). The presence of chemisorbed water confirmed the hydrated nature of nano-FeOx at the catalyst surface.
3.3 Formic acid electro-oxidation (FAEO):
3.3.1 Effect of deposition sequence
Fig. 7 shows the CVs of FAEO at the Pd/GC, Pd/FeOx/GC and FeOx/Pd/GC catalysts in 0.3 M FA (pH 3.5). In fact, the unmodified GC and the FeOx/GC catalysts did not show any electrocatalytic activity toward FAEO as was reported earlier (Al-Qodami et al., 2018). Fig. 7 revealed that the reaction pathway of FAEO on all (Pd/GC, Pd/FeOx/GC and FeOx/Pd/GC) catalysts proceeded exclusively via the dehydrogenation pathway that produced directly CO2 at ca. 100 mV. Nothing indicated the operation of the “dehydration” pathway that releases the poisoning CO as an intermediate (Baik et al., 2011, Al-Akraa et al., 2015). The intensity of the peak current density (ip) of FAEO was taken as an index to probe the activity of the catalysts. The relative increase (2 times that of the Pd/GC catalyst) in the ip of the Pd/FeOx/GC catalyst interpreted the role of nano-FeOx in orienting the deposition of nano-Pd in preferable facets for FAEO. Interestingly, the FeOx/Pd/GC catalyst exhibited a sevenfold increase in ip (in relative to that of the Pd/GC catalyst) that turned this structural hierarchy of this catalyst desirable. Interestingly, the activity of FeOx/Pd/GC catalyst toward FAEO bettered to a great extent many other catalysts in literature, as indicated in Table 2 (Al-Akraa et al., 2015a, Al-Akraa et al., 2015b, Al-Akraa et al., 2015c).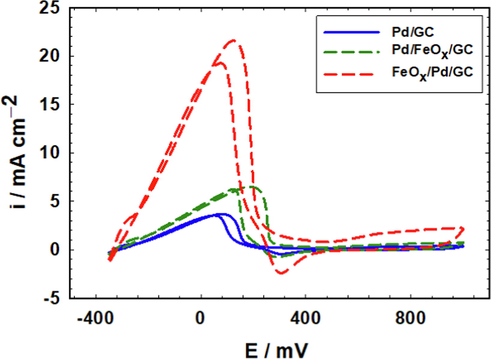
CVs obtained at Pd/GC, Pd/FeOx/GC and FeOx/Pd/GC catalysts in 0.3 M FA (pH 3.5) (4 potential cycles were applied for the deposition of nano-FeOx).
Catalyst
ip / mA cm−2
Ref.
Pd/GC
2.50
Al-Akraa et al., 2015
Pt/Pd/GC
1.23
Al-Akraa et al., 2015
Ir/Pd/GC
6.00
Al-Akraa et al., 2015
NiOx/Pd/GC
8.00
Al-Akraa et al., 2015
a-FeOx/Pd/GC
17.5
This work
FeOx/Pd/GC
21.6
This work
3.3.2 Effect of nano-FeOx loading
Furthermore, Fig. 8 shows the linear sweep voltammetry (LSV) of FAEO obtained at the Pd/GC and FeOx/Pd/GC catalysts (nano-FeOx was deposited for various deposition cycles). Obviously, four cycles of nano-FeOx deposition onto the Pd/GC catalyst exhibited the highest ip. This matched the unique characteristic behavior that was observed for the same loading in Fig. 2. In Fig. 2B, the intensity of the reduction peaks of nano-FeOx (at −800 mV) increased with increasing the number of deposition cycles due to the increase in the amount of nano-FeOx. It was believed that increasing the amount of nano-FeOx might lead to a catalytically more active (higher ip in Fig. 8) surface, which did not happen all the way forward. Indeed, this verified for 2 and 4 cycles but declined for further loadings (5 and 6 cycles) of nano-FeOx. This can be realized in view of the dependence of the electrocatalytic activity of the FeOx/Pd/GC on the available surface area of Pd. Therefore, after certain coverage (N = 4) of nano-FeOx in the FeOx/Pd/GC catalyst, the decrease in the surface area of nano-Pd led to a corresponding decrease in the catalytic activity of the catalyst where the Pd area became limiting for the kinetics of FAEO (El-Nagar et al., 2012). The real surface area (calculated from the charge consumed during the reduction of the Pd oxide surface in 0.5 M H2SO4 using a reported value of 420 μC cm−2) and the electrocatalytic activity of all prepared catalysts are summarized in Table 3.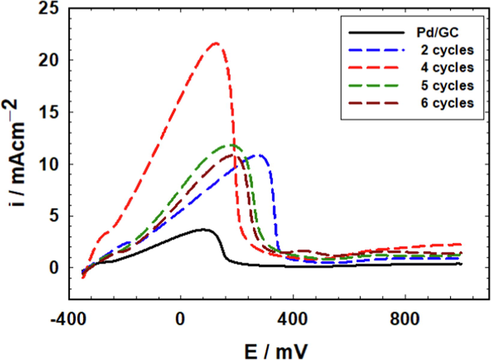
LSVs obtained in 0.3 M FA (pH 3.5) at the unmodified Pd/GC (solid black line) and FeOx modified Pd/GC (dashed lines) catalysts (Legend indicates the no. of cycles involved in the deposition of nano-FeOx).
Catalyst
No. of deposition cycles of nano-FeOx
Real surface area / cm2
ip / mA cm−2
Pd/GC
0
0.58
3.66
FeOx/Pd/GC
2
0.51
11.0
FeOx/Pd/GC
4
0.42
21.6
FeOx/Pd/GC
5
0.21
12.0
FeOx/Pd/GC
6
0.16
10.8
Pd/FeOx/GC
4
0.57
6.52
a-FeOx/Pd/GC
4
0.53
17.5
3.3.3 Effect of activation
The effect of activation on the catalysis of FAEO is represented in Fig. 9. The catalytic activity of FAEO did not change much after the activation of the FeOx/Pd/GC catalyst. The ip of FAEO decreased from 21.5 mA cm−2 (before activation) to 17.5 mA cm−2 (after activation). The reason may originate from a partial dissolution of nano-FeOx after activation as revealed from EDX data (Table 1) that influenced the catalyst's activity.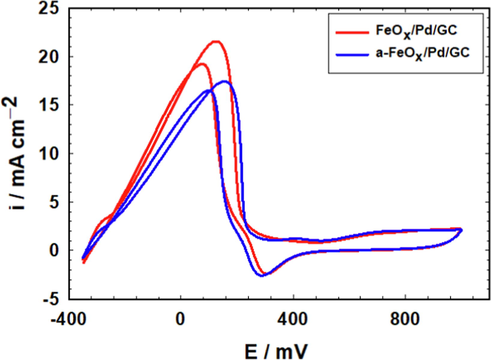
CVs obtained at FeOx/Pd/GC and a-FeOx/Pd/GC catalysts in 0.3 M FA (pH 3.5) (4 potential cycles were applied for the deposition of nano-FeOx).
3.4 Stability toward FAEO
Long-term stabilities of catalysts are essential for a practical application of DFAFCs. Fig. 10 foresees the relative catalysts' stabilities, in which the current transients (i-t) were measured at the Pd/GC, Pd/FeOx/GC, FeOx/Pd/GC and a-FeOx/Pd/GC catalysts in 0.3 M FA (pH 3.5) at 100 mV. It is obvious that the Pd/GC and the Pd/FeOx/GC catalysts possessed poor stabilities toward FAEO as reflected from their fast-chronical current decay; in agreements with previous reports (Hong et al., 2011, Al-Akraa et al., 2015). The FeOx/Pd/GC and a-FeOx/Pd/GC catalysts exhibited slower current decays and ended up with much better activities (1.0 and 1.2 mA cm−2 at the FeOx/Pd/GC and a-FeOx/Pd/GC catalysts, respectively). The superiority of the a-FeOx/Pd/GC in persisting the outmost durability might originate from the conversion of Fe to higher oxides capable to mitigate the possible surface poisoning and/or improve the mechanical properties of the surface film of the catalytic ingredients. Turnover frequencies (TOF) of the catalysts (Table 4) were calculated to assess the intrinsic activity of the catalysts and the efficiency of their active sites (Anantharaj et al., 2021). The better durability and intrinsic activity of the FeOx/Pd/GC and a-FeOx/Pd/GC catalysts supported their improved efficiency toward FAEO. This could possibly originate with the electronic amendment that nano-FeOx made for the electronic properties of Pd at the catalyst's surface against poisoning or dissolution of the catalytic ingredients (Hu et al., 2012). Deeper insights for FAEO reaction mechanism at the FeOx/Pd/GC catalyst will soon be investigated.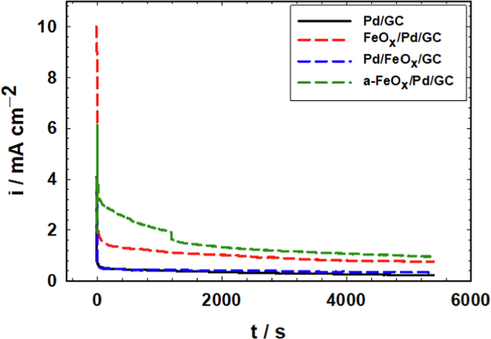
Current transients (i-t) measured at Pd/GC, Pd/FeOx/GC, FeOx/Pd/GC and a-FeOx/Pd/GC catalysts in 0.3 M FA (pH 3.5) at 100 mV (4 potential cycles were applied for the deposition of nano-FeOx).
Catalyst
TOF (s−1)
Pd/GC
0.113
Pd/FeOx/GC
0.135
FeOx/Pd/GC
0.526
a-FeOx/Pd/GC
0.593
3.5 Origin of enhancement
To appraise the role of nano-FeOx in the catalytic improvement toward FAEO, carbon monoxide (CO) stripping voltammetry was carried out at the Pd/GC, FeOx/Pd/GC and a-FeOx/Pd/GC catalysts in 0.5 mol L–1 H2SO4 at 50 mV s−1 (Fig. 11A) after allowing CO to be adsorbed at the catalysts’ surfaces from 0.5 M FA at open circuit potential (OCP) for 15 min. The CO oxidation peak appeared at ca. 0.8 V with a current density of 0.14 mA cm−2 at the Pd/GC catalyst. This peak appeared at ca. 0.6 and 0.58 V with ca. 0.097 and 0.107 mA cm−2 for the FeOx/Pd/GC and a-FeOx/Pd/GC catalysts, respectively (Fig. 11A). The large negative shift (ca. −200 mV) of the CO oxidation peak potential at the FeOx/Pd/GC and a-FeOx/Pd/GC catalysts strengthened the electronic influence of nano-FeOx in the catalytic enhancement. The integrated areas below the CO desorption peaks of the FeOx/Pd/GC and a-FeOx/Pd/GC catalysts looked a little smaller than that of the Pd/GC catalyst; recommending a better mitigation of CO poisoning.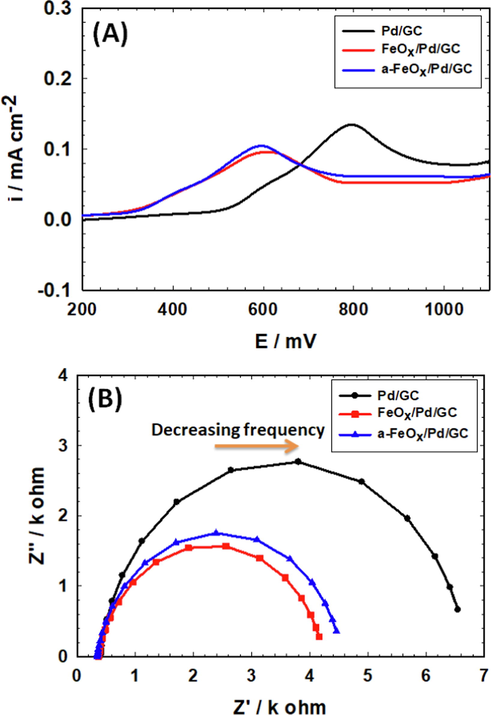
Oxidative stripping of CO from the Pd/GC, FeOx/Pd/GC and a-FeOx/Pd/GC catalysts in 0.5 M H2SO4 at scan rate 50 mV s−1 (A). Nyquist plots (at open circuit potentials) for the same catalysts measured in 0.3 M FA (pH 3.5) (B) (4 potential cycles were applied for the deposition of nano-FeOx).
The electrochemical impedance spectra (EIS) of the Pd/GC, FeOx/Pd/GC and a-FeOx/Pd/GC catalysts were carried out in 0.3 M FA (pH 3.5) at OCP. The solution resistance (Rs), charge transfer resistance (Rct) and constant phase element (CPE) of the catalysts were depicted by EIS using Randle’s equivalent circuit model (data are listed in Table 5) (Al-Akraa et al., 2017, Ye et al., 2017). The Nyquist plots appeared in Fig. 11B show semicircles with arc diameters that increased in the order of Pd/GC > a-FeOx/Pd/GC > FeOx/Pd/GC catalysts, indicating the lowest Rct for the FeOx/Pd/GC catalyst. On the other hand, the increases in the CPE of the catalysts from Pd/GC, a-FeOx/Pd/GC to FeOx/Pd/GC revealed similar improvement in the number of active sites at the catalysts' surface which led to better catalytic activities (Shervedani and Bagherzadeh 2008).
Catalyst
Rs [kΩ]
Rct [kΩ]
CPE [µFs(α-1)]
α
Pd/GC
0.401
6.301
26.79
0.9195
FeOx/Pd/GC
0.366
4.212
29.73
0.8849
a-FeOx/Pd/GC
0.342
3.872
32.17
0.8724
4 Conclusion
An efficient binary nanocatalyst for FAEO was prepared by a simple modification of the GC catalyst with nano-Pd and nano-FeOx. The deposition sequence of nano-Pd and nano-FeOx on the GC catalyst and the loading level of nano-FeOx affected intensively the catalytic activity and stability of the catalyst toward FAEO. The highest catalytic activity (ca. 7 times compared to “pristine” Pd/GC catalyst) was obtained at the FeOx/Pd/GC catalyst (where 4 cycles were employed for the deposition of nano-FeOx onto the Pd/GC catalyst). The XPS data confirmed the retention of nano-FeOx at the surface of the FeOx/Pd/GC in two different oxidation states Fe (II, minor) and Fe (III, major). Moreover, the activation of the FeOx/Pd/GC catalyst at –0.5 V improved the catalyst's stability. The CO stripping voltammetry and EIS confirmed the electronic role in the catalytic enhancement.
Acknowledgment
This work was supported by the Faculty of Science at Cairo University and The British University in Egypt.
Data availability
Data will be made available on request.
Declaration of Competing Interest
The authors declare that they have no known competing financial interests or personal relationships that could have appeared to influence the work reported in this paper.
References
- Optical and electrochemical study of electrocatalysis by foreign metal adatoms: Oxidation of formic acid on rhodium. J. Electroanal. Chem. Interfacial Electrochem.. 1979;99:43-53.
- [CrossRef] [Google Scholar]
- Palladium(II)-catalyzed oxidation of formic acid in acetic acid solution. J. Catal.. 1969;13:283-289.
- [CrossRef] [Google Scholar]
- Catalysts in direct ethanol fuel cell (DEFC): an overview. Int. J. Hydrogen Energy.. 2016;41:4214-4228.
- [CrossRef] [Google Scholar]
- Advances in direct formic acid fuel cells: fabrication of efficient Ir/Pd nanocatalysts for formic acid electro-oxidation. Int. J. Electrochem. Sci.. 2015;10:3282-3290. 10(2015)3282-3290
- [Google Scholar]
- Self-assembling of gold nanoparticles array for electro-sensing applications. Int. J. Electrochem. Sci.. 2013;8:458-466.
- [Google Scholar]
- Electrocatalysis by design: Synergistic catalytic enhancement of formic acid electro-oxidation at core-shell Pd/Pt nanocatalysts. Int. J. Hydrogen Energy.. 2015;40:1789-1794.
- [CrossRef] [Google Scholar]
- Electrocatalysis by nanoparticle: Enhanced electro-oxidation of formic acid at NiOx-Pd binary nanocatalysts. J. Electrochem. Soc.. 2015;162:F1114-F1118.
- [CrossRef] [Google Scholar]
- Flower-shaped gold nanoparticles: Preparation, characterization, and electrocatalytic application. Arab. J. Chem.. 2017;10:877-884.
- [CrossRef] [Google Scholar]
- Boosted performance of NiOx/Pt nanocatalyst for the electro-oxidation of formic acid: a substrate's functionalization with multi-walled carbon nanotubes. Arab. J. Chem.. 2021;14
- [CrossRef] [Google Scholar]
- A competent MWCNT-Grafted MnOx/Pt nanoanode for the direct formic acid fuel cells. J. Chem.. 2022;2022
- [CrossRef] [Google Scholar]
- A spin-coated TiOx/Pt nanolayered anodic catalyst for the direct formic acid fuel cells. Arab. J. Chem.. 2020;13:4703-4711.
- [CrossRef] [Google Scholar]
- Bifunctional tailoring of platinum surfaces with earth abundant iron oxide nanowires for boosted formic acid electro-oxidation. J. Nanotechnol.. 2018;2018
- [CrossRef] [Google Scholar]
- Surface engineering of nanotubular ferric oxyhydroxide “goethite” on platinum anodes for durable formic acid fuel cells. Int. J. Hydrogen Energy.. 2022;47:264-275.
- [CrossRef] [Google Scholar]
- Tailor-designed nanowire-structured iron and nickel oxides on platinum catalyst for formic acid electro-oxidation. RSC Adv.. 2022;12:20395-20402.
- [CrossRef] [Google Scholar]
- The Significance of Properly Reporting Turnover Frequency in Electrocatalysis Research. Angewandte Chemie – Int. Ed.. 2021;60:23051-23067.
- [CrossRef] [Google Scholar]
- Preparation of Co-electrodeposited Pd-Au Nanocatalyst for Methanol Electro-oxidation. Int. J. Electrochem. Sci.. 2021;16:1-11.
- [CrossRef] [Google Scholar]
- Augmented formic acid electro-oxidation at a co-electrodeposited Pd/Au nanoparticle catalyst. J. Saudi Chem. Soc.. 2022;26
- [CrossRef] [Google Scholar]
- Effect of deactivation and reactivation of palladium anode catalyst on performance of direct formic acid fuel cell (DFAFC) Int. J. Hydrogen Energy.. 2011;36:14719-14724.
- [CrossRef] [Google Scholar]
- Electrocatalysis: a direct alcohol fuel cell and surface science perspective. Catal. Today.. 2013;202:197-209.
- [CrossRef] [Google Scholar]
- Anodic oxidation of formic acid on platinum—I. Adsorption of formic acid, oxygen, and hydrogen in perchloric acid solutions. Electrochim. Acta.. 1963;8:447-456.
- [CrossRef] [Google Scholar]
- Development and electrochemical studies of membrane electrode assemblies for polymer electrolyte alkaline fuel cells using FAA membrane and ionomer. J. Power Sources.. 2013;230:169-175.
- [CrossRef] [Google Scholar]
- An effective Pd-Ni2P/C anode catalyst for direct formic acid fuel cells. Angewandte Chemie - International Edition.. 2014;53:122-126.
- [CrossRef] [Google Scholar]
- Investigation on formate oxidation on palladium and strategies for improving performance in alkaline direct formate fuel cells. Gwangju Institute of Science and Technology, South Korea; 2016. Doctoral Thesis
- Mesoporous Ti0.5Cr0.5N supported PdAg nanoalloy as highly active and stable catalysts for the electro-oxidation of formic acid and methanol. ACS Nano. 2014;8:6106-6113.
- [CrossRef] [Google Scholar]
- An electrochemical impedance study of the oxygen evolution reaction at hydrous iron oxide in base. Phys. Chem. Chem. Phys.. 2013;15:5224-5237.
- [CrossRef] [Google Scholar]
- Hydrogen-based systems for integration of renewable energy in power systems: achievements and perspectives. Int. J. Hydrogen Energy.. 2021;46:31963-31983.
- [CrossRef] [Google Scholar]
- Impurities contributing to catalysis: enhanced electro-oxidation of formic acid at Pt/GC electrodes in the presence of vinyl acetate. J. Phys. Chem. C.. 2014;118:22457-22464.
- [CrossRef] [Google Scholar]
- Structure sensitivity of formic acid electrooxidation on transition metal surfaces: a first-principles study. J. Electrochem. Soc.. 2018;165:J3109-J3121.
- [CrossRef] [Google Scholar]
- Facilitated electro-oxidation of formic acid at nickel oxide nanoparticles modified electrodes. J. Electrochem. Soc.. 2012;159:F249-F254.
- [CrossRef] [Google Scholar]
- Electrocatalysis by design: Enhanced electrooxidation of formic acid at platinum nanoparticles-nickel oxide nanoparticles binary catalysts. Electrochim. Acta. 2013;94:62-71.
- [CrossRef] [Google Scholar]
- Promoting effect of hydrocarbon impurities on the electro-oxidation of formic acid at Pt nanoparticles modified GC electrodes. Electrochim. Acta.. 2015;180:268-279.
- [CrossRef] [Google Scholar]
- Electro-oxidation of formic acid at binary platinum and gold nanoparticle-modified electrodes: effect of chloride ions. Int. J. Electrochem. Sci.. 2014;9:4523-4534.
- [Google Scholar]
- El-Nagar, G.A., Mohammad, A.M., El-Deab, M.S., et al., 2014. Electrocatalysis by nanoparticles: Oxidation of formic acid at novel Pt/NiOx nanoparticles-based binary catalysts. International Conference on Industry Academia Collaboration (IAC2014), Fairmont Hotel, Cairo, Egypt.
- Propitious dendritic Cu2O-Pt nanostructured anodes for direct formic acid fuel cells. ACS Appl. Mater. Interfaces.. 2017;9:19766-19772.
- [CrossRef] [Google Scholar]
- Formic acid as a hydrogen energy carrier. ACS Energy Lett.. 2017;2:188-195.
- [CrossRef] [Google Scholar]
- Optimized nickel-cobalt and nickel-iron oxide catalysts for the hydrogen evolution reaction in alkaline water electrolysis. J. Electrochem. Soc.. 2019;166:F519-F533.
- [CrossRef] [Google Scholar]
- Electro-oxidation of formic acid on the iridium electrode as a function of pH. Electrochim. Acta.. 1993;38:1631-1636.
- [CrossRef] [Google Scholar]
- Enhancing the cycling stability of transition-metal-oxide-based electrochemical electrode via pourbaix diagram engineering. Energy Storage Mater.. 2021;42:252-258.
- [CrossRef] [Google Scholar]
- Effects of the addition of antimony, Tin, and lead to palladium catalyst formulations for the direct formic acid fuel cell. J. Phys. Chem. C.. 2010;114:11665-11672.
- [CrossRef] [Google Scholar]
- Performance characterization of direct formic acid fuel cell using porous carbon-supported palladium anode catalysts. Korean J. Chem. Eng.. 2009;26:1040-1046.
- [CrossRef] [Google Scholar]
- Effects of Pt/C, Pd/C and PdPt/C anode catalysts on the performance and stability of air breathing direct formic acid fuel cells. Int. J. Hydrogen Energy.. 2011;36:8518-8524.
- [CrossRef] [Google Scholar]
- Structural effects of electrochemical oxidation of formic acid on single crystal electrodes of palladium. J. Phys. Chem. B.. 2006;110:12480-12484.
- [CrossRef] [Google Scholar]
- Electronic effect on oxidation of formic acid on supported Pd-Cu bimetallic surface. Electrochim. Acta.. 2012;83:354-358.
- [CrossRef] [Google Scholar]
- Electronic effect of Pd-transition metal bimetallic surfaces toward formic acid electrochemical oxidation. Electrochem. Commun.. 2014;38:107-109.
- [CrossRef] [Google Scholar]
- Reaction pathways derived from DFT for understanding catalytic decomposition of formic acid into hydrogen on noble metals. Int. J. Hydrogen Energy.. 2012;37:15956-15965.
- [CrossRef] [Google Scholar]
- Characterization and application of electrodeposited Pt, Pt/Pd, and Pd catalyst structures for direct formic acid micro fuel cells. Electrochim. Acta.. 2005;50:4674-4682.
- [CrossRef] [Google Scholar]
- Unexpected activity of palladium on vanadia catalysts for formic acid electro-oxidation. Electrochem. Solid-State Lett.. 2005;8:A291-A293.
- [CrossRef] [Google Scholar]
- Surface-rearranged Pd3Au/C nanocatalysts by using CO-induced segregation for formic acid oxidation reactions. ACS Catal.. 2014;4:2402-2408.
- [CrossRef] [Google Scholar]
- Preparation of carbon supported Pd-Pb hollow nanospheres and their electrocatalytic activities for formic acid oxidation. Electrochem. Commun.. 2010;12:901-904.
- [CrossRef] [Google Scholar]
- High Active Carbon Supported PdAu Catalyst for Formic Acid Electrooxidation and Study of the Kinetics. J. Phys. Chem. C.. 2010;114:21417-21422.
- [CrossRef] [Google Scholar]
- Carbon-supported PdSn nanoparticles as catalysts for formic acid oxidation. Electrochem. Commun.. 2009;11:1667-1670.
- [CrossRef] [Google Scholar]
- Nanostructured PdRu/C catalysts for formic acid oxidation. J. Solid State Electrochem.. 2012;16:545-550.
- [CrossRef] [Google Scholar]
- Palladium-Based Catalysts Supported by Unsymmetrical XYC–1 Type Pincer Ligands: C5 Arylation of Imidazoles and Synthesis of Octinoxate Utilizing the Mizoroki-Heck Reaction. Eur. J. Inorg. Chem.. 2020;2020:1596-1611.
- [CrossRef] [Google Scholar]
- Direct synthesis of formic acid as hydrogen carrier from CO2 for cleaner power generation through direct formic acid fuel cell. Int. J. Hydrogen Energy.. 2021;46:13050-13060.
- [Google Scholar]
- Selective hydrogenation of biomass-derived 5-hydroxymethylfurfural (HMF) to 2,5-dimethylfuran (DMF) under atmospheric hydrogen pressure over carbon supported PdAu bimetallic catalyst. Catal. Today.. 2014;232:89-98.
- [CrossRef] [Google Scholar]
- Electrochemical investigation of Pd–Co thin films binary alloy for the oxygen reduction reaction in acid medium. J. Electroanal. Chem.. 2013;703:108-116.
- [CrossRef] [Google Scholar]
- Adsorption and electro-oxidation of carbon monoxide, methanol, ethanol and formic acid on osmium electrodeposited on glassy carbon. J. Electroanal. Chem.. 2000;484:64-72.
- [CrossRef] [Google Scholar]
- Architecture for portable direct liquid fuel cells. J. Power Sources.. 2006;154:202-213.
- [CrossRef] [Google Scholar]
- Improvement and mechanism of electrocatalytic performance of Pd-Ni/C anodic catalyst in direct formic acid fuel cell. Electrochim. Acta.. 2013;89:497-502.
- [CrossRef] [Google Scholar]
- Hydroxamation of gold surface via in-situ layer-by-layer functionalization of cysteamine self-assembled monolayer: Preparation and electrochemical characterization. Electrochim. Acta.. 2008;53:6293-6303.
- [CrossRef] [Google Scholar]
- Shaped Pd-Ni-Pt core-sandwich-shell nanoparticles: Influence of Ni sandwich layers on catalytic electrooxidations. ACS Nano. 2014;8:7239-7250.
- [CrossRef] [Google Scholar]
- New Insight into the Decomposition Mechanism of Formic Acid on Pd(111): Competing Formation of CO2 and CO. J. Phys. Chem. C. 2014;118:2067-2076.
- [CrossRef] [Google Scholar]
- Electrocatalytic performance of PdCo-C catalyst for formic acid oxidation. Electrochem. Commun.. 2008;10:1644-1646.
- [CrossRef] [Google Scholar]
- Electrochemical investigation of formic acid electro-oxidation and its crossover through a Nafion® membrane. J. Electroanal. Chem.. 2004;562:73-80.
- [CrossRef] [Google Scholar]
- Carbon-supported Pd-Ir catalyst as anodic catalyst in direct formic acid fuel cell. J. Power Sources.. 2008;175:784-788.
- [CrossRef] [Google Scholar]
- Carbon-supported Pd–Cr electrocatalysts for the electrooxidation of formic acid that demonstrate high activity and stability. Electrochim. Acta.. 2013;109:201-206.
- [CrossRef] [Google Scholar]
- Investigation of the mechanism of the electrochemical oxidation of formic acid at a gold electrode in sulfuric acid solution. J. Electroanal. Chem.. 2001;517:95-100.
- [CrossRef] [Google Scholar]
- Pt4PdCu0.4 alloy nanoframes as highly efficient and robust bifunctional electrocatalysts for oxygen reduction reaction and formic acid oxidation. Nano Energy. 2017;39:532-538.
- [CrossRef] [Google Scholar]
- Recent advances in direct formic acid fuel cells (DFAFC) J. Power Sources. 2008;182:124-132.
- [CrossRef] [Google Scholar]
- Atomic ensemble effects on formic acid oxidation on PdAu electrode studied by first-principles calculations. J. Power Sources.. 2013;224:241-249.
- [CrossRef] [Google Scholar]
- Zhang J., ed. PEM Fuel Cell ElectroCatalysts and Catalyst Layers: Fundamentals and Applications. London: Springer; 2008.
- Insights into the preference of CO2 formation from HCOOH decomposition on Pd surface: a theoretical study. J. Phys. Chem. C. 2012;116:22266-22280.
- [CrossRef] [Google Scholar]
- Facile synthesis of PtAu alloy nanoparticles with high activity for formic acid oxidation. J. Power Sources.. 2010;195:1103-1106.
- [CrossRef] [Google Scholar]


