

Translate this page into:
An approach to design potent anti-Alzheimer’s agents by 3D-QSAR studies on fused 5,6-bicyclic heterocycles as γ-secretase modulators using kNN–MFA methodology
2nd Heterocyclic Update
*Corresponding author. Tel.: +91 7879605622; fax: +91 2563251808 kamlendra.bhadoriya@gmail.com (Kamlendra Singh Bhadoriya) kamlendra.bhadoriya@yahoo.com (Kamlendra Singh Bhadoriya)
-
Received: ,
Accepted: ,
This article was originally published by Elsevier and was migrated to Scientific Scholar after the change of Publisher.
Available online 16 February 2013

Peer review under responsibility of King Saud University.
Abstract
Alzheimer’s disease (AD) is a chronic neurodegenerative disease. Current therapies of AD are only symptomatic, therefore the need for the development of new therapies to treat Alzheimer’s disease effectively. To achieve this objective quantitative structure–activity relationship (QSAR) studies were carried out as it provides the rationale for the changes in the structure to have more potent Aβ42 inhibitors or anti-Alzheimer’s agents. Quantitative structure–activity relationship (QSAR) studies were carried out on a series of 34 fused 5,6-bicyclic heterocycles to investigate the structural requirements of their inhibitory activity against Aβ42. The statistically significant best 3D-QSAR model having cross-validated squared correlation coefficient q2 = 0.8457 with external predictive ability of pred_r2 = 0.7556 was developed by SW-kNN. Developed kNN–MFA model highlighted the importance of shape of the molecules, i.e., hydrophobic and steric descriptors at the grid points H_83 and S_183, S_227 for γ-secretase binding interaction. This model (3D) was found to yield reliable clues for further optimization of fused 5,6-bicyclic heterocycles in the data set. The information rendered by the 3D-QSAR model may lead to a better understanding of the structural requirements of γ-secretase modulators and can also help in the design of novel potent γ-secretase modulators.
Keywords
Alzheimer’s disease
γ-Secretase modulators
Fused 5,6-bicyclic heterocycles
3D-QSAR
kNN–MFA
Hydrophobic and steric descriptors

1 Introduction
AD is a neurodegenerative disorder associated with difficulties in memory, judgment, abstraction, and language (Kim and Kim, 2008). More than 35 million people suffer from AD worldwide, with an estimated annual cost of over $600 billion, and the AD population may increase to more than 115 million by the year 2050 according to a report from Alzheimers Disease International (Sun et al., 2012). Alzheimer’s disease (AD) symptoms are dementia, apraxia, aphasia, depression, short attention span, visuospatial navigation deficits, anxiety and delusions (Harvey et al., 2011). The majority of AD cases are sporadic, with disease onset after 65 years of age (Iijima-Ando and Iijima, 2010). Key molecules involved in AD, include the presenilins, amyloid precursor protein, tau, and β-amyloid (Balaraman et al., 2006).
Alzheimer’s disease (AD) is the biggest unmet medical need in neurology due to the lack of disease-modifying anti-Alzheimer’s drugs (DMAADs) (Kreft et al., 2008). Over the last decade, γ-secretase emerged as a promising target for the treatment of AD (Xin et al., 2011). It has been postulated that modulation of γ-cleavage to favor the production of shorter fragments, while not affecting total Aβ levels, might be a safe approach to a disease-modifying therapy (Fischer et al., 2011). γ-Secretase activity can be controlled by the inhibition of the active site of PS1 or by interference with complex assembly or substrate recognition, the latter resulting in allosteric modulation or inhibition. The allosteric mechanisms are particularly attractive targets for drug development (Narlawar et al., 2007), as they may produce shorter, soluble, and non-toxic peptides (e.g., Aβ36–Aβ40) instead of the highly insoluble and neurotoxic Aβ42, without interfering in the processing of Notch and other substrates (Caldwell et al., 2010). γ-Secretase modulators (GSMs) modulate the cleavage of the APP C-terminal fragment such as C-99 to decrease Aβ42 and increase the shorter Aβ fragments (e.g., Aβ37/38) while not affecting the cleavage of other substrates such as Notch (Fischer et al., 2011). The fact that an increase as small as 30% in the levels of Aβ42 can cause familial AD suggests that lowering Aβ42 by a similar amount could have a disease-modifying effect. This suggests that this degree of Notch-sparing selectivity may be sufficient to avoid mechanism-based toxicity (Kreft et al., 2008).
γ-Secretase modulation is more desirable than inhibition from a therapeutic perspective and may reduce the risk of mechanism-based toxicities (Xin et al., 2011). Such compounds, called Notch-sparing GSIs (NS-GSIs) or γ-secretase modulators (GSMs), would be good candidates for AD therapeutics (Kurosumi et al., 2010).
Computational chemistry has developed into an important contributor to rational drug design. Molecular modeling study is an approach used to narrow down a library containing an extraordinarily high number of random molecules into a smaller list of potentially effective inhibitors. The techniques of QSAR are valuable molecular modeling tools for drug design. The quantitative structure activity relationship (QSAR) approach became very useful and largely widespread for the prediction of biological activities, particularly in drug design. The QSAR method provides a rational basis for understanding mechanisms of biological performance and shows how to improve performance by altering chemical structures of ligands, which has been proved to be one of the most embraced computational approaches in modern drug discovery (Bhadoriya et al., 2012b; Chen et al., 2009; Jain et al., 2012a,b,c). Quantitative structure activity relationship (QSAR) is one of the major tools in drug discovery to explore ligand–receptor/enzyme interactions, especially when either the structural details of the target are not known or protein binding data of ligand is unavailable. Quantitative structure–activity relationship (QSAR) studies leading to models in terms of chemical structures and their biological activities produce useful information for drug design and medicinal chemistry. 2D-QSAR does not involve complex alignment or assumptions on conformations (Joshi et al., 2010). 3D-QSAR is a broad term encompassing all those QSAR methods which correlate macroscopic target properties with computed atom-based descriptors derived from the spatial (3D) representation of the molecular structures (Verma et al., 2010). The 3D-QSAR protocols have been selected with a view to understand the ligand–receptor interaction in the light of steric, electrostatic and hydrophobic properties (Ghosh and Bagchi, 2009a). Three dimensional quantitative structure activity relationship (3D-QSAR) is a widely used tool to identify the steric, electrostatic, and hydrophobic structural requirements of various drugs acting via receptor modulation for exerting biological activity. Development of the 3D-QSAR model based on the biological activity of compounds enables ligand-based drug design that guides experimental chemical synthesis of compounds with higher potency even when the 3D structure of the biological target is unknown (Bhadoriya et al., 2012a,b,d; Mathura et al., 2010; Sharma et al., 2012).
Previously, we have reported 2D-QSAR studies on a series of fused 5,6-bicyclic heterocycles such as γ-secretase modulators (GSMs) with classical 2D descriptors. MLR method was used to generate statistically significant 2D-QSAR models (Bhadoriya et al., 2012c). Now, in continuation with our earlier work, we report 3D-QSAR studies on such a series of fused 5,6-bicyclic heterocycles with classical 3D descriptors. The present work is an attempt to generate predictive 3D-QSAR models based on 3D-QSAR methods and to find the structural features of fused 5,6-bicyclic heterocycles as γ-secretase modulators (GSMs) required for Aβ42 inhibitory activities to guide the rational synthesis of novel γ-secretase modulators (GSMs). 3D-QSAR field descriptors i.e. steric, electrostatic and hydrophobic are useful for the better understanding of molecular modeling studies of this series of compounds in terms of ligand–receptor interactions. In this investigation, a widely used technique, viz. stepwise (SW) has been applied for descriptor optimization, and kNN–MFA analysis has been applied for 3D-QSAR model development. The developed model provides insight into the influence of various interactive fields on the activity and, thus, can help in designing and forecasting the Aβ42 inhibitory activities of fused 5,6-bicyclic heterocycles.
2 Experimental work
The molecular modeling studies (3D-QSAR) were carried out on a Windows XP workstation using the molecular modeling software package VLife Molecular Design Suite (VLifeMDS) version 3.5 (VLife MDS 3.5, 2008).
2.1 Biological activity dataset for analysis
A set of 34 fused 5,6-bicyclic heterocycles as γ-secretase modulators (GSMs) reported by Qin et al. (Qin et al., 2011), were selected for Aβ42 inhibitory activity requirements. The structures, biological activity and predicted activity data are given in Table 1. Aβ42 inhibitory activity was reported as IC50 in nM units. For the 3D-QSAR study the reported IC50 was converted to negative logarithm (pIC50) in molar units and subsequently used as the dependent variable for the 3D-QSAR analysis.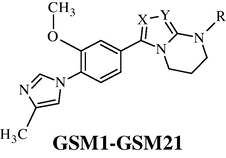
 .
.
Compound_ID
R
X
Y
Observed activity Aβ42IC50 (nM)
Observed activity (Aβ42pIC50)
Stepwise forward kNN–MFA
Predicted Activity (Aβ42pIC50)
Residual
GSM1
H
N
N
20,000
4.70
4.7
0
GSM2
N
N
509
6.29
6.31
−0.02
GSM3a
N
N
156
6.81
6.94
−0.13
GSM4
N
N
145
6.84
6.94
−0.1
GSM5
N
N
16,374
4.79
4.7
0.09
GSM6

N
N
20,000
4.70
4.79
−0.09
GSM7a
N
N
649
6.19
6.21
−0.02
GSM8
N
N
342
6.47
6.79
−0.32
GSM9
N
N
116
6.94
6.84
0.1
GSM10a

N
N
552
6.26
6.31
−0.05
GSM11a
N
N
126
6.90
6.35
0.55
GSM12
N
N
2531
5.60
5.65
−0.05
GSM13
N
N
1409
5.85
6.21
−0.36
GSM14

N
N
619
6.21
5.85
0.36
GSM15
N
N
1406
5.85
6.06
−0.21
GSM16
N
N
19,316
4.71
5.65
−0.94
GSM17a
N
N
1919
5.72
5.6
0.12
GSM18
N
N
485
6.31
6.29
0.02
GSM19
N
N
2069
5.68
5.6
0.08
GSM20

N
N
20,000
4.70
4.7
0
GSM21
N
N
2215
5.65
5.6
0.05
GSM22

O
N
465
6.33
6.27
0.06
GSM23a

O
N
537
6.27
6.03
0.24
GSM24a
O
N
356
6.45
6.7
−0.25
GSM25
O
N
440
6.36
6.84
−0.48
GSM26a
N
O
1392
5.86
6.03
−0.17
GSM27
N
O
448
6.35
6.03
0.32
GSM28
N
O
875
6.06
5.85
0.21
GSM29
N
O
935
6.03
6.35
−0.32
GSM30
N
O
540
6.27
6.33
−0.06
GSM31

N
NH
164
6.79
6.84
−0.05
GSM32

N
NH
201
6.70
6.91
−0.21
GSM33

N
NH
122
6.91
6.7
0.21
GSM34
N
NH
209
6.68
6.27
0.41
2.2 Computational details
The structures of the fused 5,6-bicyclic heterocycles considered for 3D-QSAR study were sketched on Chem sketch 12.0 software (ACD/Chemsketch 12.0, 2009). All structures were cleaned and 3D optimized. The energy optimization of the molecules was performed by batch calculation in VLife MDS 3.5 software (VLife MDS 3.5, 2008) using Merck Molecular Force Field (MMFF) (Halgren, 1996a,b,c,d, 1999a,b) with distance dependent dielectric function and an energy gradient of 0.001 kcal/mol Å.
2.3 Conformation generation of molecules
It is a well recognized fact that each compound containing one or more single bonds is existing at each moment in many different so-called rotamers or conformers. Although small molecules may have only a single lowest energy conformation large and flexible molecules do exist in multiple conformations at physiological conditions. Therefore, it becomes necessary to include various such conformations of the molecules in a 3D-QSAR study (Verma et al., 2010). Multiple conformations of each molecule were generated using a Monte Carlo conformational search with an RMS gradient of 0.001 kcal/mol using a MMFF. Monte Carlo search method is a random search method for finding conformations of molecules (Metropolis et al., 1953). The low energy conformer for each compound was selected for further 3D-QSAR study.
2.4 Alignment of molecules
The alignment of molecules is the process of aligning two or more molecules in 3D space to optimally superimpose specific atoms on each other based on distances (Vyas and Ghate, 2012). One of the most crucial problems in most of the alignment-based 3D-QSAR methods is that their results are highly sensitive to the manner in which the bioactive conformations of all the molecules are superimposed over each other. In cases, where all the molecules in a data set have a common rigid core structure, molecules can be aligned easily using the least-square fitting procedure. However in the case of structural heterogeneity in the dataset, alignment of highly flexible molecules becomes quite difficult and time consuming (Verma et al., 2010). The position of each atom is important for the kNN–MFA study because the descriptors calculation is based on the 3D-space grid. Thus, the method to determine the conformation of each molecule and the way to align molecules together are two sensitive input parameters and determining factors to build a reasonable and a reliable model (Bhadoriya et al., 2012d). A proper alignment of the structures is a crucial, critical and decisive step for obtaining effective and valid 3D-QSAR models. Improper or incorrect alignment of molecules can create models providing little information relating to the main orientation of the molecule in the active site (Telvekar et al., 2010). Energy-minimized and geometry-optimized structures of molecules were aligned by the template-based method (Ajmani et al., 2006), where a template structure is defined and used as a basis for the alignment of a set of molecules, and a reference molecule is chosen on which the other molecules of the data set get aligned considering the chosen template. The template structure, i.e. 1-(2-methoxyphenyl)-4-methyl-1H-imidazole ring, was used for the alignment by considering the common elements of the series as shown in Fig. 1. The reference molecule is chosen in such a way that it is the most active among the series of molecules considered. The compound GSM9 possessed very high Aβ42 inhibitory activity which made it a valid lead molecule and, therefore, was chosen as a reference molecule. After optimizing, the template structure and the reference molecule were used to superimpose all molecules from the series using the template alignment method in VLife MDS 3.5 software (VLife MDS 3.5, 2008) to obtain optimal alignment between the molecular structures necessary for ligand–receptor/enzyme interactions. The superimposition of all molecules based on minimizing RMS deviation is shown in Fig. 2. The resulting alignments of molecules were used for building kNN–MFA 3D-QSAR models.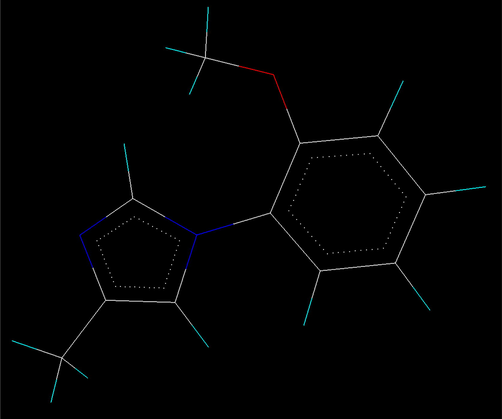
1-(2-Methoxyphenyl)-4-methyl-1H-imidazole ring as a common template used for template based alignment of fused 5,6-bicyclic heterocycles as γ-secretase modulators.
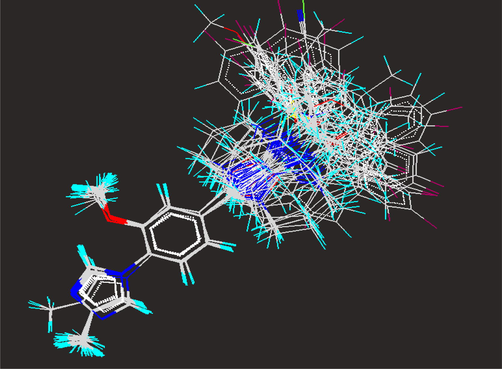
Stereo view of template based alignment of fused 5,6-bicyclic heterocycles on the base template.
2.5 Calculation of molecular field descriptors for 3D-QSAR analysis
Molecular field analysis (MFA) was employed to derive the 3D-QSAR model in this study. Molecular field analysis (MFA) model is predictive and sufficiently reliable to guide the chemist in designing novel compounds. This approach is effective for the analysis of data sets, where activity information is available but the structure of the receptor site is unknown (Silakari et al., 2011). After superimposition, the overlaid set of molecules is positioned in the center of a lattice or grid box, to calculate interaction energies between the ligands and different probe atoms placed at each intersection of the lattice (Verma et al., 2010). The aligned biologically active conformations of fused 5,6-bicyclic heterocycles were used for the calculation of molecular fields. Molecular fields are the electrostatic, steric and hydrophobic interaction energies which were computed at the lattice points of the grid using a methyl probe of charge +1 considering Gasteiger–Marsili charges (Gasteiger and Marsili, 1980). 10.0 kcal/mol electrostatic cut-off and 30.0 kcal/mol steric cut-off was employed to perform descriptor calculation. The term descriptor is utilized to indicate field values at the lattice points. These interaction energy values are considered for relationship generation and utilized as descriptors to decide nearness between molecules. A value of 1.0 is assigned to the distance-dependent dielectric constant. A total of 5577 three dimensional descriptors were calculated using VLife MDS software. These included electrostatic, steric and hydrophobic field descriptors (1859 for each electrostatic, steric and hydrophobic descriptor) for all the compounds in separate columns.
2.6 Design of the training and test sets using SEM (sphere exclusion method)
In order to obtain a validated QSAR model for the purpose of meaningful prediction, an available dataset should be divided into training and test sets. For the prediction statistics to be reliable, the test set must include at least five compounds (Golbraikh and Tropsha, 2002b). The segregation or separation of the data set of 34 molecules into training and test sets comprising of 26 and 8 molecules, respectively, was performed by the rational sphere exclusion (SE) method with a dissimilarity value of 2.23. The dissimilarity value gives the sphere exclusion radius. For sphere exclusion algorithm, pIC50 activity was used as a dependent variable and various calculated electrostatic, steric and hydrophobic field 3D molecular descriptors as independent descriptors. Sphere exclusion algorithm allows constructing training sets covering all descriptor space areas occupied by representation points. The test set compounds should represent structural diversity and a range of biological activities similar to that of the training set. Compounds in the test set allowed us to use one test compound over three training compounds, thus resulting in more rigorous validation of the training model. In addition, a wide range of structural diversity of compounds in the test set permitted us to evaluate the extrapolative accuracy of the 3D-QSAR models. The test set molecules captured structural features of the training set molecules, thus their activities could be well predicted. Training set of 26 compounds and a test set of eight compounds were used for generating 3D-QSAR models and for validating the quality of the models, respectively. Sphere exclusion approach resulted, eight compounds, namely GSM3, GSM7, GSM10, GSM11, GSM17, GSM23, GSM24, and GSM26 as the test set and the remaining 26 compounds as the training set (Table 1).
2.7 Stepwise forward as variable (feature) selection method
The problem that is faced frequently by a researcher in developing QSAR models is that of a small number of observations (molecules) compared with a large number of molecular parameters in the descriptor pool. Recent trends in QSAR have focused on the development of procedures that allow the selection of optimal variables with low complexity and good predictive accuracy from the available pool of descriptors of chemical structures, i.e. the ones that are most meaningful and statistically significant in terms of correlation with biological activity. This process forms the basis of a technique known as feature selection or variable selection (Guyon and Elisseeff, 2003; Ghosh and Bagchi, 2009b; Sahu et al., 2011). Our first objective was to determine the best variables which produce the most significant 3D-QSAR models linking the structure of compounds with their binding affinity. Among several search algorithms, SW forward variable selection algorithm coupled with kNN–MFA was used to establish the 3D-QSAR models. In the SW forward variable selection algorithm, the search procedure begins with developing a trial model step by step with a single independent variable and to each step, independent variables are added one at a time, examining the fit of the model by using the kNN–MFA procedure. Thus, the model is repeatedly altered from the previous one by adding or removing a predictor variable in accordance with the ‘stepping criteria’ (in this case, F = 4 for inclusion for the forward selection method). The method continues until there is no significant variable remaining outside the model.
In the selected equations, the cross-correlation limit was set at 0.5, the number of variables at 10 and the term selection criteria at r2. An F value was specified to evaluate the significance of a variable. The variance cut-off was set at 0.0, and scaling as none. Additionally the kNN parameter setting was done in which the number of maximum neighbors and the number of minimum neighbors were set at 5 and 2, respectively and the prediction method was selected as the distance-based weighted average.
2.8 k-Nearest neighbor molecular field analysis method for generating 3D-QSAR models
In order to predict binding domain of γ-secretase, a k-nearest neighbor (kNN) classification model was developed. The k-nearest neighbor (kNN) method is one of the simplest machine learning algorithms, most commonly used for classifying a new pattern (e.g. a molecule) (Verma et al., 2010). The kNN technique is a conceptually simple approach to pattern recognition problems (VLife MDS 3.5, 2008). k-Nearest neighbor molecular field analysis (kNN–MFA) is the 3D-QSAR method which has been used to produce the 3D models to indicate the regions that affect biological activity with a change in the chemical substitution (Sharma et al., 2012). The kNN methodology relies on a simple distance learning approach whereby an unknown/new member is classified according to the majority of its k-nearest neighbors in the training set. The nearness is measured by an appropriate distance metric (e.g., a molecular similarity measure calculated using field interactions of molecular structures). The standard kNN method is implemented simply as follows:
Calculate the distances between an unknown object (u) and all the objects in the training set;
Select k objects from the training set most similar to object u, according to the calculated distances; and
Classify object u with the group to which the majority of the k objects belongs (Sharaf et al., 1986). An optimal k value is selected by optimization through the classification of a test set of samples or by leave-one-out cross-validation.
The variables and optimal k values were chosen using stepwise variable selection method. This method employs a stepwise variable selection procedure combined with kNN to optimize
-
The number of nearest neighbors (k) and
-
The selection of variables from the original pool.
2.9 k-Nearest neighbor QSAR (kNN weighted average method)
The kNN method was also used to develop a QSAR model using continuous variable, i.e. using activity as pIC50 values. In this case, by using a developed kNN QSAR model the activity of a molecule can be predicted using weighted average activity (Eq. (1)) of k most similar molecules in the training set.
2.10 Model validation and evaluation
This is done to test the internal stability and predictive ability of the QSAR models.
2.10.1 Internal and external validations
Internal validation was carried out using the leave-one-out (q2, LOO) method. For calculating q2, each molecule in the training set was sequentially eliminated, the model refit using same descriptors, and the biological activity of the eliminated molecule predicted using the refit model. The cross-validated coefficient, q2, was calculated using Eq.(4).
However, a high q2 value does not necessarily give a suitable representation of the real predictive power of the model for γ-secretase modulators. So, an external validation is also carried out in this study. The external predictive power of the model is assessed by predicting pIC50 value of eight test set molecules, which are not included in the 3D-QSAR model development. The predictive ability of the selected model is also confirmed by pred_r2.
For external validation, activity of each molecule in the test set was predicted using the model generated from the training set. The pred_r2 value is calculated as follows (Eq. (5))
Both summations are over all molecules in the test set. Thus the pred_r2 value is indicative of the predictive power of the current kNN–MFA model based on the external test set.
2.10.2 Randomization test
Y-randomization (randomization of response) is a widely used approach to establish the model robustness. It consists of repeating the calculation procedure with randomized activities and subsequent probability assessment of the resultant statistics. Frequently, it is used along with cross-validation (Golbraikh and Tropsha, 2002b). The robustness of the models for training sets was examined by comparing these models to those derived for random data sets. Random sets were generated by rearranging the activities of the molecules in the training set. The significance of the models hence obtained was derived based on a calculated Zscore; Eq. (6).
A Zscore value is calculated using the following formula:
The probability (α) of significance of the randomization test is derived by using calculated Zscore value as given in the literature (Shen et al., 2003).
2.10.3 Evaluation of the quantitative model
The developed 3D-QSAR model was evaluated using the following statistical measures: N, number of observations (molecules) in the training set; number of nearest neighbors, number of k-nearest neighbors in the model; q2, cross-validated r2 (by leave one out) which is a relative measure of quality of fit; pred_r2, r2 for external test set; q2se, standard error of cross-validation and pred_r2se, standard error of external test set prediction. However, a QSAR model is considered to be predictive, if the following conditions are satisfied: q2 > 0.6 and pred_r2 > 0.5 (Golbraikh and Tropsha, 2002a). The low standard error of pred_r2se and q2se shows absolute quality of fitness of the model. The high pred_r2 and low pred_r2se show high predictive ability of the model.
The q2 and pred_r2 values were used as deciding factors in selecting the optimal models.
3 Results and discussion
The 3D-QSAR study of 34 fused 5,6-bicyclic heterocycles for Aβ42 inhibitory activity (Table 1) through kNN methodology, based on SW feature selection method using VLife MDS 3.5 software (VLife MDS 3.5, 2008), resulted in the following statistically significant model, considering the term selection criterion as q2 and pred_r2. The training and test set compounds (Table 1) for this group of compounds were selected by the sphere exclusion method, and the model was validated by both internal and external validation procedures.
Selection of compounds in the training set and test is a key and important feature of any QSAR model. Therefore care was taken in such a way that biological activities of all compounds in the test lie within the maximum and minimum value range of biological activities of the training set of compounds. The UniColumn Statistics of test and training sets further reflected the correct selection of test and training sets (Table 2). Max., maximum; Min., minimum; SD, standard deviation.
Data set
Column name
Average
Max.
Min.
SD
Sum
Training
Aβ42pIC50
5.9912
6.9400
4.7000
0.7349
155.7700
Test
Aβ42pIC50
6.3075
6.9000
5.7200
0.4117
50.4600
The maximum and minimum values in the training and test sets were compared in a way that:
-
The maximum value of pIC50 of the test set should be less than or equal to the maximum value of pIC50 of the training set.
-
The minimum value of pIC50 of the test set should be higher than or equal to the minimum value of pIC50 of the training set.
This observation showed that the test set was interpolative and derived within the minimum–maximum range of the training set. The mean and standard deviation of pIC50 values of sets of training and test provide insights into the relative difference of mean and point density distribution (along mean) of the two sets. The mean of the test sets was higher than the training sets that indicates the presence of relatively more active molecules as compared to the inactive ones. Also, a relatively higher standard deviation in training sets indicates that training sets had widely distributed activity of the molecules as compared to the test sets (VLife MDS 3.5, 2008).
Statistically significant best 3D-QSAR model was selected, considering the term selection criterion as q2, the internal predictive ability of the model and pred_r2, the ability of the model to predict the activity of the external test set. Best 3D-QSAR model is chosen for discussion.
3.1 3D-QSAR modeling and its validation
Various 3D-QSAR models were developed using the kNN method. In the present study, kNN coupled with stepwise variable selection method was used to develop 3D-QSAR models of fused 5,6-bicyclic heterocycles with reported Aβ42 inhibitory activities based on hydrophobic and steric fields. Several statistically significant 3D-QSAR models were generated, of which the corresponding best model is reported herein. 3D-QSAR model was selected based on the value of statistical parameters and the best kNN–MFA 3D-QSAR model with 26 training set compounds have a q2 = 0.8457 and pred_r2 = 0.7556 (Table 3).
S. No.
Statistical parameter
3D-QSAR results
1
q2
0.8457
2
q2se
0.2887
3
pred_r2
0.7556
4
pred_r2se
0.2634
5
Ntraining
26
6
Nearest neighbor
2
7
Degree of freedom
22
8
Contributing descriptors
1. H_83 (0.3416, 0.3466)
2. S_183 (−0.3355, −0.3273)
3. S_227 (−0.0931, −0.0911)
The descriptors selected for 3D-QSAR modeling Aβ42 inhibitory activity of fused 5,6-bicyclic heterocycles are summarized in Table 4 and the correlation matrix between the hydrophobic and steric descriptors influencing the Aβ42 inhibitory activity is presented in Table 5.
Compound_ID
Observed activity (Aβ42pIC50)
H_83
S_183
S_227
GSM1
4.70
0.191522
−0.326565
−0.090766
GSM2
6.29
0.305327
−0.331884
−0.089395
GSM3
6.81
0.332995
−0.332539
−0.089892
GSM4
6.84
0.341568
−0.335532
−0.091112
GSM5
4.79
0.31945
−0.338717
−0.080566
GSM6
4.70
0.323797
−0.330989
−0.088111
GSM7
6.19
0.286387
−0.331192
−0.087782
GSM8
6.47
0.346581
−0.32725
−0.093112
GSM9
6.94
0.338179
−0.331278
−0.094365
GSM10
6.26
0.31265
−0.334265
−0.092369
GSM11
6.90
0.365571
−0.331393
−0.092395
GSM12
5.60
0.271679
−0.328204
−0.09097
GSM13
5.85
0.287434
−0.334026
−0.08554
GSM14
6.21
0.285316
−0.332226
−0.08714
GSM15
5.85
0.307373
2.682489
−0.085977
GSM16
4.71
0.279406
−0.328525
−0.08907
GSM17
5.72
0.26086
−0.331234
−0.088706
GSM18
6.31
0.312223
−0.32969
−0.091833
GSM19
5.68
0.276221
0.986976
−0.091342
GSM20
4.70
0.189483
−0.338925
−0.091308
GSM21
5.65
0.274999
−0.332262
−0.09314
GSM22
6.33
0.389735
−0.331284
−0.093743
GSM23
6.27
0.360056
−0.334452
−0.092105
GSM24
6.45
0.373484
−0.334879
−0.09559
GSM25
6.36
0.334969
−0.335777
−0.083753
GSM26
5.86
0.35857
−0.339599
−0.083049
GSM27
6.35
0.358021
−0.327903
−0.089254
GSM28
6.06
0.391041
3.574147
−0.093438
GSM29
6.03
0.355705
−0.332605
−0.087771
GSM30
6.27
0.400326
−0.334155
−0.095092
GSM31
6.79
0.347824
−0.333944
−0.092523
GSM32
6.70
0.380233
−0.333618
−0.083544
GSM33
6.91
0.371048
−0.329226
−0.082761
GSM34
6.68
0.403634
−0.336324
−0.083096
S_183
S_227
H_83
Score
S_183
1
−0.10075
0.118567
3
S_227
−0.10075
1
0.088562
3
H_83
0.118567
0.088562
1
3
The actual/observed activities, predicted activities by 3D-QSAR model and residuals of both training and test sets compounds are given in Table 1. The plots of observed versus predicted activity of both training and test sets compounds helped in cross-validation of the kNN–MFA QSAR model and are depicted in Fig. 3. The residuals of the kNN–MFA calculated values of pIC50 are plotted against the observed activity (Aβ42pIC50) values in Fig. 4. The propagation of residuals at both sides of the zero line indicates that no systematic error exists in the development of the kNN–MFA model.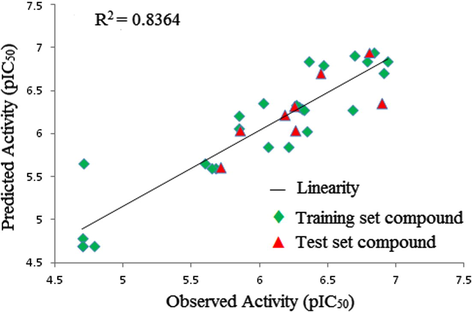
Comparison of observed activity versus predicted activity for the training set & test set compounds according to the 3D-QSAR SW-kNN–MFA model.
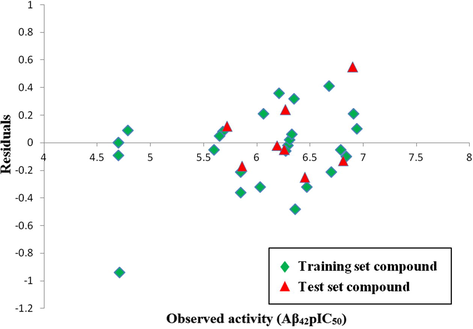
Scatter plot of the observed activity (Aβ42pIC50) versus residuals for training set & test set compounds.
The model selection criterion is the value of q2, the internal predictive ability of the model and that of pred_r2, the ability of the model to predict the activity of the external test set. For Aβ42 inhibitory activity, selected model was found to be statistically most significant, especially with respect to the internal predictive ability (q2 = 0.8457) of the model. As the cross-validated correlation coefficient (q2) is used as a measure of the reliability of prediction, the correlation coefficient suggests that our model is reliable and accurate. A data set of eight compounds was selected as the test set from the original data of 34 compounds for the validation experiments. The value of pred_r2 was obtained for the test set and gave better results, with a value of 0.7556, which means 76% predictive power for the external test set. Thus, our model displays good predictivity in regular cross-validation (Table 3.).
H_83, S_227, and S_183 are the hydrophobic and steric field energy of interactions. The above model is validated by predicting the biological activities of the test set molecules, as indicated in Table 1.
The plot of observed versus predicted activities for the test compounds is represented in Fig. 3. From Table 1. it is evident that the predicted activities of all the compounds in the test set are in good agreement with their corresponding experimental activities and optimal fit is obtained.
The external predictability of the above 3D-QSAR model using the test set was determined by pred_ r2, which is 0.7556. So, the above results indicate that 3D-QSAR model for γ-secretase modulators generate 84.57% and 75.56% internal and external model predictions, respectively.
3.1.1 Hydrophobic and steric field plot
The plot of contributions of hydrophobic and steric field interactions (Fig. 5) indicates relative regions of the local fields (hydrophobic and steric field) around the aligned molecules. Yellow and green balls represent hydrophobic and steric field effects, respectively.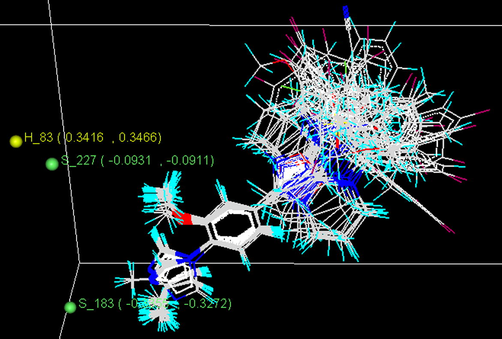
SW-kNN–MFA model field plot for hydrophobic and steric field interactions.
In the QSAR model, hydrophobic descriptor with positive coefficients represents regions of high hydrophobic tolerance. Steric descriptors with negative coefficients indicate regions where the bulky substituent is disfavored.
From the 3D-QSAR model (Fig. 5) it is observed that the steric field with negative coefficient (S_183) at the methyl position of the imidazole ring indicate that bulky substituents are unfavorable on this site and the presence of bulky substituents decrease the activity of fused 5,6-bicyclic heterocycles. Presence of another steric field with negative coefficient (S_227) at the methoxy position of the benzene ring suggests that bulky substituents are unfavorable on this site and the presence of bulky substituents decrease the activity of fused 5,6-bicyclic heterocycles. Hydrophobic field with positive coefficient (H_83) near the methoxy position of the benzene ring indicates that more hydrophobic groups in this position would have a beneficial effect on the anti-Alzheimer’s activity of these fused 5,6-bicyclic heterocycles. Thus, the contribution plot arising out of 3D-QSAR studies provide some useful insights for better understanding of the structural features of these compounds responsible for producing significant Aβ42 inhibitory activities.
4 Conclusions
In conclusion, the present study highlights the importance of the structural features responsible for the Aβ42 inhibitory activity. A 3D-QSAR study of a set of fused 5,6-bicyclic heterocycles has been performed. Stepwise forward variable selection algorithm has been applied for variable selection and the models were developed by the kNN–MFA method. Reliability of the models was confirmed by several statistical analyses. For the dataset of 34 fused 5,6-bicyclic heterocycles, shape of the substituents i.e., steric and hydrophobic descriptors of the molecules appear to be the governing factor for the Aβ42 inhibitory activity. The present investigation will guide the synthetic medicinal chemist to design and synthesize new novel more potent Aβ42 inhibitors (anti-Alzheimer’s agents) with increased biological activity in comparison to the reported compounds. In future, continuation with this work docking studies will be performed on this particular dataset of 34 fused 5,6-bicyclic heterocycles by using receptor–ligand-co-crystal structures available in the protein data bank.
Acknowledgements
The authors gratefully acknowledge “the Department of Science and Technology, Govt. of India” for providing funding to the institute for the Vlife MDS software. Authors would like to acknowledge the Principal of the institute for providing facilities to carry out the work.
References
- ACD/Chemsketch 12.0, 2009.
- J. Chem. Inf. Model.. 2006;46:24-31.
- Cell. Mol. Life Sci.. 2006;63:1226-1235.
- J. Chem.. 2012;9(4):1753-1759.
- J. Saudi Chem. Soc. 2012 <http://dx.doi.org/10.1016/j.jscs.2012.11.001>
- J. Pharm. Res.. 2012;5(8):4127-4132.
- Med. Chem. Res. 2012
- [CrossRef]
- Bioorg. Med. Chem. Lett.. 2010;20:5380-5384.
- Lett. Drug Des. Discovery. 2009;6:193-200.
- Bioorg. Med. Chem. Lett.. 2011;21:4083-4087.
- Tetrahedron. 1980;36:3219-3228.
- Curr. Med. Chem.. 2009;16:4032-4048.
- Mol. Simul.. 2009;35:1185-1200.
- J. Comput. Aided Mol. Des.. 2002;16:357-369.
- J. Mach. Learning Res.. 2003;3:1157-1182.
- J. Comput. Chem.. 1996;17:520-552.
- J. Comput. Chem.. 1996;17:553-586.
- J. Comput. Chem.. 1996;17:616-641.
- J. Comput. Chem.. 1996;17:490-519.
- J. Comput. Chem.. 1999;20:720-729.
- J. Comput. Chem.. 1999;20:730-748.
- J. Neural Transm.. 2011;118:27-45.
- [CrossRef]
- Brain Struct. Funct.. 2010;214:245-262.
- [CrossRef]
- Med. Chem. Res.. 2012;21:1665-1676.
- [CrossRef]
- Med. Chem. Res.. 2012;21:3465-3484.
- [CrossRef]
- Org. Med. Chem. Lett.. 2012;2:22.
- [CrossRef]
- Med. Chem. Res. 2010
- [CrossRef]
- Cell Stress and Chaperones. 2008;13:401-412.
- [CrossRef]
- Bioorg. Med. Chem. Lett.. 2008;18:4232-4236.
- Bioorg. Med. Chem. Lett.. 2010;20:5282-5285.
- Bioinformation. 2010;5(3):122-127.
- J. Chem. Phys.. 1953;21:1087-1092.
- Bioorg. Med. Chem. Lett.. 2007;17:176-182.
- Bioorg. Med. Chem. Lett.. 2011;21:664-669.
- Mol. Simul.. 2011;37:752-765.
- Chemometrics, Chemical Analysis Series. New York: Wiley; 1986.
- J. Saudi Chem. Soc. 2012 <http://dx.doi.org/10.1016/j.jscs.2012.10.001>
- J. Med. Chem.. 2003;46:3013-3020.
- Med. Chem. Res.. 2011;20:158-167.
- [CrossRef]
- J. Med. Chem.. 2012;55:489-502.
- Med. Chem. Res.. 2010;19:1174-1190.
- [CrossRef]
- Curr. Top. Med. Chem.. 2010;10:95-115.
- VLife MDS 3.5, 2008. Molecular design suite. Vlife Sciences Technologies Pvt. Ltd., Pune, India. <www.vlifesciences.com>.
- Med. Chem. Res.. 2012;21:3021-3034.
- [CrossRef]
- Bioorg. Med. Chem. Lett.. 2011;21:7277-7280.


