

Translate this page into:
An easy and simple kilowatt-MPT-MS-based metal elements analysis method for rapid environmental water monitoring: An example from Poyang Lake of China
⁎Corresponding author at: School of Chemistry and Environmental Science, Shangrao Normal University, Shangrao, Jiangxi 334001, China. zhiqiangz@iccas.ac.cn (Zhiqiang Zhu)
-
Received: ,
Accepted: ,
This article was originally published by Elsevier and was migrated to Scientific Scholar after the change of Publisher.
Peer review under responsibility of King Saud University.
Abstract
The raw sample was merely filtered to wiping off the suspended, and then partly (10 mL) translated into amber glass vials. Furthermore, add a small quantity of HNO3 in order to make the solution reach the optimal acidity level of 0.03 moL.L−1 for the coming MPT-MS measurements.
Abstract
A powerful analytical method based on microwave plasma torch/mass spectrometry (MPT-MS) was developed to rapidly detect mental elements in environmental water from Poyang lake in China. With minimum or uncomplicated sample manipulation, raw water samples were ionized by MPT for subsequent LTQ-MS analysis under negative ion mode. Typical potential contamination sources such (e.g., iron, cobalt, and nickel) were detected and identified by collision-induced dissociated (CID) experiment. It was found that the three metallic elements were formed as [M(NOx)mOn]−, which was universal; thus, they could be target ions. For the given elements, their limits of detection (LOD) were assessed as 0.09 μg•L−1 for iron ion, 0.03 μg•L−1 for cobalt ion, and 0.33 μg.L−1 for nickel ion under the optimized conditions; good determination coefficient (R2 ≥ 0.99) and the relative standard deviation (RSD, 2.0–11%, n = 11) were obtained. For current actual samples under testing, short analysis time for a single sample (less than 1 min), the average levels for iron, cobalt, and nickel, reached allowable concentrations of national standards, which also suggested this method is practically effective and usable. Moreover, possible ionization mechanism of metallic elements in MPT source was also discussed in this work, which may provide insight and useful information for the metal organics derived from water environment or metabonomics by MPT-MS. On the whole, this study lays a solid basis for the in-site mass spectrometry analysis of aqueous samples in relevant fields.
Keywords
Microwave plasma torch
Mass spectrometry
Metallic elements
Negative ion mode
Mechanism
Environmental water

1 Introduction
Only about 2.7% of water on the Earth is freshwater, one of the most natural resources for human(Zhang et al., 2018). Poyang lake is known as the largest fresh water lake in China, it is also one of the the crucial wetlands worldwide. Poyang lake is critical to drinking water, food safety, agriculture, and indrustry and other fields in the area surrounding Poyang lake, covering Yangtze River in Southeast China (Dai et al., 2018b). However, Poyang lake has aroused significant attention for misuse and contamination of the lake (Luoto et al., 2019), especially the metal contamination that may result from the reproductive toxicity (Withgott, 2002). Note that heavy metal elements (e.g., iron, cobalt, and nickel) have been extensively applied in modern industrial production, scientific research, and daily life (Hedberg et al., 2017, Ma et al., 2019). The mentioned metal elements have been inevitably deposited in Poyang Lake (Yuan et al., 2011). Multiform metal substances are contained in drinking water, foodstuff, and biosystem, thereby ultimately affecting the human health. Accordingly, detecting the mentined metal ions in water is critical to assess the water qulity of Poyang lake (Zhang et al., 2017b, Zhang et al., 2017c, Wang et al., 2019a, Liao et al., 2018, Li et al., 2018b, Li et al., 2018a). Various conventional analytical methods, covering inductively coupled plasma-atomic emission spectrometry (ICP-AES) (Todoli and Mermet, 2006), fluorescence spectrum(Khan et al., 2020, Gu et al., 2019), atomic absorption spectroscopy (AAS) (Assubaie, 2015, Mehra and Thakur, 2016), and inductively coupled plasma mass spectrometry (ICP-MS) (Wang et al., 2015, Kocot et al., 2012), have been demonstrated to detect metallic ions in solutions. Among the mentioned methods, both ICP-AES and ICP-MS have been commonly employed in elemental analysis for its high sensitivity and high stability, whereas the atomization efficiency for ICP-AES is affected by the salt content of the aqueous solution, as well as the viscosity of the alkaline solution. In addition, the ICP-MS method consumes large amounts of argon (∼15 L•min−1) and is expensive to run. Other methods require relatively more complex sample pretreatment or/and time-consuming experimental measurements, limiting high throughput sample analysis. Over the past few years, ambient ionization techniques (Cooks et al., 2006, Gachumi and El-Aneed, 2017), including desorption electrospray ionization (DESI) (Takáts et al., 2004), desorption atmospheric pressure chemical ionization (DAPCI) (Wu et al., 2009), extractive electrospray ionization (EESI) (Chen et al., 2010), direct analysis in real time (DART) (Cody et al., 2005), low temperature plasma (LTP) (Harper et al., 2008), and microwave induced plasma (MIP) (Zhan et al., 2013), have been developed to directly analyze raw samples with minimum or uncomplicated sample pretreatment. However, they are overall difficult to directly analyze heavy metal ions in raw water.
Through combining the advantages of inductively coupled plasma (ICP) and microwave plasma (WMP), Jin et al. (1985) proposed a noval ionization source termed microwave plasma torch (MPT) that remedies the defect of in sufficient sample resistance, while exhibiting numerous advantages (Wu et al., 1994, Jin et al., 1990, Sola-Vazquez et al., 2011). Direct coupling MPT source with mass spectrometers has been broadly applied in several fields (e.g., the food safety, petrochemicals, and clinical medicine) (Evans-Nguyen et al., 2016; Miao et al., 2018; Zhang et al., 2017a; Wang et al., 2017). Morevoer, when the source runs with Argon, the electron-temperature (Te) could reach to 12,000–15,000 K (Zhang et al., 2013), which is high enough to excite almost all the metal elements but typically less than that of ICP. Therefore, the plasma is unique and distict with ICP so that the MPT mass spectra of metal elements exhit some fascinating characteristics which provides abundant research materials for the metal organics. In the previous studies, a series of organic compounds were successfully tested by MPT-MS (Miao et al., 2017; Melero et al., 2018). An MPT-based method has been demonstrated to have lower LODs and smaller RSDs than LTP due to the stable and high temperature plasma jet, and are more suitable for directly and rapidly identify various compounds with high sensitivity and reproducibility even in a very complex matrix, but this MPT-MS method is currently not used for the analysis of heavy metals in environmental water samples. However, to better utilize MPT-MS technique for in-site detection of metal ions in raw water samples, the ionization mechanisms and analysis performance of MPT should be thoroughly studied (Wang et al., 2019b).
In the present study, the concentration and distribution of metal ions in Poyang lake was successfully determined with MPT-MS/MS based on negative mode. The detection limit of the metal ions was 0.03–0.33 μg•L−1, entirely fitting on-line monitoring and detection of heavy metal ions in raw water samples. The formation mechanism of metal ion adducts in water samples was was illustrated, including the formation of metal ions adducts [M(NOx)mOn]−. On the whole, the results of this study showed that MPT-MS is a promising rapid method to assess the metal pollution of water environment.
2 Materials and experimental methods
2.1 Materials
The microwave power was provided by a 2450 MHz microwave generator ranging from 0 W to 1000 W which was supplied by Jin’s group at Zhejiang University. The kilowatt-MPT probe was offered by Jin’s group at Zhejiang University (Jin et al., 1985). Iron, cobalt, and nickel standard substances, with the concentration of 1000 mg•L−1 in 1.0 moL•L−1 HNO3, were purchased by the General Research Institute for Nonferrous Metals (Beijing, China). Nitric acid (65.0–68.0%, pure) was purchased from Sinopharm Chemical Reagent Co. Ltd. (Shanghai, China). A 2 moL•L−1 nitric acid stock solution was prepared by the nitric acid. Argon exhibiting 99.999% purity was supplied by the Guoteng Special Gas Ltd. (Nanchang, China). The ultrapure water (18.2 MΩ•cm−1) was provided with Milli-Q Direct water purification system (Millipore, USA). Fourteen batches of drinking water samples were harvested from Poyang lake in China.
2.2 Preparation of samples
The metal stock solutions (100 μg.L−1) were prepared in ultrapure water by iron, cobalt, and nickel standard substances. The raw samples were merely filtered to wiping off the suspended and then partially (10 mL) translated into amber glass vials. Furthermore, a small quantity of HNO3 was added to make the sample solutions and a series of standard solutions of metals with concentrations of 0–20 μg.L−1 reach the optimal acidity level of 0.03 moL•L−1 for the subsequent MPT-MS measurements.
2.3 Experimental methods
In this study, a Linear Ion Trap Mass Spectrometer (LTQ-MS) (Thermo Fisher Scientific, San Jose, CA, USA) was coupled with the MPT ionization source. To achieve a more efficient detection of metal ions, a desolvation unit including a glass concentric pneumatic nebulizer, spray chamber, heating tape, and along condenser were employed to remove most water from the aerosol sample based on MPT-LTQ MS.
The MPT ionization source was described previously (Pack et al., 1998). In brief, there are three coaxial conduits (i.e., the outer tube, the middle tube, and the inner tube) from the outside to the inside for the MPT. The argon gas was introduced in the middle tube as support gas with a flow rate of nearly 400 mL•min−1 and in the inner tube as carrier gas which was introduced via the pneumatic nebulizer at nearly 1000 mL•min−1, respectively. Such This dual-flow structure was determined as conducive to plasma stabilization (Zhang et al., 2013). An aerosol-phase sample, produced with the argon in the nebulizer, was carried into the desolvation unit by argon, which was finally introduced to inner tube was ionized by the plasma. Via the center conductor of a coaxial cable, the microwave generator was coupled with the middle tube employed to transmit microwave power to the MPT. The outer tube of MPT was connected to the ground via a metal wire. At the front-end opening of the MPT, being likely a spark that was the stability of plasma, was formed between the middle tube and inner tube. In the study, the distance (d), which was from the LTQ entrance to the plasma, was about 10 mm in Fig. 1. The controllable parameters of MPT-LTQ MS with negative ion mode were set to repectively analyza iron, cobalt, and nickel. The temperature of capillary for MS was set to 150 °C with tube lens voltage of −47 V. An isolation window with the width of 0.5 Da and the collision energy between 10% and 29% were eatablished. Mass spectra were collected in m/z range 50–600. Other parameters for LTQ-MS were automatically optimized with the commercial software xcalibur.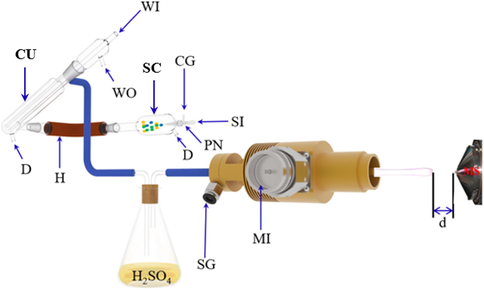
Schematic of MPT-MS system. (MI: Microwave Input; SG: Support Gas; CG: Carrier Gas; SI: Sample input; WI: Water in; WO: Water out; PN: Pneumatic Nebulizer; CU: Condenser Unit; SC: Spray Chamber; D: Drain; H: Heater; d:the distance (10 mm) between the tip of MPT plasma and the inlet of LTQ.)
The metal standard solution was diluted to a suitable concentration (100 μg•L−1), which was used as the stock solution. As shown in Fig. 1, the aerosol samples were passed through a heating tube, a cooling cycle system, and a bottle with sulfuric acid to obtain a dried aerosol for avoiding large amounts of microwave energy being absorbed by the remaining water. The aerosol introduced into the inner tube of MPT was ionized by plasma. Ions produced in the plasma were analyzed by LTQ mass spectrometer to determine characteristic mass spectra.
3 Results and discussion
3.1 Ions formation of iron, cobalt, and nickel
To assess the ionization performance of MPT based on negative ion mode, the commercial LTQ-MS was performed to detect the mentioned ions. Fig. 2a illustrates MPT mass spectra of iron standard solution (100 μg•L−1). Apparently, a base peak at m/z 304 is observed. In this study, the base peak at m/z 304 was chosen for the CID experiments. The experimental results are shown in Fig. 2(b–f), in which precursor ion (m/z 304) lost successively four NO2 groups (46 Da) to generate the peak at m/z 258 for MS2 spectra, 212 for MS3 spectra, 166 for MS4 spectra, as well as 120 MS5 spectra, respectively. In the final CID experiment, the fragment was found to be m/z 88 by the loss of O2 (32 Da). In the study, the ion at m/z 88 is tentatively assigned to be [FeO2]− (m/z 88). Thus, the ion at m/z 304 is tentatively assigned to be [56Fe(NO3)4]−, since MPT ionization source was tended to produce NO3− as the background ions in negative ion mode (Jiang et al., 2016). Moreover, the experimental values (m/z) of iron isotopic abundance were highly matched and compared wtih those in nature (Table S1) (Hoffmann and Stroobant, 2002), revealing the successful ion detection of iron adducts in present study.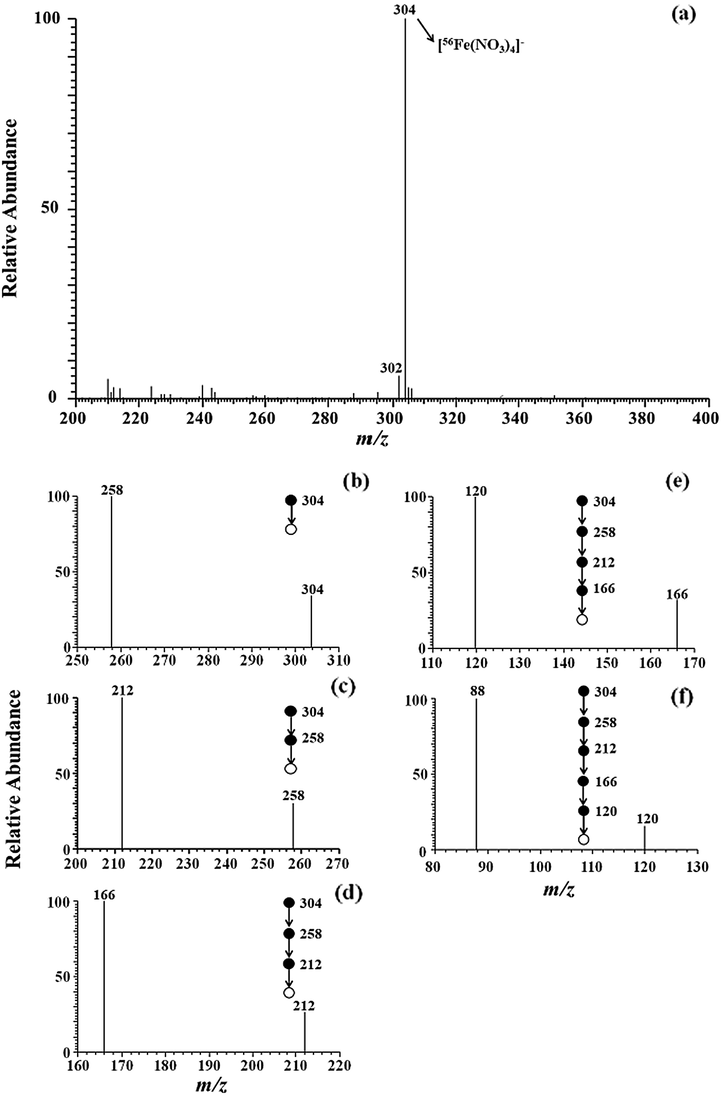
MSn spectra of iron adduct ion (m/z 304) obtained by MPT-LTQ-MS with negative mode (n ≤ 6).
To verify the ion adducts, the identical experiment was performed on cobalt (Fig. 3) and nickel (Fig. 4) standard solution. For identifying the ion adducts of cobalt, one main evidence peak is located at m/z 245 in Fig. 3a. Moreover, cobalt, being a natural abundance of 59Co, has only one natural isotope. The peak at m/z 245 can be assigned tentatively to [59Co(NO3)3]−, sinec cobalt and iron are homogeneous elements. To confirm the composition of m/z 245, the CID experiments were performed on the precursor ion (m/z). Fig. 3(b–e) presents MS5 mass spectra of cobalt in MPT-MS, in which the precursor ion (m/z 245) lost three NO2 groups to generate the fragment ions at m/z 199 for MS2 spectra, 153 for MS3 spectra, and 107 for MS4 spectra, respectively. Interestingly, the sub-precursor (m/z 107) lost one O group (16 Da) to generate fragment ions at m/z 91, which is assigned to [59CoO2]− in MS5 spectra via CID experiments. Thus, the mass spectral band for main peaks at m/z 245 may be assigned to [59Co(NO3)3]−. Likewise, multi-stage mass spectrometry of cobalt showed similar pattern of iron. Note that nickel being similar to the multiple isotope of iron achieved the experimental values (m/z) of nickel isotopic abundance covering 68.06% for 58Ni, 26.16% for 60Ni, 1.85% for 61Ni, 3.14% for 62Ni, and 0.97% for 64Ni also were highly fitted and compared wtih those in nature (Table S2) (Hoffmann and Stroobant, 2002). As shown in Fig. 4a, a dominant ion was observed at m/z 244. The obvious peak at m/z 244 consiss of only five peaks, which seems to be identical to the natural isotopic distribution of nickel, as listed in Table S1 (refer to the Supporting Materials). In the Fig. 4(b–e), the CID experiments were performed to confirm the assignment of the base peak at m/z 244. The experimental date concerning the precursor ion (m/z 244) are illustrated, in which the ions (m/z 244) lost successively two NO2 groups (46 Da) to form the peak at m/z 198 for MS2 spectra and 152 for MS3 spectra, respectively. Subsequently, the product ion of m/z 120 was generated by the loss of O2 (32 Da) derived from the sub-precursor (m/z 152). Next, the product ion (m/z 120) generated the characteristic ion of m/z 90 by the neutral loss of NO (30 Da). In this experiment, the ion at m/z 90 is tentatively assigned to be [58NiO2]− (m/z 90). As a result, the ion adducts at m/z 244 was identified as [58Ni(NO3)3]−, which was nearly consistent with the assignment of iron and cobalt.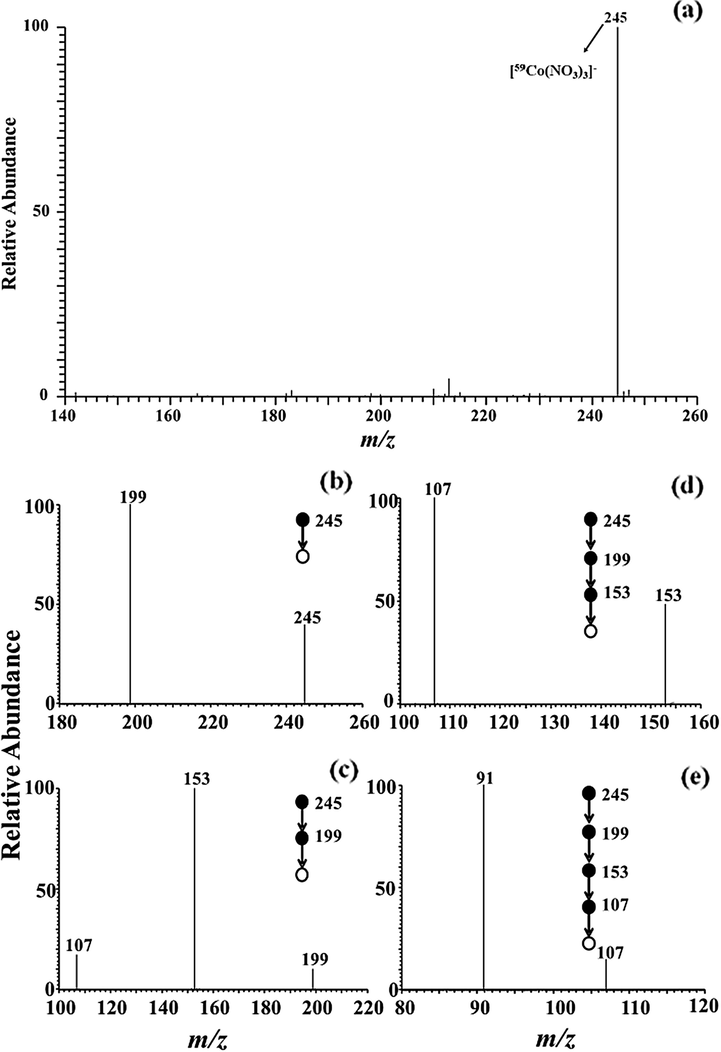
MS and MS5 spectra of cobalt adduct ion (m/z 245) obtained by LTQ mass spectrometry with negative mode.
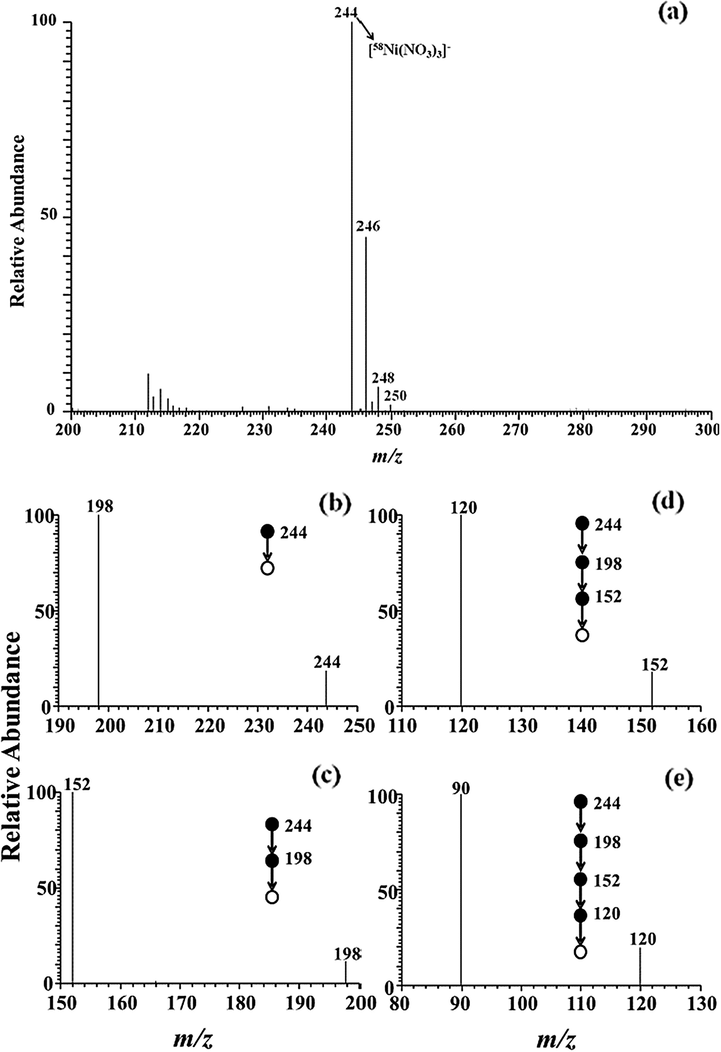
Multi-stage mass spectra of nickel adduct ion (m/z 244) obtained by LTQ mass spectrometry with negative mode.
Based on the mentioned analysis, the most likely assumption of oxidative environment in the vicinity of microwave plasma torch goes along with different intermediate species,covering highly reactive ions (e.g., On− and NOx−). To expound this phenomenon, the background mass spectra and mechanism of MPT are discussed in the following.
3.2 Background ions formation in ambient air
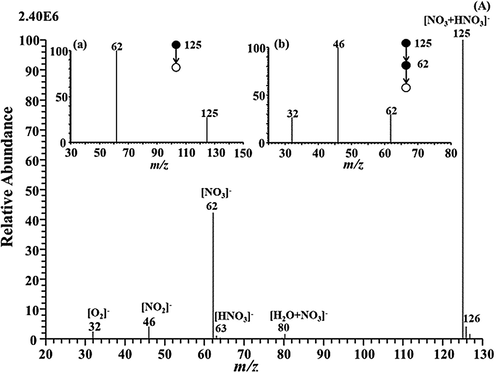
A characteristic of MPT was the sustaining electroneutrality in time and space on a macroscopic scale for equal numbers of positively and negatively charged species. Accordingly, MPT mass spectrometry exhibits the ability to provide the abundant information regarding the creating and evolutionary process of the positive and negative ions produced in MPT plasma. In this present study, the complicated anions produced in the MPT plasma arouse wide attention. Nevertherless, limited to the method involved in the preaent study, only the evolution of background-ions by MPT-MS with negative ion mode were discussed. Under the negative ion conditions, background spectra of air produced by MPT were performed to observe the fragment of base peak (m/z 125) in Fig. 6. Herein, the formation of primary background ions was associated with the active components in the plasma covering the high-energy electrons in the over-layoutand and several types of high-energy metastable particles (Arm) with high density, including Ar*(11.6 eV), Ar**(14.5 eV), and Ar2*(10.2 eV), etc (Babaeva et al., 2018, Skalny et al., 2004). The electrons and metastable particles were captured by molecule and atom exhibiting high electron affinity to form corresponding negative ions and active particles.
As shown in Fig. 6(A), the background spectrum verified this assumption that the MPT produces On− and NOx−. Similar to the ion sources based on a corona ionizer (Nagato et al., 2006, Skalny et al., 2004), the background ions derived from MPT were the mentioned major ions at m/z 125 (base peak), m/z 62, m/z 46, and m/z 32, probably representing [HNO3+NO3]−, [NO3]−, [NO2]−, and [O2]−, respectively. Moreover, ions with significantly low abundances were obtained for [HNO3]− (m/z 63), [H2O+NO3]− (m/z 80), and [2(HNO3)]− (m/z 126). To interpret the structure of the base peak at m/z125([HNO3+NO3]−), the MS/MS experiments were performed. As can be seen in the inset (a-b) in Fig. 6(A), the MS2 spectra show a base peak ion at m/z 62 via the neutral loss of 63 Da (HNO3), and the MS3 spectra illustrate other peaks at m/z 46 and m/z 32 by removing of O (16 Da) and NO (30 Da). Thus, The producedion ion (m/z 125) was derived from the complex reaction of NO3−, NO2−, O2−, and HNO3 (Shahin, 1969). To clarify the mentioned phenomena, electrons and metastable particles (Arm) quickly collided with N2 and O2 from atmosphere in the plasma to form unsteady N and O (e.g., R1-R4;) (Babaeva et al., 2018; Nagato et al., 2006; Perkker, 1998; Lieh et al., 1970; Sakiyama et al., 2012; Tochikubo and Arai, 2002). Meantime, the water in the air was also involved in chemical reaction in the plasma region, to generate hydroxyl radical (∙OH) (Babaeva et al., 2018; Ng et al., 1977; Visser et al., 1995). Based on the analysis of the background ions, following underlying mechanisms are possible, such as the attachment reactions including (R5), (R7)-(R9), and (R16)-(R19), dissociative attachment containing (R4), (R6), and (R12)-(R13), fast charge exchange comprising (R10), (R11), and (R15). Corresponding reaction pathways were shown as the (R1)-(R19) in Table 1. Abbreviations: e(h)—high-energy electrons, e(l)—low-energy electrons, IE—Ionization Energy, EA—Electron Affinity.
Index
Reaction
Rate constanta
Ref.
Note
(R1)
e(h) + O2 → 2O + e(l)
2.03 × 10⁻¹⁴ε−0.1010(−8.47/ε)
b
IE(e(h)) > IE(O2) = 13.618 eV (Hoffmann and Stroobant, 2002)
(R2)
e(h) + N2 → 2 N + e(l)
2.0 × 10⁻¹¹
(Tochikubo and Arai, 2002)
IE(e(h)) > IE(N2) > IE(Arm) = 14.5 eV (Jin et al., 1985)
(R3)
Arm + O2 → 2O + Ar
(E/N)
(Babaeva et al., 2018)
IE(Arm) > IE(O2)
(R4)
N + O2 + M → NO + O + M
(E/N)
(Villeger et al., 2005)
(E/N)
(R5)
O + O2 + M → O3 + M
(E/N)
(Babaeva et al., 2018)
(E/N)
(R6)
NO + O + M → NO2 + M
(E/N)
(Herron and Green, 2001)
(E/N)
(R7)
e(l) + O + O2 → O− + O2
1 × 10−43
(Sakiyama et al., 2012)
(E/N)
(R8)
O2 + e(l) → O2−
9.72 × 10⁻¹⁵ε−1.6210(−14.2/ε) for ε > 1.1;
2.78 × 10⁻²⁰ for ε < 1.1b
(E/N)
(R9)
O3 + e(l) + M → O3− + M
1 × 10−43
(Sakiyama et al., 2012)
(E/N)
(R10)
O− + NO → O + NO2−
1.2 × 10⁻¹⁵
(Sakiyama et al., 2012)
(E/N)
(R11)
O2− + NO → O2 + NO2−
7 × 10⁻¹⁶
(Sakiyama et al., 2012)
(E/N)
(R12)
O3− + NO2 → O2 + NO3−
1.2 × 10⁻¹⁷
(Sakiyama et al., 2012)
(E/N)
(R13)
NO2− + O3 → O2 + NO3−
1.8 × 10⁻¹⁷
(Sakiyama et al., 2012)
(E/N)
(R14)
O− + H2O → OH− + OH
1.4 × 10⁻¹⁵
(Sakiyama et al., 2012)
(E/N)
(R15)
OH− + O3 → O3− + OH
9 × 10⁻¹⁶
(Sakiyama et al., 2012)
(E/N)
(R16)
NO2 + OH → HNO3−
(E/N)
(Dai et al., 2018a)
(E/N)
(R17)
NO2 + OH + M → HNO3 + M
2.2 × 10⁻³⁰ (T/298)−2.9
(Dorai and Kushner, 2003)
(E/N)
(R18)
HNO3− + HNO3 → (HNO3)HNO3−
(E/N)
(Nagato et al., 2006)
(E/N)
(R19)
NO3− + HNO3 → (HNO3)NO3−
(E/N)
(Xiong et al., 2016)
(E/N)
3.3 Semi-quantitative approach to the MPT-MS method and optimization of the parameters
In this study, to evaluate the semi-quantitative performance of MPT-MS based on negative ion mode using 100 μg•L−1 standard solution for optimizing parameters (e.g., acidity in aqueous solution, microwave power, support gas rate, and carrier gas rate). It was noteworthy that the variation of acidity can improve the detection limit of the MPT-MS method. In addition, the development and verification of analytical methodology refers to previous research ideas (Liu et al., 2020b; 2020a), and quantitative analysis of radioactive uranium in mineral samples by MPT-MS (Li et al., 2016).
3.3.1 Effect of discharge gas flow rate on signal intensity
For the MPT discharge process, the function of support gas as one of the discharge gas is to ignite the plasma torch (Fig. 5e–f) and partially maintain the plasma. During a fixed carrier gas flow rate (CGFR) (600 mL.min−1), the effect of support gas flow rate (SGFR) about ionization efficiency is shown in Fig. 5a. The SGFR was less than 200 mL.min−1, and the generated plasma torch was unstable. Improving SGFR (>400 mL•min−1) may reduce the diffusion of ambient air into the plasma and also cool the plasma. Therefore, the ionization efficiency of the analyte to decrease is caused by the parameter. However, the ionization area of plasma torch was altered as the flow of support gas. As the SGFR rose gradually from 200 mL.min−1 to 400 mL.min−1, the area (below the “intersection”) in the plasma primarily used for aerosol sample evaporation and atomization has grown from small to large. During SGFR being higher than 400 mL•min−1, strong ionization area (above the “intersection”) tended to be gentle (Fig. 5g). Consequently, the flow rate of support gas slightly impacted the ionization of the region. An optimized flow rate of 400 mL•min−1 was normally selected for subsequent experiments.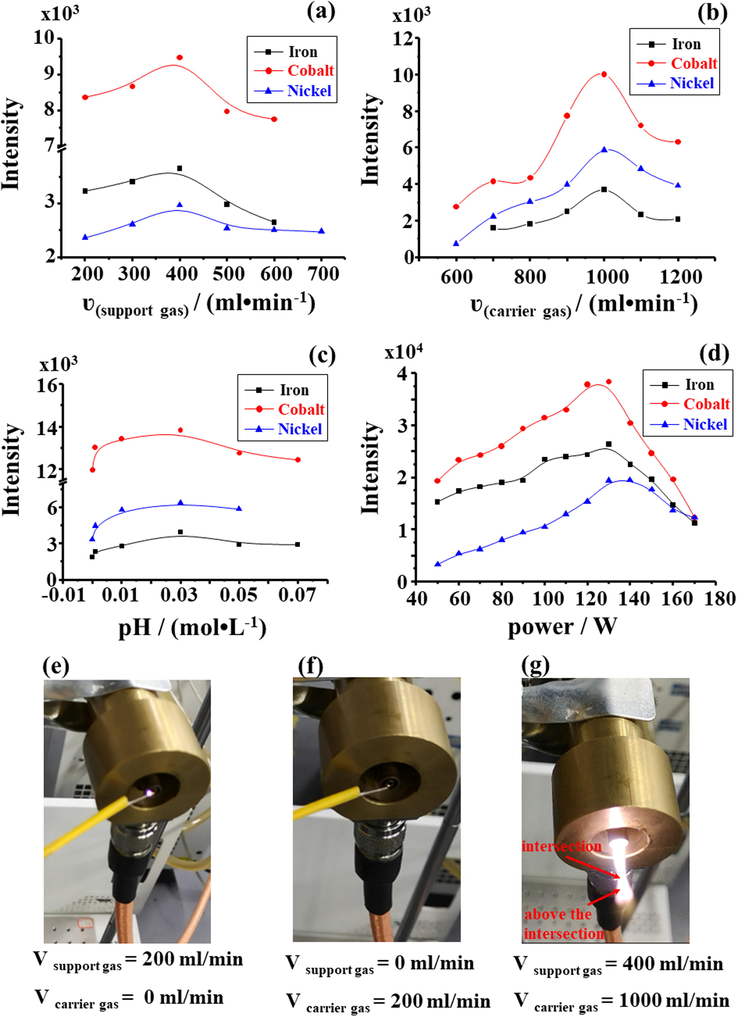
Effects of support gas flow rate (a), carrier gas flow rate (b), acidity (c) and microwave power (d) on the detection of iron (m/z 304), cobalt (m/z 245), and nickel (m/z 244) adduct ion; Relationship between discharge gas (carrier gas and support gas) and the ignition of MPT (e-f).
MS and MS/MS spectra of background-ion species obtained by MPT-MS with negative ion detection mode.
The plasma is shaped like a flame to expand to the surrounding air. Looking at Fig. 5b, as the CGFR <600 mL•min−1, the strong ionization region above the plasma intersection did not appear. As the CGFR increased to 1000 mL•min−1, the ionization region was expanded, and the ionization efficiency of the target substance was enhanced. During the CGFR > 1000 mL•min−1, the signal for target ion decreased. These were probably because the CGFR is particularly larger which the efficiency of desolvent system becomes lower due to the drastic loss of the microwave power that result from the absorbtion by water and it affect the residence time of the analyte in the plasma. Herein, the carrier gas flow rate (1000 mL•min−1) was selected for subsequent experiments.
3.3.2 Effect of pH on ionic strength
The pH is considered as one vital factor affecting the target ionic strength. It has been reported in the literature that high concentrations of inorganic acids can alter the physical properties of test solution, thereby affecting the sensitivity of the analytical method (Church, 1994). For this reason, the acidity of solution was optimized in this study. The aqueous sample prepared by the method contained a nitric acid concentration less than 0.08 moL•L−1. The experimental dates are shown in Fig. 5c, and the study reported the acid concentration of 0.03 moL•L−1, which is optimal for detection of iron, cobalt, and nickel in environmental water. For the metal elements in the aqueous sample generally existing in the compound state, when concentration of nitric acid in the liquor rose to 0.03 moL•L−1, the mentioned metal compounds were converted into nitrates via the action of nitric acid, and detection signal intensity of the metal element was promoted. The concentration of nitric acid sequentially increased, and the metal nitrate in water did not interact with nitric acid, thus the signal intensity of metal ions tended to be gentle.
3.3.3 Effects of microwave power
The shape of plasma obviously also is impacted by microwave power. As shown in Fig. 5d, microwave power was less than 50 W, it might even become a filament discharge, instead of a plasma torch. Hence, improving the microwave discharge power could lead to the formation of a plasma torch. As the discharge power increased to 130 W, the ionization efficiency of aerosol sample reached its maximum value. During microwave energy rising over 130 W, the MPT would produce a tail plume, which did not fit for the metallic elements ionized via the plasma. The possible reason for such finding was that high-energy particles in a tail plume will react with atmospheric component. The reaction reduces ionization efficiency of analytes. For this end, 130 W for plasma power used for semi-quantitative analysis of iron, cobalt, and nickel elements in aqueous samples.
3.3.4 Semi-quantitative of water samples
Semi-quantitative performance of this method in negative mode, due to less noise and much simpler MPT spectral structure, is better suitable for real application than doing the same in positive mode (Xiong et al., 2016). Accordingly, to verify the capacity of the method for the detection of iron, cobalt, and nickel, the concentration of the mentioned elements in actual samples was measured. In addition, to reduce a false signal originated from the isotopes of adjacent elements, the major fragments ions such as m/z 258 for iron, m/z 199 for cobalt, and m/z 198 for nickel were preformed on MPT-MS/MS as the semi-quantitative analysis of corresponding initial elements in actual samples. In the Table 1, the dynamic causal relationship for the fragment signal intensities and its concentrations is presented, depicting fine linear response in the concentration range of 0.1 to 20 μg•L−1, with a very high correlation coefficients being all above 0.9966 in the Fig. S1. Note that eleven measurements were repeated for each data point, and the relative standard deviation (RSD, n = 11) was less than 16.89% in the Table S3–S5. According to S/N ≥ 3, the limit of detection (LOD) for this method was at the level of 0.3 μg•L−1. The LOD for cobalt was even as low as 0.03 μg•L−1, almost close to the level of ICP-MS. However, the largest LOD value was 0.33 μg•L−1for nickel in Table 2. Though LOD values of nickel was higher about two magnitudes than those obtained in ICP-MS, as listed in Table 2, the LOD for iron and cobalt were almost close to the results obtained in ICP-MS and could satisfy the real requirement in detection of metal elements in water. Moreover, the LOD for the method was much lower than that of ICP-AES. Thus, this method has particular applications to analyze elements in water.
Element
linear equation
R2
Linear range/μg·L−1
RSD/%
LOD/μg·L−1 (this work)
LOD/μg·L−1 (ICP-MS) (Habila et al., 2016, GB/T, 2006)
LOD/μg·L−1 (ICP-AES) (GB/T, 2006)
the maximum permitted values/μg·L−1 (GB 3838-2002a)
Iron
y = 101x + 78.8
0.9980
0.5–20
2.0–4.5
0.09
0.9
4.5
300
Cobalt
y = 148x + 8.30
0.9996
0.1–10
03.1–5.9
0.03
0.03
2.5
1000
Nickel
y = 50.5x + 44.5
0.9966
1–20
3.5–11
0.33
0.002
6.0
20
Given the above calibration curve, this study analyzed the raw water samples from Poyang Lake in China. Fourteen practical aqueous samples were sampled from different sites in Poyang Lake (illustrated in Fig. 7 for guiding the eye) and were directly analyzed by MPT-MS. In addition, the dates were shown in Table S6–S8. The results for the dominating adduct ions of iron, cobalt, as well as nickel are summarized in Table S12. At the same time, the data for these three types of metal element are also shown in Fig. 7 as histograms for convenient and observation. Moreover, for the recovery test in Table S9–S11, aqueous samples spiked with corresponding metal at different concentrations (10, 5, and 2 μg•L−1) were prepared, and the recovery rates fell in the recommended range 79.6–114%, 80.8–109%, and 82.6–113% for for iron, cobalt, and ickel, respectively. Furthermore, a single water sample could be analyzed in 0.5–1 min. As obviously suggeated form the mentioned tables, for these current actual sample, the average levels of the trace elements were lower than the allowable values set by national agencies, suggesting that current pollution risk is under the controllable level. The mentioned result also demonstrated that the method prosposed in the study is practical and applicable in environmental pollution and analysis for its sufficiently high sensitivity and other mentioned advantages. Thus, this novel MPT-MS method will be promising and can be adopted as an alternative approach to monitoring water quality.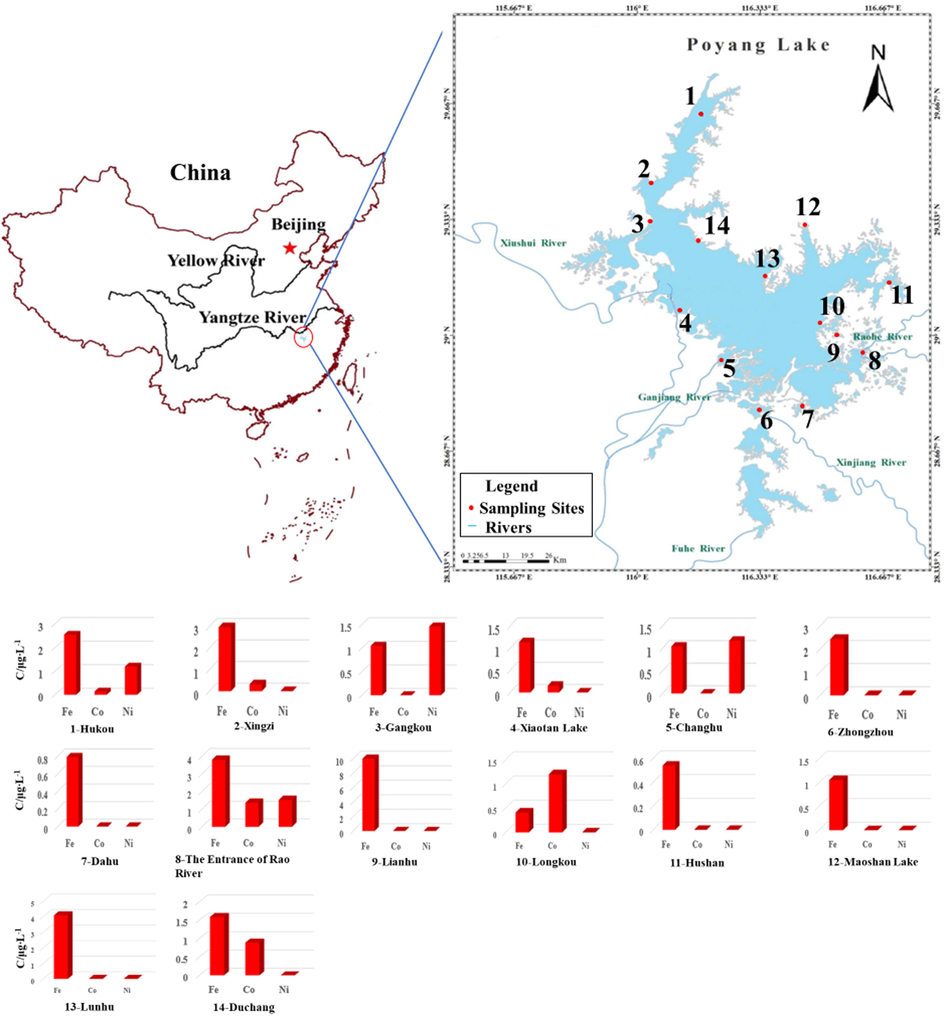
Sampling sites of water in Poyang Lake and concentration of iron, cobalt, and nickel at sampling sites. Notes 1-Hukou, 2-Xingzi, 3-Gangkou, 4-Xiaotan Lake, 5-Changhu, 6-Zhongzhou, 7-Dahu, 8-The Entrance of Rao River, 9-Lianhu, 10-Longkou, 11-Hushan, 12-Maoshan Lake, 13-Lunhu, 14-Duchang.
According to the results of this testing, iron element has been detected in varying concentrations from all batches of samples in different sampling sites. It is thus suggested that in the whole Poyang Lake area, and iron has accumulated to a certain whereas it is far less than the health risk threshold through ingestion of drinking water (GB/T, 2006). Cobalt and nickel have achieved the maximum mean level (1.36 μg•L−1 and 1.52 μg•L−1) both at the entrance of Rao River (one of the supplying rivers of Poyang Lake). Obviously, with the MPT-MS to analyze the water samples from Poyang Lake, the concentrations of metals in water are exploited to assess human exposure through ingestion of drinking water. To understand the pollution level of Chinese rivers, as listed in Table 3, comparison of the levels of heavy metals in the environmental water in this study with those in selected sites from the previous published results, it illuminated that the concentration of iron in the current environmental water has decreased, and the content of cobalt and nickel has little fluctuation via comparing with the previous published results on Poyang Lake. In addition, compared with the Gomti River in India, the rivers (e.g., Poyang Lake, Tibetan area, and Yangtze River) in China are less polluted by heavy metals.
Site
Iron
Cobalt
Nickel
References
Poyang Lake, China
0.41–9.88
0.14–1.36
1.17–1.52
This study
Poyang Lake, China
14.22–22.68
0.66
2.99
(Liao et al., 2018; Zhang et al., 2017c)
Tibetan area, China
/
0.05–4.20
0.95–11.71
(Geng et al., 2016)
Yangtze River, China
/
0.41
1.5
(Yang et al., 2014)
Gomti River, India
79
/
44.17
(Gupta et al., 2014; Singh et al., 2005)
Tarkwa stream River, Ghana
80
1.3
/
(Asante et al., 2007; Kusimi and Kusimi, 2012)
Sacramento River, USA
/
0.77
1.3
(Taylor et al., 2012)
4 Conclusion
In the present study, a high-sensitivity, quick-response, low-consumption and ambient MPT-MS method was demonstrated based on the analysis of those practical water samples harvested in the Poyang Lake area. As revealed from the result, the accumulation of the mentioned three metal elements are overall still far less than the national quality standards (GB/T, 2006). Moreover, the qualitative and semi-quantification analysis revealed the LOD arriving at the 102 ppt level, which was comparable with that of ICP-MS and better than ICP-AES (Habila et al., 2016; GB/T, 2006). Besides, such detecting ability may be further enhanced as the plasma becomes more energetic(>200 W) and then more stable. Though MPT-MS remains more preferable to be an effective tool for the field analysis, and it exhibits promising performance in environmental water quality monitoring. Furthermore, this tool combined with correlation analysis and Monte-Carlo simulation will help reveal significant positive associations among most trace elements, which suggeats the probability of being a common source; it also affects the decision making of pollution prevention and control (Geng et al., 2016). On the other hand, as a novel mass spectrometry technology, the feature of MPT mass spectra is of high interest. This study delved into the formation of the background analyte ions and the general formation of the metal complex ions in negative mode, which will be conductive to the further applications. In addition, the Tables show some metal contents in Poyang Lake in China that have already begun to decrease, which means that the heavily invested by Chinese government in water pollution in recent years begin to get a good result. And this high sensitivity method will be benefit to monitor the environmental water quality.
Acknowledgements
The present study was financed by the National Key Research and Development Project (No. 2018YFC1602803), Chinese National Science Foundation (No. 21866027) and Guangzhou Pearl River Science and Technology Rising Star Project (No. 201710010005). The corresponding authors are also grateful to the kindly discussion and assistance from Quantum Information Research Center of Shangrao Normal University.
Declaration of Competing Interest
The authors declare that they have no known competing financial interests or personal relationships that could have appeared to influence the work reported in this paper.
References
- Contamination status of arsenic and other trace elements in drinking water and residents from Tarkwa, a historic mining township in Ghana. Chemosphere. 2007;66:1513-1522.
- [Google Scholar]
- Assessment of the levels of some heavy metals in water in Alahsa Oasis farms, Saudi Arabia, with analysis by atomic absorption spectrophotometry. Arab. J. Chem.. 2015;8:240-245.
- [Google Scholar]
- Production of active species in an argon microwave plasma torch. J. Phys. D-Appl. Phys.. 2018;51
- [Google Scholar]
- Sensitive detection of native proteins using extractive electrospray ionization mass spectrometry. Angew. Chem. Int. Ed. Engl.. 2010;49:3053-3056.
- [Google Scholar]
- Inductively coupled plasmas in analytical atomic spectrometry: Edited by Akbar Montaser and D. W. Golightly. VCH Publishers Inc. Geochim. Cosmochim. Acta. 1994;52:951.
- [Google Scholar]
- Versatile new ion source for the analysis of materials in open air under ambient conditions. Anal. Chem.. 2005;77:2297-2302.
- [Google Scholar]
- Microwave induced plasma ionization ion mobility spectrometry for detection of trace explosives. Chinese J. Anal. Chem.. 2018;46:1238-1244.
- [Google Scholar]
- Multivariate geostatistical analysis and source identification of heavy metals in the sediment of Poyang Lake in China. Sci. Total Environ.. 2018;621:1433-1444.
- [Google Scholar]
- A model for plasma modification of polypropylene using atmospheric pressure discharges. J. Phys. D-Appl. Phys.. 2003;36:666-685.
- [Google Scholar]
- Towards universal ambient ionization: direct elemental analysis of solid substrates using microwave plasma ionization. Analyst. 2016;141:3811-3820.
- [Google Scholar]
- Mass spectrometric approaches for the analysis of phytosterols in biological samples. J. Agric. Food Chem.. 2017;65:10141-10156.
- [Google Scholar]
- GB/T, 5750.6-2006. Standard examination methods for drinking water.
- Occurrence and health risk assessment of selected metals in drinking water from two typical remote areas in China. Environ. Sci. Pollut. R.. 2016;23:8462-8469.
- [Google Scholar]
- Dual-response detection of Ni2+ and Cu2+ ions by a pyrazolopyrimidine-based fluorescent sensor and the application of this sensor in bioimaging. RSC Adv.. 2019;9:35671-35676.
- [Google Scholar]
- Evaluation of ecological risk of metal contamination in river Gomti, India: a biomonitoring approach. Ecotoxicol. Environ. Saf.. 2014;110:49-55.
- [Google Scholar]
- Mercaptobenzothiazole-functionalized magnetic carbon nanospheres of type Fe3O4@SiO2@C for the preconcentration of nickel, copper and lead prior to their determination by ICP-MS. Microchim. Acta. 2016;183:2377-2384.
- [Google Scholar]
- Solving the Boltzmann equation to obtain electron transport coefficients and rate coefficients for fluid models. Plasma Sources Sci. T.. 2005;14:722-733.
- [Google Scholar]
- Low-temperature plasma probe for ambient desorption ionization. Anal. Chem.. 2008;80:9097-9104.
- [Google Scholar]
- Nanoparticles of WC-Co, WC, Co and Cu of relevance for traffic wear particles - Particle stability and reactivity in synthetic surface water and influence of humic matter. Environ. Pollut.. 2017;224:275-288.
- [Google Scholar]
- Chemical kinetics database and predictive schemes for nonthermal humid air plasma chemistry. Part II. Neutral species reactions. Plasma Chem. Plasma P. 2001:21459-21481.
- [Google Scholar]
- Hoffmann, E.D., Stroobant, V., 2002. Mass Spectrometry: Principles and Applications, third ed.
- Direct mass spectrometric analysis of zinc and cadmium in water by microwave plasma torch coupled with a linear ion trap mass spectrometer. Int. J. Mass Spectrom.. 2016;399:33-39.
- [Google Scholar]
- Atomic emission detector for gas chromatography and supecritical fluid chromatography. J. Anal. At. Spectrom.. 1990;6:487.
- [Google Scholar]
- Metal oxide QD based ultrasensitive microsphere fluorescent sensor for copper, chromium and iron ions in water. RSC Adv.. 2020;10:9512-9524.
- [Google Scholar]
- Dispersive liquid-liquid microextraction using diethyldithiocarbamate as a chelating agent and the dried-spot technique for the determination of Fe Co, Ni, Cu, Zn, Se and Pb by energy-dispersive X-ray fluorescence spectrometry. Spectroc. Acta Pt. B-Atom. Spectr.. 2012;73:79-83.
- [Google Scholar]
- The hydrochemistry of water resources in selected mining communities in Tarkwa. J. Geochem. Explor.. 2012;112:252-261.
- [Google Scholar]
- Preparation of thiol-functionalized activated carbon from sewage sludge with coal blending for heavy metal removal from contaminated water. Environ. Pollut.. 2018;234:677-683.
- [Google Scholar]
- Detection of uranium in industrial and mines samples by microwave plasma torch mass spectrometry. J. Mass Spectrom.. 2016;51:159-164.
- [Google Scholar]
- Anthropogenic impact and ecological risk assessment of thallium and cobalt in poyang lake using the geochemical baseline. Water. 2018;10:14.
- [Google Scholar]
- Distributions, sources, and species of heavy metals/trace elements in shallow groundwater around the poyang lake, East China. Expo. Health. 2018;10:211-227.
- [Google Scholar]
- Lieh, L.C., A, P.D., Frederick, K., 1970. Oscillator strength of the resonance transitions of ground-state N and O. J. Chem. Phys. 53, 3896–3900.
- Quantification of trace organophosphorus pesticides in environmental water via enrichment by magnetic-zirconia nanocomposites and online extractive electrospray ionization mass spectrometry. Anal. Chem.. 2020;92:4137-4145.
- [Google Scholar]
- Enrichment of phospholipids using magnetic Fe3O4/TiO2 nanoparticles for quantitative detection at single cell levels by electrospray ionization mass spectrometry. Talanta. 2020;212:9.
- [Google Scholar]
- Waste water discharge from a large Ni-Zn open cast mine degrades benthic integrity of Lake Nuasjarvi (Finland) Environ. Pollut.. 2019;255:11.
- [Google Scholar]
- Rare earth elements in the Pearl River Delta of China: potential impacts of the REE industry on water, suspended particles and oysters. Environ. Pollut.. 2019;244:190-201.
- [Google Scholar]
- Relationship between lead, cadmium, zinc, manganese and iron in hair of environmentally exposed subjects. Arab. J. Chem.. 2016;9:S1214-S1217.
- [Google Scholar]
- Scalable graphene production from ethanol decomposition by microwave argon plasma torch. Plasma Phys. Contr. F.. 2018;60:10.
- [Google Scholar]
- Spray-inlet microwave plasma torch ionization tandem mass spectrometry for the direct detection of drug samples in liquid solutions. Rapid Commun. Mass Spectrom.. 2017;31:2092-2100.
- [Google Scholar]
- Direct determination of trace phthalate esters in alcoholic spirits by spray-inlet microwave plasma torch ionization tandem mass spectrometry. J. Mass Spectrom.. 2018;53:189-194.
- [Google Scholar]
- An analysis of the evolution of negative ions produced by a corona ionizer in air. Int. J. Mass Spectrom.. 2006;248:142-147.
- [Google Scholar]
- Photoionization of dimeric polyatomic molecules: proton affinities of H2O and HF. J. Chem. Phys.. 1977;67:4235-4237.
- [Google Scholar]
- Determination of halogenated hydrocarbons by helium microwave plasma torch time-of-flight mass spectrometry coupled to gas chromatography. Anal. Chem.. 1998;70:3957-3963.
- [Google Scholar]
- Plasma chemistry model of DC magnetron reactive sputtering in Ar-O2 gas mixtures. Thin Solid Films. 1998;312:341-347.
- [Google Scholar]
- Plasma chemistry model of surface microdischarge in humid air and dynamics of reactive neutral species. J. Phys. D-Appl. Phys.. 2012;45:425201
- [Google Scholar]
- Nature of charge carriers in negative coronas. Appl. Opt.. 1969;8(Suppl 1):106-110.
- [Google Scholar]
- Status of heavy metals in water and bed sediments of river Gomti - A tributary of the Ganga River. India. Environ. Monit. Assess.. 2005;105:43-67.
- [Google Scholar]
- An analysis of mass spectrometric study of negative ions extracted from negative corona discharge in air. Int. J. Mass Spectrom.. 2004;233:317-324.
- [Google Scholar]
- Plasma-based mass spectrometry for simultaneous acquisition of elemental and molecular information. Analyst. 2011;136:246-256.
- [Google Scholar]
- Mass spectrometry sampling under ambient conditions with desorption electrospray ionization. Science. 2004;306:471-473.
- [Google Scholar]
- Selected trace elements in the Sacramento river, California: occurrence and distribution. Arch. Environ. Contam. Toxicol.. 2012;62:557-569.
- [Google Scholar]
- Numerical simulation of streamer propagation and radical reactions in positive corona discharge in N2/NO and N2/O2/NO. Jan. J. Appl. Phys.. 2002;41:844-852.
- [Google Scholar]
- Sample introduction systems for the analysis of liquid microsamples by ICP-AES and ICP-MS. Spectroc. Acta Pt. B-Atom. Spectr.. 2006;61:239-283.
- [Google Scholar]
- Synergy between N and O atom action and substrate surface temperature in a sterilization process using a flowing N2–O2 microwave post discharge. Plasma Processes Polym.. 2005;2:709-714.
- [Google Scholar]
- Reactivity and thermochemical properties of the water dimer radical cation in the gas phase. J. Phys. Chem.. 1995;99:15444-15447.
- [Google Scholar]
- Metals pollution and ecological risk assessment of sediments in the Poyang Lake, China. Bull. Environ. Contam. Toxicol.. 2019;102:511-518.
- [Google Scholar]
- Differentiation using microwave plasma torch desorption mass spectrometry of navel oranges cultivated in neighboring habitats. J. Agric. Food Chem.. 2017;65:2488-2494.
- [Google Scholar]
- Dispersive liquid-liquid microextraction and micro-solid phase extraction for the rapid determination of metals in food and environmental waters. Anal. Lett.. 2015;48:1787-1801.
- [Google Scholar]
- Spray-inlet microwave plasma torch and low temperature plasma ionization for ambient mass spectrometry of agrochemicals. Anal. Methods. 2019;11:5421-5430.
- [Google Scholar]
- Amphibian decline-Ubiquitous herbicide emascutates frogs. Science. 2002;296:447-448.
- [Google Scholar]
- Elemental mass spectrometry using a helium microwave plasma torch as an ion source. Spectrochimica Acta. 1994;49B:137-148.
- [Google Scholar]
- Differentiation of dried sea cucumber products from different geographical areas by surface desorption atmospheric pressure chemical ionization mass spectrometry. J. Agric. Food Chem.. 2009;57:9356-9364.
- [Google Scholar]
- Microwave plasma torch mass spectrometry for the direct detection of copper andmolybdenum ions in aqueous liquids. J. Mass Spectrom.. 2016;51:369-377.
- [Google Scholar]
- Dissolved and particulate partitioning of trace elements and their spatial-temporal distribution in the Changjiang River. J. Geochem. Explor.. 2014;145:114-123.
- [Google Scholar]
- Inputting history of heavy metals into the inland lake recorded in sediment profiles: Poyang Lake in China. J. Hazard. Mater.. 2011;185:336-345.
- [Google Scholar]
- Microwave-induced plasma desorption/ionization source for ambient mass spectrometry. Anal. Chem.. 2013;85:4512-4519.
- [Google Scholar]
- Comparative study on ambient ionization methods for direct analysis of navel orange tissues by mass spectrometry. J. Mass Spectrom.. 2017;52:526-533.
- [Google Scholar]
- Level, source identification, and risk analysis of heavy metal in surface sediments from river-lake ecosystems in the Poyang Lake, China. Environ. Sci. Pollut. R.. 2017;24:21902-21916.
- [Google Scholar]
- Spatial characterization, risk assessment, and statistical source identification of the dissolved trace elements in the Ganjiang River-feeding tributary of the Poyang Lake, China. Environ. Sci. Pollut. R.. 2017;24:2890-2903.
- [Google Scholar]
- Freshwater lake ecosystem shift caused by social-economic transitions inYangtze River Basin over the past century. Sci. Rep-UK. 2018;8:17146.
- [Google Scholar]
- Direct desorption/ionization of analytes by microwave plasma torch for ambient mass spectrometric analysis. J. Mass Spectrom.. 2013;48:669-676.
- [Google Scholar]
Appendix A
Supplementary material
Supplementary data to this article can be found online at https://doi.org/10.1016/j.arabjc.2020.09.024.
Appendix A
Supplementary material
The following are the Supplementary data to this article:Supplementary data 1
Supplementary data 1


