

Translate this page into:
Anti-inflammatory effects of Scutellaria baicalensis water extract in LPS-induced THP-1 Macrophages through metabolomics study
⁎Corresponding author. xzhuaf@nwnu.edu.cn (Xinliang Zhu),
-
Received: ,
Accepted: ,
This article was originally published by Elsevier and was migrated to Scientific Scholar after the change of Publisher.
Peer review under responsibility of King Saud University.
Abstract
(1) Background: Scutellaria baicalensis (Huang Qin) is a traditional Chinese Medicine possess beneficial effects of anti-inflammation in various diseases. In this study, we aimed to use untargeted metabolomics approach to investigate the possible underlying metabolic mechanisms of anti-inflammation effects of Scutellaria baicalensis in LPS-induced macrophages.; (2) Methods: Scutellaria baicalensis water extract (SBE) were applied to the THP-1 cells which were induced by phorbol 12-myristate 13-acetate (PMA) into macrophages under the LPS treated conditions. The cell lysate were collected and metabolites were extracted before characterizing by ultra-performance liquid chromatography (UPLC) combined with Q-Exactive mass/mass spectrometry (LC-MS/MS). The differential accumulated metabolites and related metabolism pathways affected by SBE in LPS-induced macrophages were identified. Further investigation of the secretion and expression of inflammatory cytokines IL-1β, TNF-ɑ and VEGFR were tested by real-time polymerase chain reaction (RT-PCR). (3) Results: The metabolome profile have indicated that retinol metabolism, arachidonic acid metabolism and linoleic acid metaoblism pathways were the most significantly enriched pathways response to SBE in LPS induced inflammatory model. Besides, SBE could inhibit the expression of the pro-inflammatory cytokines IL-1β and TNF-ɑ, and downregulation of the macrophage migration accelerator VEGFR1 in a dose dependent manner; (4) Conclusions: These findings indicated that SBE may exerted anti-inflammatory ability by regulating multiple fatty acids metabolism pathways as well as inhibiting the secretion of pro-inflammatory cytokines and VEGFR. This study provides evidences for Scutellaria baicalensis as the material for developing natural, effective anti-inflammatory products.
Keywords
Scutellaria baicalensis
Anti-inflammation
Metabolomics
Fatty acids metabolism

1 Introduction
Inflammation is the body's response to infections or various harmful stimuli and injuries. Lipopolysaccharide (LPS) is a significant component of gram-negative bacteria's outer membrane (Laugerette et al., 2011), and it can activate macrophages, neutrophils, dendritic cells, and other cell types, causing inflammation, oxidative stress, and endotrophic damage. TNF-ɑ, interleukin (IL)-6, IL-1β (Xie et al., 2014), cyclooxygenase-2 (COX-2) and inducible nitric oxide synthase (iNOS) are among the pro-inflammatory mediators secreted by macrophages when they are stimulated by LPS. MAPK controls the expression of pro-inflammatory cytokines like TNF-ɑ and IL-6. Extracellular signal-regulated kinase (ERK), p38, and c-Jun N-terminal kinase are all members of the MAPK family (JNK). Nuclear factor-B (NF-κB) is involved in the activation of MAPKs and the phosphatidylinositol 3-kinase (PI3K)/Akt signaling pathway, as well as the production of immunological and inflammation-related genes (Author 1, A.B. (University, City, State, Country); Author 2, C. (Institute, City, State, Country), 2012). When LPS and other microbial products bind to CD14, toll-like receptors 4 and 2 are thought to be the major signaling receptors. Furthermore, various signal intermediates play a role in LPS-induced cell activation, including the activation of the transcription factor NF-κB, which has been discovered and characterized (Zhang and Ghosh, 2000). Typically, macrophages stimulated by LPS show one or more of the key metabolic alterations listed below, such as citrulline and nitric oxide generation pathways (Rath et al., 2014), glycolytic (Rodríguez-Prados et al., 2010), and so on. Fatty acid oxidation and mitochondrial metabolism are reduced when AMP-activated protein kinase is inactivated in cells. These actions enhance inflammatory mediator production while inhibiting the catabolic route of AMPK enzymes (Sag et al., 2008).(See Fig. 1).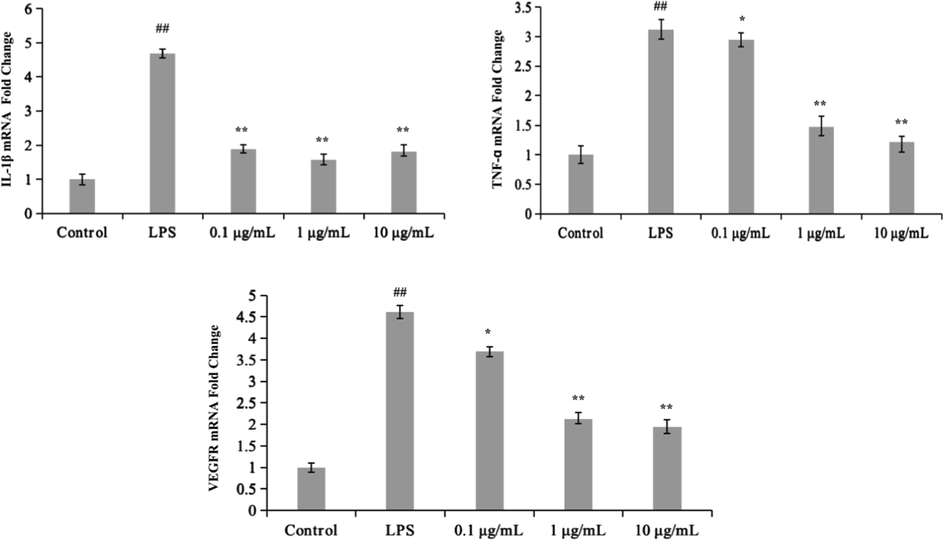
Effects of SBE on the production of pro-inflammatory cytokines (IL-1β, TNF-ɑ and VEGFR) in LPS-induced Macrophages (THP-1) cells. All the experiments were repeated at least three times and similar results were observed. Values are mean ± SE, (n = 4 samples/ group). # p < 0.05 and ## p < 0.01 compare with Control group, * p < 0.05 and ** p < 0.01 mean compare with LPS group.
Scutellaria baicalensis, a Chinese medicinal perennial herb, contains anti-inflammatory, antiviral, anti-tumor, antioxidant, and antibacterial properties, among others. It can be used to treat respiratory tract infections, pneumonia, colitis, hepatitis, and a variety of other ailments. Baicalin, baicalein, wogonin, and other active chemicals are used to treat allergy diseases (Liao et al., 2021). These active compounds have been the subject of numerous anti-inflammatory investigations. By suppressing NF-B and boosting the mTOR signal, baicalin can regulate downstream inflammation and oxidation after DON activation, lowering intestine inflammation and oxidative damage. (Liao et al., 2020). In BV-2 cells stimulated by LPS, baicalein inhibits the synthesis of nitric oxide (NO), IL-6 and tumor necrosis factor (TNF-ɑ). Baicalein also decreases the expression of cyclooxygenase-2 (COX-2) and nuclear factor-b (NF-κB) /p65 (Yan et al., 2020) and suppresses the generation of reactive oxygen species (ROS). Scutellaria baicalensis' anti-inflammatory properties are linked to its ability to block the synthesis of NO, cytokines, chemokines, and growth factors in macrophages. Scutellariae baicalensis has been proven to affect NO, IL-3, IL-6, and IL-1β in RAW 264.7 cells generated by LPS in studies. Inhibitory cytokines include IL-12p40, IL-17, interferon-inducible protein (IP)-10, keratinocyte-derived chemokine (KC), and vascular endothelial growth factor (VEGF) (Yoon et al., 2009). Thus, research on the anti-inflammatory properties of scutellaria baicalensis extracts or specific active components in scutellaria baicalensis has yielded very consistent results, however there are few studies on the metabolism of its anti-inflammatory activities. Metabolic investigations on the anti-inflammatory mechanism of SBE on LPS-induced macrophage provide a new perspective for the research of Scutellaria baicalensis' anti-inflammatory benefits.
2 Materials and methods
2.1 Materials
Scutellaria baicalensis root purchased from Lanzhou Focixicheng Pharmaceutical Co., ltd. (Lanzhou, Gansu, China) and were authenticated by Prof. Fude Yang (Gansu University of Traditional Chinese Medicine, Lanzhou, China). Lipopolysaccharide (LPS) was purchased from Sigma-Aldrich (St. Louis, MO, USA). The 0.05 % trypsin and penicillin–streptomycin (PS) were purchased from Invitrogen (Carlsbad, CA, USA). RPMI-1640 medium and fetal bovine serum (FBS) were obtained from Sigma-Aldrich Chemicals Company (St. Louis, MO, USA). The FastKing gDNA Dispelling RT SuperMix kit and the SYBR Green QuantiTect RT-PCR Kit were purchased from TIANGEN (Beijing, China).
2.2 Scutellaria baicalensis water extract (SBE) preparation and compound identification
Weigh 500 g of the washed, dried and crushed Scutellaria baicalensis, put it in a round-bottomed flask, add 5 L distilled water to boil for 2 h each time, extract three times in total, combine the three crude extracts, filter and transfer them to another circle in batches reflux extraction in a bottom flask, and the reflux solution is filtered with a 0.22 μm filter membrane and then lyophilized for later use. The chemical constituents of SBE were determined by LC-QTOF MS/MS analysis according to the reference (Qiao et al., 2016). Raw Data acquisition and processing were carried out by Mass Hunter Workstation software. The details of the identified components were summarized in Table 1.
No.
identified Compounds
Retention time (min)
MS1 (m/z)
Molecular Formula (M − H)−
MS/MS Fragments (m/z)
UV (λ max, nm)
1
Chrysin-6-C-ara-8-C-glu
5.61
547.1567
C26H27O13
510, 487, 457, 367
272, 314
2
Chrysin-6-C-glu-8-C-ara
8.30
547.1563
C26H27O13
510, 487, 457, 367
272, 314
3
Baicalin
16.29
445.861
C21H17O11
269
276, 314
4
Dihydrobaicalin
17.98
447.1012
C21H19O11
271
285
5
Baicalein-6-glucuronide
21.50
445.8525
C21H17O11
269
280
6
Oroxylin A-7-O-β-d-glucuronide
22.13
918.2037
C22H19O11
283,268
271, 311
7
Wogonoside
25.69
459.1015
C22H19O11
283, 268, 175
273
8
Baicalein
28.43
269.5094
C15H9O5
195
275, 321
9
5,7,4-Trihydroxy-8-methoxy flavone
29.71
299.2589
C16H11O6
284
268,333
10
Wogonin
31.12
283.6706
C16H11O5
268
275
11
Skullcapflavone Ⅱ
31.73
373.9983
C19H17O8
343
275
12
Chrysin
33.92
253.5595
C15H9O4
143
269
13
Oroxylin A
35.20
283.6726
C16H11O5
268
270
2.3 Cell culture and treatment
Macrophages (THP-1) were cultured in RPMI-1640 medium with 10 % fetal bovine serum and 100 U/ mL penicillin (Beyotime, Shanghai, China) and 100 μg/ mL streptomycin (Beyotime, Shanghai, China) at 37 ◦C, in a 5 % CO2 humidified incubator. The cell and animal experiment protocol was approved by the animal ethics committee of Xi’an Jiaotong University’s School of Life Science and Technology (approval Nr. SCXK (Shaan) 2017–003). Before experimental treatment, the differentiation process of THP-1 cells to macrophages was performed in stimulation for 72 h by 100 nM phorbol 12-myristate 13-acetate (PMA; Sigma-Aldrich, owned by Merck, Gillingham, UK) PMA. Either SBE-containing medium or regular medium was applied for inflammation model THP-1 cells, which were built by 12 h of 1 μg/ mL of LPS pretreatment. Cells were treated with SBE-containing medium for 12 h with different concentrations (0.1 μg/ mL, 1 μg/ mL, and 10 μg/ mL, respectively) before RNA or metabolite extraction, as indicated in Table 2.
Groups
LPS treatment
SBE treatment
Control
Regular medium
Regular medium
LPS
12 h
Regular medium
0.1 μg/ mL SBE
12 h
12 h
0.1 μg/ mL SBE
12 h
12 h
0.1 μg/ mL SBE
12 h
12 h
2.4 Preparation of sample for metabolomics LC-MS/MS
After 12 h of culture, the metabolites were extracted. The culture medium was gently sucked off (to avoid sucking off adherent cells). Pre-cooled acetonitrile: methanol: water = 2: 2: 1, v/ v), vortexed and ultrasonic at low temperature for 10 min, incubated at − 20 °C for 10 min, centrifuged at 4 °C for 20 min at 14,000 g, and vacuum dried the supernatant before LC-MS/MS analysis, samples were kept at − 80 °C. Each sample received 150 mL of acetonitrile aqueous solution (acetonitrile: water = 1: 1 v/ v). The mixture was then vortexed for 1 min before centrifugation at 14,000 g for 15 min at 4 °C. Take the supernatant and vacuum dry it in the centrifuge tube. Each test sample was combined equally to make a quality control (QC) sample. The analytical method for the QC sample was the same as for the test samples, and the QC sample was inserted for every-five test samples to check the instrument's stability and performance.
2.5 Metabolomcis LC-MS/MS analysis
As previously stated, the material was evaluated on a Thermo ScientificTM VanquishTM UHPLC system (Thermo). The separation of metabolites was accomplished using a C18 column (Thermo Hypersil Gold C18, 100 mm × 2.1 mm, 1.8 μm) linked to a Thermo Q Exactive mass spectrometer. The mobile phase consisted of 0.1 percent formic acid in water (A) for positive mode, 5 mM ammonium acetate in water (A) for negative mode, and acetonitrile (B) with the following gradient conditions: 0 min-1 min, 1 % B; 1–8 min, 1 %- 99 % B; 8–10 min, 99 % B; 10–10.1 min, 99 %- 1 % B; 10.1–12 min, 1 % B. The sample injection volume was 4 μL, the column temperature was 35 °C, and the flow rate was 0.3 mL/ min. The Q Exactive Orbitrap Mass Spectrometer (Thermo Fisher Scientific, Bremen, Germany) was utilized for mass spectrometric analysis, which employed electrospray ionization sources in both positive and negative ionization modes. The following were the operational parameters: Positive polarity, 4.0 kV (positive) or − 3.6 kV (negative) spray voltage, funnel RF lens value of 50, capillary temperature of 400 °C Sheath gas, aux gas, and sweep gas flow rates were set at 45, 15, and 0 mL/ min, respectively. Unless otherwise stated, data dependent acquisition (DDA) was performed utilizing the Full MS-ddMS2 configuration. The mass range was set to 100–1500 and the full MS resolution was set to 70000. Resolution was adjusted to 17,500 for MS-2 spectra. The normalized collision energy was set to 20 %, 40 %, and 60 %, respectively. The dynamic exclusion time was set to 5 s.
2.6 Real-time PCR assay
The total RNA of Macrophages (THP-1) cells was extracted with Trizol reagent using the supplier’s protocol. After the concentration of RNA was measured by a spectrophoto-meter at 260 nm and 280 nm absorbance, the RNA was reverse-transcribed (RT) into cDNA with the FastKing gDNA Dispelling RT SuperMix kit according to the manufacturer’s instructions. The primer sequences used in this study were as follows: 5′-ATTGCCGACAGGATGCAGAA-3′ (forward) and 5′-GCTGATCCACATCTGCTGGA A-3′ (reverse) for β-a-ctin; 5′-CCTAATCCCTTTA-3′ (forward) and 5′-GTGGTTGCCA GCACTTCACT-3′ (reverse) for TNF-ɑ; 5′-TGAAATGATGGCTT ATTACAGT GG C-3′ (forward) and 5′-GCTGTAGTGGTGGTCGGAGATT-3′ (reverse) for IL-1β; 5′-CCTTGCCTTGCTGCTCTACC-3′(forward) and 5′-AGATGTCCACCAGGGTCTCG-3′ (reverse) for VEGFR. The real-time PCR was then analyzed with a SYBR Green QuantiTect RT-PCR Kit, and each sample was independently analyzed three times. The PCR amplification was performed with 40 cycles of denaturation at 95 °C for 10 s, annealing at 55 °C for 20 s and extension at 72 °C for 30 s. The relative levels of gene expression of each mRNA were calculated by normalization to β-actin mRNA expression according to the 2-△△CT method.
2.7 Data analysis
Microsoft Excel was used to organize and plot the data. Using XCMS online service, the matching peak data were extracted from the original LC-MS data, and the peak area data were normalized in Microsoft Excel 2010. The standardized data was then further analyzed in MetaboAnalyst 5.0 web server (https://www.metaboanalyst.ca) using orthogonal partial least squares (OPLS) and volcano map. Fold change (FC)-value (FC > 2) and Students’s t-test (p < 0.05) were used to determine the difference metabolites. MetaboAnalyst 5.0 and KEGG pathway enrichment analysis was used to identify possible biomarker metabolic pathways, and the comprehensive metabolic network was built based on the relationships between the identified potential biomarkers in the metabolic pathways. R 4.1.1 was used to map the bubble map of the Pathway Enrichment analysis. Use origin(2021b) to plot RT-PCR data.
3 Results
3.1 Effects of SBE on gene expression of inflammatory cytokines
To test the effects of SBE on inflammatory process in LPS-induced macrophages (THP-1), we investigated the changes of pro-inflammatory cytokine production. Cells were treated with SBE (0.1 μg/ mL, 1 μg/ mL and 10 μg/ mL) for 1 h of pre-protection and then treated with LPS for 6 h, the mRNA levels of pro-inflammatory cytokines (IL-1β, TNF-ɑ and VEGFR) were measured by real-time PCR (RT-PCR). As shown in the Fig. 4, the relative expression of TNF-ɑ mRNA, IL-1β mRNA and VEGFR mRNA expression were significantly increased in LPS induced macrophages (THP-1) (p < 0.01). Meanwhile, results showed that SBE observably inhibited the mRNA expression of pro-inflammatory cytokines (IL-1β, TNF-α and VEGFR) in a dose-dependent manner.
3.2 Metabolomics profiling and differential accumulated metabolites (DAMs) analysis
To understand the profiling changes of metabolome upon SBE treatment, a metabolomics investigation was performed. With positive ion mode (POS) and negative ion mode (NEG), LC-MS/MS was utilized to identify the metabolic features of macrophages (THP-1) from the different concentration of SBE treatment groups, LPS group, and control group. The OPLS-DA (Orthogonal Partial Least Squares Projector Discriminant Method) was firstly applied, which is a supervised algorithm that can filter orthogonal variables in the sample metabolites that are not related to the classification variables and pays more attention to the actual changes in category recognition to obtain more reliable differential metabolite data. The LPS treatment group was considerably different from the other groups in the OPLS-DA results (Fig. 2), suggesting that the LPS-induced inflammatory response can adversely alter cellular metabolism. The LPS group differs from the control group in a substantial way, together with RT-PCR results were demonstrating that the LPS model is successful at generating inflammation. The metabolite profiles within five groups were notably varied, indicating that there was effective separation.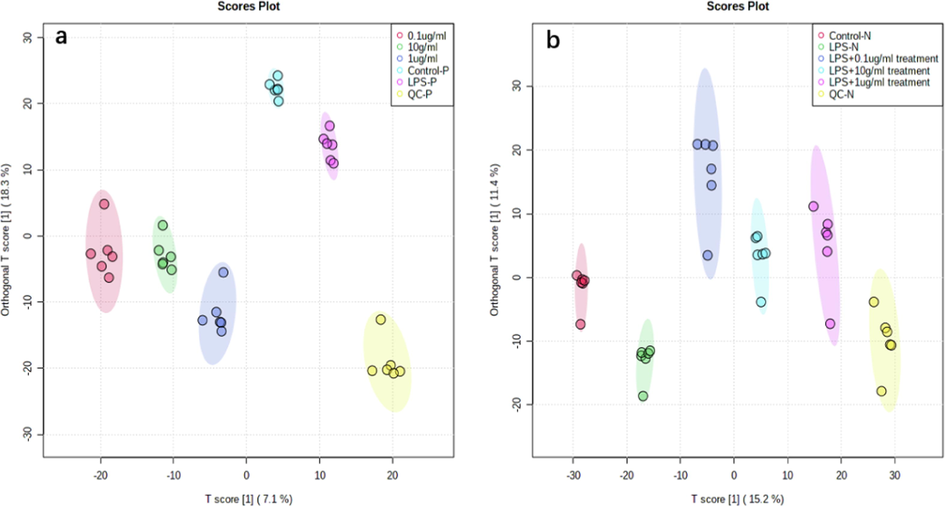
Scores plots for the OPLS-DA analysis of data. In positive mode (a), negative mode (b) OPLS-DA scores plots, each point represents one sample. The T score axis represents the predictive variation among the classes and the orthogonal T score axis represents the variation orthogonal to the class-specific variation. In the OPLS-DA model, variables (metabolites) with differing importance in the project (VIP)-values > 1 were selected for independent Student’s t-tests.
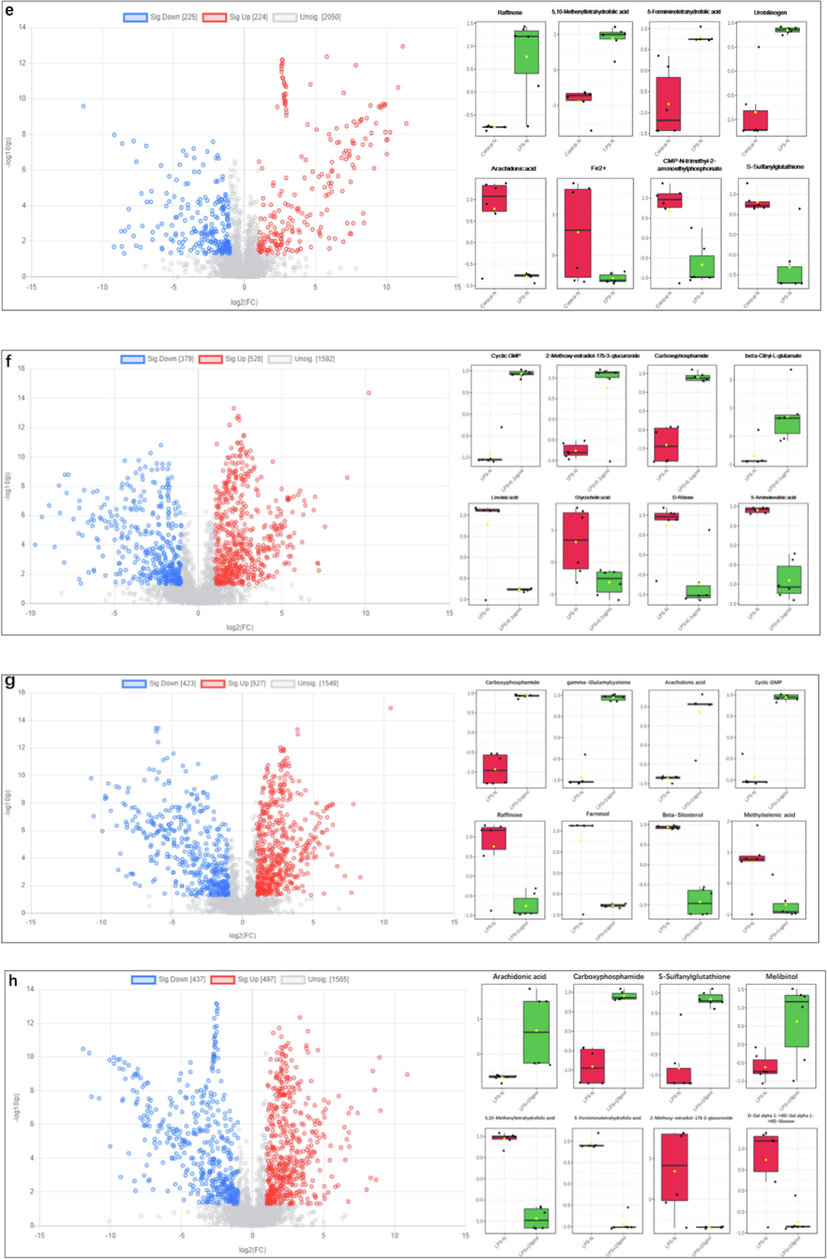
Volcano plot is a kind of image used to display the different data between groups. Each point represents a metabolite, and the color is used to distinguish whether metabolites are differentially accumulated. The blue and red points in the picture represent differentially accumulated down-regulated and up-regulated metabolites, and the black points represent no differentially metabolites. In order to collect differentially accumulated metabolites (DAMs), fold change (FC) > 2 and Student’s t-test p-value (p < 0.05) in volcano map (Fig. 2). As shown in (Fig. 3a, LPS vs Control (POS)), there are 269 up-regulated and 134 down-regulated DAMs, such as 3a,7a-dihydroxy-5b-24-oxocholestanoyl-CoA, methylselenopyruva-te, 4-hydroxyphenylacetaldehyde, 3a,7a,12a-trihydroxy-5b-cholestan-26-al, cinnavalininate, orotidylic acid, alpha-d-glucose 1,6-bisphosphate, n-acetylserotonin, etc. As shown in (Fig. 3b, 0.1 μg/ mL SBE vs LPS (POS)), there are 307 up-regulated and 241 down-regulated DAMs, such as uridine 5′-monophosphate, ADP, uridine diphosphate glucose, liothyronine, caff-eine, normetanephrine, thymidine, l-arginine, etc. As shown in (Fig. 3c, 1 μg/ mL SBE vs LPS (POS)), there are 270 up-regulated and 317 down-regulated DAMs, such as uridine 5′-mono-phosphate, ADP, (GlcN)1(Ino(acyl)-P)1(Man)1, cinnavalininate, normetanephrine, n-argini-ne, aminoadipic acid, 4-Imidazolone-5-propionic acid, etc. As shown in (Fig. 3d, 10 μg/ mL drug vs LPS (POS)), there are 233 up-regulated and 234 down-regulated DAMs, such as 5,6-dih-ydro-5-fluorouracil, ADP, pantothenic acid, (GlcN)1(Ino(acyl)-P)1(Man)1, protoporphyrin-IX, 3-dechloroethylifosfamide, aminoadipic acid, gentisic acid, etc. As shown in (Fig. 3e, LPS vs Control (NEG)), there are 224 up-regulated and 225 down-regulated DAMs, such as raffinose, 5,10-methenyltetrahydrofolic acid, 5-formiminotetrahydrofolic acid, urobilin-ogen, arachidonic acid, Fe2+, CMP-n-trimethyl-2-aminoethylphosphonate, s-sulfanylglutat-hione, etc. As shown in (Fig. 3f, 0.1 μg/ mL SBE vs LPS (NEG)), there are 528 up-regulated and 379 down-regulated DAMs, such as cyclic GMP, 2-methoxy-estradiol-17b 3-glucuronide, carboxyphosphamide, beta-citryl-l-glutamate, linoleic acid, glycocholic acid, d-ribose, 5-aminolevulinic acid, etc. As shown in (Fig. 3 g, 1 μg/ mL SBE vs LPS (NEG)), there are 527 up-regulated and 423 down-regulated DAMs, such as carboxyphosphamide, gamma-glutamylcysteine, arachidonic acid, cyclic GMP, raffinose, farnesol, beta-sitosterol, methylselenic ac-id, etc. As shown in (Fig. 3h, 10 μg/ mL SBE vs LPS (NEG)), there are 497 up-regulated and 437 down-regulated DAMs, such as arachidonic acid, carboxyphosphamide, s-sulfanylglutathio-ne, melibiitol, 5,10-methenyltetrahydrofolic acid, 5-formiminotetrahydrofolic acid, 2-met-hoxy-estradiol-17b, 3-glucuronide, d-gal alpha 1->6D-gal alpha 1->6D-glucose, etc. Besides, multiple metabolites including 5,6 dihydroxyindole, pyrodoxine, 6-thiourate, glycine, 3a-7b-12a-Trihydroxy-5a-Cholanic acid are up-regulated by LPS are really reverse regulated by SBE, while naphthalene, uridine-diphosphate-N-acetleglucosamne, s-(2-Choroacetyle)glutathione, Taurocholic acid, palmitic acid and 5,6-Epoxy-8,11,14-eicosatreinoic acid are down-regulated by LPS are reverse regulated by SBE.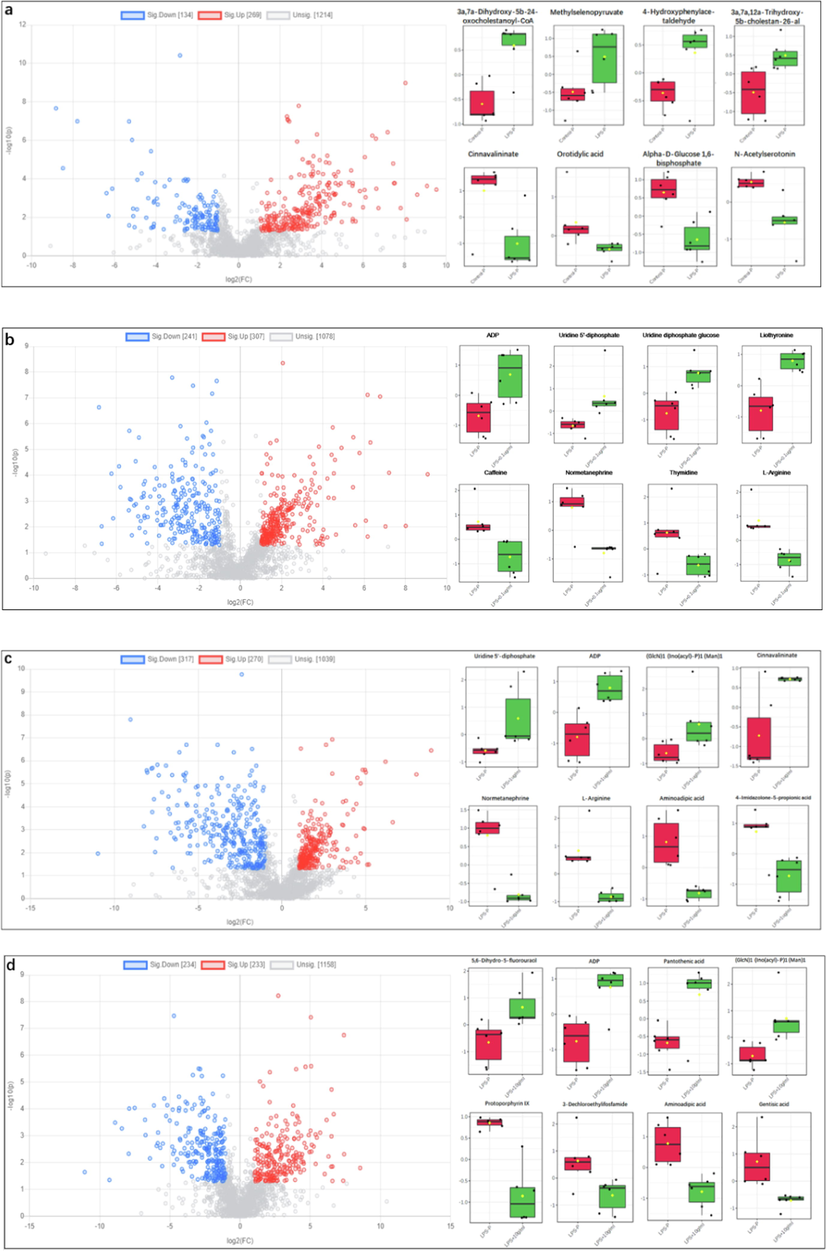
Differential analysis of metabolites. Plot and different metabolites box plots using MetaboAnalyst 5.0 (p-value < 0.05, fold change (FC) > 2). (a) LPS vs Control (POS), (b) 0.1 μg/ mL SBE vs LPS (POS), (c) 1 μg/ mL SBE vs LPS (POS), (d) 10 μg/ mL drug vs LPS (POS), (e) LPS vs Control (NEG), (f) 0.1 μg/ mL SBE vs LPS (NEG), (g) 1 μg/ mL SBE vs LPS (NEG), (h) 10 μg/ mL SBE vs LPS (NEG).
Differential analysis of metabolites. Plot and different metabolites box plots using MetaboAnalyst 5.0 (p-value < 0.05, fold change (FC) > 2). (a) LPS vs Control (POS), (b) 0.1 μg/ mL SBE vs LPS (POS), (c) 1 μg/ mL SBE vs LPS (POS), (d) 10 μg/ mL drug vs LPS (POS), (e) LPS vs Control (NEG), (f) 0.1 μg/ mL SBE vs LPS (NEG), (g) 1 μg/ mL SBE vs LPS (NEG), (h) 10 μg/ mL SBE vs LPS (NEG).
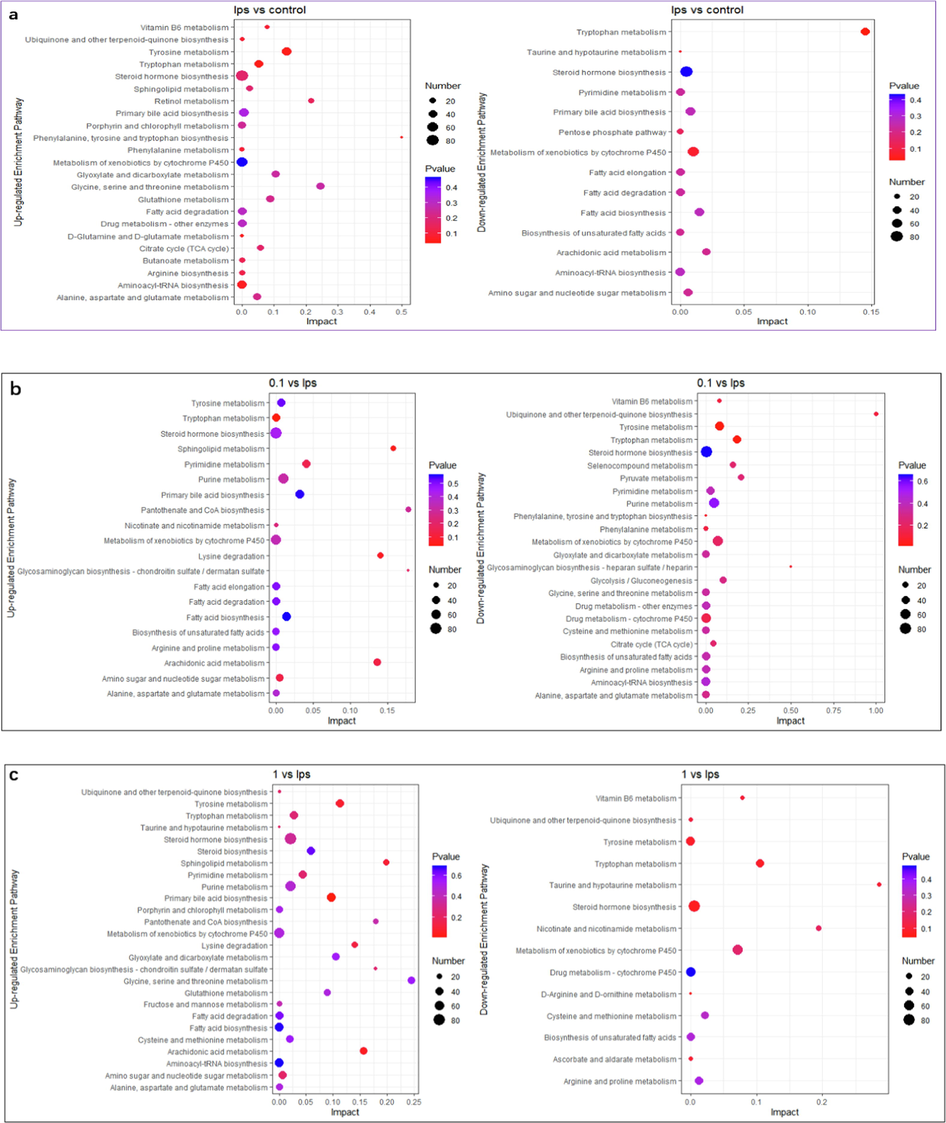
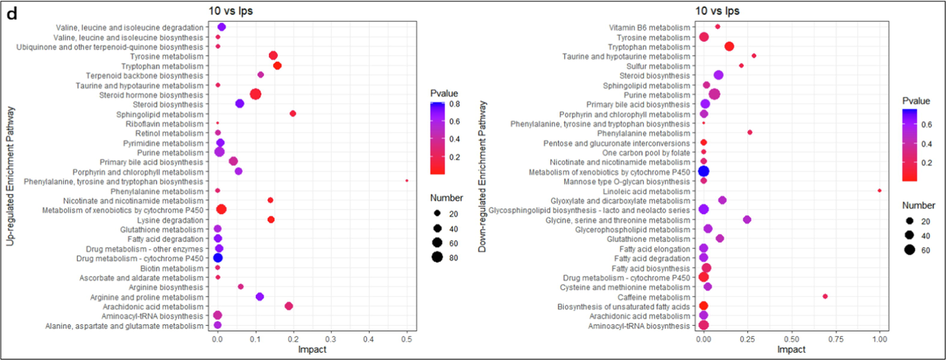
Enrichment analysis of differential metabolite pathways. The names of up-regulated metabolite enrichment pathways and down-regulated metabolite enrichment pathways are on the left side. The enrichment factor (Impact) is represented by the horizontal axis, the bubble size is the number of distinct metabolites engaged in this pathway, and the bubble color is the metabolic pathway's super metric test p-value. (a) LPS vs Control, (b) 0.1 μg/ mL SBE vs LPS, (c) 1 μg/ mL SBE vs LPS, (d) 10 μg/ mL SBE vs LPS.
Enrichment analysis of differential metabolite pathways. The names of up-regulated metabolite enrichment pathways and down-regulated metabolite enrichment pathways are on the left side. The enrichment factor (Impact) is represented by the horizontal axis, the bubble size is the number of distinct metabolites engaged in this pathway, and the bubble color is the metabolic pathway's super metric test p-value. (a) LPS vs Control, (b) 0.1 μg/ mL SBE vs LPS, (c) 1 μg/ mL SBE vs LPS, (d) 10 μg/ mL SBE vs LPS.
3.3 Enrichment analysis of differential metabolite pathways
We further investigated the disturbed metabolic pathways by enriching the differential metabolites acquired from the previous analysis. As shown in (Fig. 4a, LPS vs Control), the key enrichment pathways of up-regulated metabolites were porphyrin and chlorophyll metabolism, primary bile acid biosynthesis, glutathione metabolism, one carbon pool by folate, the main enrichment pathways of down-regulated metabolites were phosphonate and phosphinate metabolism, arachidonic acid metabolism, glycosylphosphatidylinositol (GPI)-anchor biosynthesis. As shown in (Fig. 4b, 0.1 μg/ mL SBE vs LPS), the key enrichment pathways of up-regulated metabolites were retinol metabolism, tyrosine and tryptophan biosynthesis, phenylalanine metabolism, glycosylphosphatidylinositol (GPI)-anchor biosynthesis, sulfur metabolism, sphingolipid metabolism, pyrimidine metabolism, the top enrichment pathways of down-regulated metabolites were linoleic acid metabolism, ubiquinone and other terpenoid-quinone biosynthesis, caffeine metabolism, terpenoid backbone biosynthesis, alpha-linolenic acid metabolism, vitamin B6 metabolism, taurine and hypotaurine metabolism, phenylalanine metabolism, folate biosynthesis. As shown in (Fig. 4c, 1 μg/ mL SBE vs LPS), the key enrichment pathways of up-regulated metabolites were drug metabolism-cytochrome P450, vitamin B6 metabolism, arachidonic acid metabolism, glycosylphosphatidylinositol (GPI)-anchor biosynthesis, tryptophan metabolism, sulfur metabolism, biosynthesis of unsaturated fatty acids, the top enrichment pathways of down-regulated metabolites were linoleic acid metabolism, phenylalanine metabolism, tyrosine and tryptophan biosynthesis, histidine metabolism, terpenoid backbone biosynthesis, taurine and hypotaurine metabolism, tryptophan metabolism. As shown in (Fig. 4d, 10 μg/ mL SBE vs LPS), the main enrichment pathways of up-regulated metabolites were drug metabolism-cytochrome P450, retinol metabolism, arachidonic acid metabolism, nicotinate and nicotinamide metabolism, sulfur metabolism, glycosylphosphatidylinositol (GPI)-anchor biosynthesis, fatty acid elongation, sphingolipid metabolism and the main enrichment pathways of down-regulated metabolites were linoleic acid metabolism, vitamin B6 metabolism, taurine and hypotaurine metabolism, tryptophan metabolism, porphyrin and chlorophyll metabolism. Among those pathways, tyrosine metabolism and glycine metabolism are up-regulated by LPS are really reverse regulated by SBE, while fatty acid elongation and arachidonic metabolism are down-regulated by LPS are reverse regulated by SBE.
The above affected metabolic pathways were classified and found mainly enriched in the lipid metabolism, nucleotide metabolism, amino acid metabolism and metabolism of cofactors and vitamins.
4 Discussion
Inflammation is a natural defense mechanism designed to keep the body safe from infection. Chemotactic agents are produced and endothelial cell adhesion molecules are activated during inflammation. Physiological media are vital in the protection of the host. They can cause substantial tissue damage if created incorrectly or in an incorrect proportion. Polyunsaturated fatty acids (PUFA), particularly arachidonic acid (AA) and linoleic acid (LA), are important mediators of inflammation (Qiao et al., 2016). AA is converted to eicosanoids by the enzymes lipoxygenase (LOX) and cyclooxygenase (COX). Eicosanoids are potent anti-inflammatories. Arachidonic acid metabolism is up-regulated in the SBE treated groups, according to our findings. This outcome is not what we anticipated. However, we discovered that the cytochrome P450 metabolism is up-regulated in the same groups. The cyclooxygenase and hydroxylase enzymes of the cytochrome P450 family may both produce and metabolize organisms. Active mediator that regulates the inflammatory response by activating and suppressing it. Arachidonic acid may be converted to anti-inflammatory epoxyeicosatrienoic acids by the cyclooxygenases CYP2C and CYP2J (Calder, 2017), and epoxyeicosatrienoic acid has been shown to protect against a range of disorders, including cardiovascular disease and metabolic syndrome (Schuck et al., 2014). Furthermore, with chronic inflammation and LPS exposure, CYP expression and activity normally declines (Christmas, 2015). The cytochrome P450 metabolism pathway is up-regulated when we use SBE to treat inflammatory macrophages, suggesting that SBE can affect cytochrome P450 cyclooxygenase and hydroxylase to exert anti-inflammatory effects by up-regulating the cytochrome P450 metabolism pathway. Another acid that can create major inflammatory mediators is linoleic acid. It is the starting point for all omega-6 fatty acids. The metabolites − 9 and 13-hydroxyoctadecenoic acid (9-HODE and 13-HODE) are oxidative stress indicators. Linoleate controls pro-inflammatory cytokines via the JNK and NF-κB pathways (Aitken et al., 2006). The conventional NF-κB pathway is primarily characterized as the response to TNF-ɑ and IL-1β signals. The c-Jun amino-terminal kinase (JNK) pathway is a subgroup of MAP kinases that is primarily composed of cytokines (such as TNF-ɑ and IL-1β) and environmental stresses such as osmotic stress, redox stress, and radiation activation (Maruyama et al., 2014). Real-time PCR results showed that SBE can significantly reduce the inflammatory factors TNF-ɑ and IL-1β. Furthermore, metabolomics studies demonstrate that linoleic acid metabolism is down-regulated in the SBE treated groups, suggesting that SBE inhibits inflammatory factors via the JNK and NF-κB signal pathways, resulting in anti-inflammatory actions. VEGF, or vascular endothelial growth factor, is a potent angiogenesis and permeability agent. Studies have shown that camphor lactone can inhibit inflammatory cytokines (IL-1β, IL-6, IL-8, IFN-γ, TNF-ɑ, HIF-1ɑ, and VEGF) production, as well as reduce the expression of HIF-1 and VEGF protein (Berkman et al., 1993), which is consistent with our RT-PCR results. On the other hand, metabolomics studies demonstrate that sphingolipid metabolism is up-regulated, suggesting that Scutellaria baicalensis' anti-inflammatory action on LPS-induced macrophages may also be due to sphingolipid regulation.
The glycosylphosphatidylinositol (GPI)-anchor biosynthesis metabolic pathway is up-regulated in the treatment of inflammation by SBE. GPI-APs function as enzymes, cell surface antigens, signal receptors, cell adhesion and migration molecules, among other things. Signal transmission through GPI-APs is thought to have a synergistic impact with the activation of the T cell receptor complex in the signal transduction process of T cells. CD48 of GPI-APs has recently been identified to mediate IL-18 activation of T cells and natural killer (NK) cells (Cheng et al., 2020). IFN-γ may induce the expression of MHC class II antigens in monocytes, macrophages, dendritic cells, skin fibroblasts, vascular endothelial cells, stellate cells, and other cells, therefore activating pancreatic kinase and eventually producing interferon-gamma (IFN-γ). IFN-γ may also boost the production of FcR in macrophages, upregulate the expression of ICAM-1 (CD54) in endothelial cells, and synergistically activate TNF-ɑ and encourage macrophages to destroy harmful bacteria. According to studies, BTK kinase phosphorylates cytoplasmic IFN-γR2, interacts to the EFHD2 protein, and facilitates IFN-γR2 transport from the Golgi apparatus to the cell membrane, triggering macrophage immunological responses to bacterial infections (Fukushima et al., 2005). As a result, we hypothesize that Scutellaria baicalensis extract can impact the manufacturing of glycosylphosphatidylinositol (GPI)-anchors and the signaling of GPI-APs to create interferon (IFN-γ) and so exercise its anti-inflammatory action. Activated T cells create reactive oxygen species as part of their immunological activity, which triggers the anti-oxidant glutathione (GSH) response, which is required to buffer the rise of reactive oxygen species and avoid cell damage. Endogenous antioxidants, particularly glutathione, are used by activated T lymphocytes to regulate their rising levels of reactive oxygen species. We also discovered that glutathione metabolism is up-regulated in the model group, suggesting that inflammation activates the antioxidant glutathione (GSH) response, and proliferating T cells require fatty acids to produce lipids and membranes (Xu et al., 2018). After the Scutellaria baicalensis extract processed inflammatory cells, glutathione metabolism was remained up-regulated. At the same time, fatty acid synthesis-related metabolic pathways are up-regulated. We hypothesize that this is to guarantee that growing T cells get the fatty acids they require to perform their immunological functions effectively.
In COVID-19 infected rhesus monkeys, inflammatory cytokines such as IL-6, M-CSF, IP-10, GM-CSF, IL-18, IL-1β, and IL-1β have been found to be strongly associated with arginine metabolism, tryptophan metabolism, NAD + metabolism, purine and pyrimidine metabolism, cysteine and methionine metabolism, TCA cycle, and primary bile acid metabolism. First, tryptophan metabolism is activated by the release of interferon and other cytokines in response to inflammation, and the kynurenine (Kyn) pathway of tryptophan (Trp) metabolism is the most active pathway of Trp metabolism, which is initiated by tryptophan 2,3-dioxygenase (TDO) and indoleamine 2,3-dioxygenase (IDO1 and IDO2) (Xiao et al., 2021). iDO-dependent Trp metabolism is strongly activated by the release of interferon we discovered that tryptophan metabolism was down-regulated after treatment with SBE, suggesting that SBE may exert anti-inflammatory effects by modulating tryptophan metabolites like IDO1 and kynurenine in kynurenine metabolism, which is consistent with previous findings (Sorgdrager et al., 2019). Second, purine metabolism was modulated in the SBE treated group in current study. Nucleotides are significant as DNA and RNA precursors, activation intermediates in many biosynthetic processes, and metabolic regulators (Chang et al., 2018). A research shows purine metabolism may have a role in rheumatoid arthritis patients (Wei et al., 2018). Adenosine in purine metabolism has anti-inflammatory properties. LPS-induced macrophages displayed aberrant purine metabolism, which impacted nucleotide metabolism in this research. Our usage of SBE increased purine metabolism to some extent, indicating that SBE may control purine metabolism to exert its anti-inflammatory action.
Finally, we discovered that several cofactor and vitamin metabolism pathways were impacted, and that the majority of the metabolites in these pathways were essential anti-inflammatory agents or cofactors in their metabolic pathways. Vitamin B6 metabolism, in the form of FAD and pyridoxal 5′-phosphate (PLP), for example, is a cofactor in the kynurenine pathway and works as a marker in IFN-mediated immune activation (van Ede et al., 2002). Purine metabolism is strongly linked to porphyrin and chlorophyll metabolism, and porphyrins are a class of physiologically essential macrocyclic tetrapyrrole molecules. They are located in the centers of oxygen-carrying proteins (like haemoglobin) and a number of essential enzymes, especially those involved in cellular oxidation and reduction (Theofylaktopoulou et al., 2014). Heme and cobalamin, on the other hand, are iron and cobalt chelates of porphyrins or porphyrin derivatives, with vital biological activities and tight ties to cytochrome P450 (Chandra et al., 2000). In retinol metabolism, the metabolites retinal, retinol, and retinoic acid play key roles in T helper cell differentiation, function, and homing, as well as lymphoid organ development (Beri and Chandra, 1993). Nicotinamide is the major precursor of nicotinamide adenine dinucleotide and increases NAD + biosynthesis in nicotinate and nicotinamide metabolism. SIRT1 (a positive regulator of NF-кB, which is thought to be an important transcriptional factor involved in the production of pro-inflammatory cytokines (Bono et al., 2016) is activated by increased NAD+, which inhibits the NF-кB signaling pathway and suppresses the release of inflammatory factors, resulting in anti-inflammatory effects (Matsushita et al., 2013).
In conclusion, we believe that Scutellaria baicalensis extracts may have anti-inflammatory effects on LPS-induced macrophage inflammatory responses through modulating metabolism, nucleotide metabolism, amino acid metabolism, and cofactor and vitamin metabolism pathways in combination with cytokines. In macrophages, the interactions had anti-inflammatory effects on the LPS-induced inflammatory response. However, more refined and improved research are needed to identify the particular molecular signaling processes behind Scutellaria baicalensis’ anti-inflammatory properties.
Acknowledgments
This research work was supported by the Start-up fund from Northwest Normal University to Xinliang ZHU, Project for Enhancing the Research Capability of Young Teachers in Northwest Normal University to Xinliang ZHU (No. 5007/436) and Project for promoting the innovative capability of college and university from Gansu Province Education Department Xinliang ZHU (No. 2060), The Natural Science Foundation of Gansu Province in China (21JR7RA113).
Declaration of Competing Interest
The authors declare that they have no known competing financial interests or personal relationships that could have appeared to influence the work reported in this paper.
References
- Regulation of drug-metabolizing enzymes and transporters in inflammation. Annu. Rev. Pharmacol. Toxicol.. 2006;46:123-149.
- [Google Scholar]
- Author 1, A.B. (University, City, State, Country); Author 2, C. (Institute, City, State, Country). Personal communication, 2012.
- Chemistry and biology of heme. effect of metal salts, organometals, and metalloporphyrins on heme synthesis and catabolism, with special reference to clinical implications and interactions with cytochrome P-450. Drug Metab. Rev.. 1993;25(1–2):49-152.
- [Google Scholar]
- Expression of the vascular permeability factor/vascular endothelial growth factor gene in central nervous system neoplasms. J. Clin. Invest.. 1993;91(1):153-159.
- [Google Scholar]
- Omega-3 fatty acids and inflammatory processes: from molecules to man. Biochem. Soc. Trans.. 2017;45(5):1105-1115.
- [Google Scholar]
- Metalloporphyrins-applications and clinical significance. Indian J. Clin. Biochem. : IJCB. 2000;15(Suppl 1):183-199.
- [Google Scholar]
- [Inhibitory effect of Scutellariae Radix on hepatic fibrosis based on urinary metabonomic] Zhongguo Zhong yao za zhi = Zhongguo zhongyao zazhi = China J. Chinese Mater. Med.. 2018;43(10):2140-2146.
- [Google Scholar]
- Integrated serum metabolomics and network pharmacology approach to reveal the potential mechanisms of withanolides from the leaves of Datura metel L. on psoriasis. J. Pharm. Biomed. Anal.. 2020;186:113277
- [Google Scholar]
- P. Christmas, Chapter Six - Role of Cytochrome P450s in Inflammation, in: J.P. Hardwick (Ed.), Advances in Pharmacology, Academic Press2015, pp. 163-192.
- Functional role played by the glycosylphosphatidylinositol anchor glycan of CD48 in interleukin-18-induced interferon-gamma production. J. Biol. Chem.. 2005;280(18):18056-18062.
- [Google Scholar]
- Complex links between dietary lipids, endogenous endotoxins and metabolic inflammation. Biochimie. 2011;93(1):39-45.
- [Google Scholar]
- Baicalin alleviates deoxynivalenol-induced intestinal inflammation and oxidative stress damage by inhibiting NF-κB and increasing mTOR signaling pathways in piglets. Food Chem. Toxicol.. 2020;140:111326
- [Google Scholar]
- The main bioactive compounds of Scutellaria baicalensis Georgi. for alleviation of inflammatory cytokines: a comprehensive review. Biomed. Pharmacother.. 2021;133:110917
- [Google Scholar]
- Linoleate appears to protect against palmitate-induced inflammation in Huh7 cells. Lipids Health Dis.. 2014;13(1):78.
- [Google Scholar]
- The overexpression of SIRT1 inhibited osteoarthritic gene expression changes induced by interleukin-1β in human chondrocytes. J. Orthop. Res.. 2013;31(4):531-537.
- [Google Scholar]
- A targeted strategy to analyze untargeted mass spectral data: rapid chemical profiling of Scutellaria baicalensis using ultra-high performance liquid chromatography coupled with hybrid quadrupole orbitrap mass spectrometry and key ion filtering. J. Chromatogr. A. 2016;1441:83-95.
- [Google Scholar]
- Metabolism via arginase or nitric oxide synthase: two competing arginine pathways in macrophages. Front. Immunol.. 2014;5:532.
- [Google Scholar]
- J.C. Rodríguez-Prados, P.G. Través, J. Cuenca, D. Rico, J. Aragonés, P. Martín-Sanz, M. Cascante, L. Boscá, Substrate fate in activated macrophages: a comparison between innate, classic, and alternative activation, Journal of immunology (Baltimore, Md. : 1950) 185(1) (2010) 605-14.
- D. Sag, D. Carling, R.D. Stout, J. Suttles, Adenosine 5'-monophosphate-activated protein kinase promotes macrophage polarization to an anti-inflammatory functional phenotype, Journal of immunology (Baltimore, Md. : 1950) 181(12) (2008) 8633-41.
- The cytochrome P450 epoxygenase pathway regulates the hepatic inflammatory response in fatty liver disease. PLoS One. 2014;9(10):e110162-e.
- [Google Scholar]
- Tryptophan Metabolism in Inflammaging: From Biomarker to Therapeutic Target. Front. Immunol.. 2019;10(2565)
- [Google Scholar]
- Vitamins B2 and B6 as determinants of kynurenines and related markers of interferon-γ-mediated immune activation in the community-based Hordaland Health Study. Br. J. Nutr.. 2014;112(7):1065-1072.
- [Google Scholar]
- Purine enzymes in patients with rheumatoid arthritis treated with methotrexate. Ann. Rheum. Dis.. 2002;61(12):1060-1064.
- [Google Scholar]
- Metabolomics coupled with pathway analysis characterizes metabolic changes in response to BDE-3 induced reproductive toxicity in mice. Sci. Rep.. 2018;8(1):5423.
- [Google Scholar]
- Integrated cytokine and metabolite analysis reveals immunometabolic reprogramming in COVID-19 patients with therapeutic implications. Nat. Commun.. 2021;12(1):1618.
- [Google Scholar]
- Lipopolysaccharide/adenosine triphosphate induces IL-1β and IL-18 secretion through the NLRP3 inflammasome in RAW264.7 murine macrophage cells. Int. J. Mol. Med.. 2014;34(1):341-349.
- [Google Scholar]
- Phosphorylation-mediated IFN-γR2 membrane translocation is required to activate macrophage innate response. Cell. 2018;175(5):1336-1351.e17.
- [Google Scholar]
- Baicalein attenuates the neuroinflammation in LPS-activated BV-2 microglial cells through suppression of pro-inflammatory cytokines, COX2/NF-κB expressions and regulation of metabolic abnormality. Int. Immunopharmacol.. 2020;79:106092
- [Google Scholar]
- Anti-inflammatory effects of Scutellaria baicalensis water extract on LPS-activated RAW 264.7 macrophages. J. Ethnopharmacol.. 2009;125(2):286-290.
- [Google Scholar]
- Molecular mechanisms of NF-kappaB activation induced by bacterial lipopolysaccharide through Toll-like receptors. J. Endotoxin Res.. 2000;6(6):453-457.
- [Google Scholar]


