

Translate this page into:
Antioxidant capacity and sensory quality of soy-based powder drink mix enriched with functional hydrolysates of swiftlet (Aerodramus fuciphagus)
⁎Corresponding authors. zalifah.kasim@ukm.edu.my (Zalifah Mohd Kasim), saiful-z@ukm.edu.my (Saiful Irwan Zubairi)
-
Received: ,
Accepted: ,
This article was originally published by Elsevier and was migrated to Scientific Scholar after the change of Publisher.
Peer review under responsibility of King Saud University.
Abstract
The enrichment with low amount of bioactive protein of spray-dried edible bird’s nest hydrolysates (EBNH) (3.0 %) in view of its cost and high solubility provided significant value added to the overall in vitro antioxidant capacity of soy-based powder drink mix (PDM). Its beverage (12.5 % concentration, consistency index 0.39 Pa.sn) antioxidant capacity as measured by ABTS and FRAP was comparable (p > 0.05) but significantly higher than antioxidant assays of FCR and DPPH. The respective antioxidant capacity of the PDM beverage in terms of trolox equivalent (TE) and gallic acid equivalent (GAE) were 21.95 TE mg/g, 20.75 TE mg/g, 2.93 TE mg/g and 14.72 GAE mg/g for FRAP, ABTS, DPPH and FCR. Depending on antioxidant assay, EBNH in beverage of PDM contributed an increase in the range of 3.7–9.3 % (which was significant (p < 0.05) according to ABTS and FCR assays) or about 6.0 % to its overall antioxidant capacity. The interaction among the antioxidant activity of all the food product’s ingredients is antagonistic since the difference between the expected and observed total antioxidant potential is significantly higher (p < 0.05) for all antioxidants assays, except FCR. The beverage of PDM has excellent sensory quality. It is sugar free and high protein PDM that has excellent cocoa flavour and possesses sufficient sweetness with acceptable beany aroma and taste when served as hot beverage.
Keywords
Swiftlet
Hydrolysates
Powder drink mix
Sensory quality
Antioxidant capacity

1 Introduction
The swiftlet industry which mainly produces edible bird’s nest (EBN) is one of the major contributors to Malaysia’s gross national income. Malaysia is the second largest supplier of raw edible bird’s nest (REBN) after Indonesia (Dai et al., 2020). The global demand of REBN continues to grow steadily. Certainly, efforts through the conversion of REBN into value-added products will make the swiftlet industry more profitable. Since the outbreak of COVID-19 at the end of 2019 the demand for Malaysian REBN by China has increased remarkably (Malaysian National News Agency, 2020). The market value of REBN ranges from USD 2000 to USD 10,000 per kilogram depending on its grade, type and origin (Fan et al., 2022; Lee et al., 2021). White REBN is the nest that is produced by swiftlet Aerodramus fuciphagus. It is a great food delicacy. Conventionally, REBN is double boiled with rock sugar into soup as prepared traditionally by Chinese medicinal practitioners almost has no flavour (Lee et al., 2021).
The REBN is widely used as healthy food due to its high nutritional values and numerous therapeutic benefits that include anti-viral effects (Chua et al., 2021). REBN contains mainly glycoproteins, a complex structure of protein and carbohydrates where the glycans are rich in sialic acid (Norhayati et al., 2010). The carbohydrate component of REBN which is glycosidically linked to form N-acetylgalactoamine, releases as free N-acetylneuraminic acid upon enzymatic hydrolysis (Wong et al., 2018). The two main functional components in REBN found by many researchers are sialic acid and antioxidants (Babji et al., 2018; Ma and Liu, 2012). However, REBN was reported to have inferior functional effects in term of antioxidant activity and promote lower absorption rate as compared to EBNH (Babji et al., 2018; Khushairay et al., 2014). As animal glycoprotein, both REBN and EBNH contain sialic acid unlike almost all plant food sources which have no detectable amount of sialic acid or N-acetylneuraminic acid content (Zeleny et al., 2006). Ling et al. (2020) shows that hydrolysates from EBN of Malaysia contains high amount of sialic acid, specifically N-acetylneuraminic acid. The importance of sialic acid in human nutrition is well known (Ghosh, 2020). The EBNH also have a complete protein content to maintain a good balance of essential amino acids that we need. The total amount of amino acid in EBNH is significantly higher than REBN (Ng et al., 2020). The EBNH also have high soluble protein compared to unhydrolyzed REBN (Khushairay et al., 2014). Soluble protein is an important characteristic to consider in selecting proteins for use in liquid foods and beverages (Fellow, 2017). Few studies indicate nutritional values, soluble protein, sialic acid content and antioxidant activity of spray-dried EBNH are comparable or higher than that of freeze-dried EBNH (Gan et al., 2020).
The REBN powder is physiochemically inferior compared to EBNH derived from enzymatic hydrolysis. The latter transforms REBN glycoprotein into bioactive glycopeptides, making them soluble and leaving behind other insoluble impurities, regardless of the REBN grade (Ng et al., 2020). Cleaned REBN gives about 89 % recovery of hydrolysates (Ling et al., 2020). Taking advantage of its solubility, EBNH has been solely encapsulated (each capsule about 0.62 cm3 containing 0.15 g) to be marketed as a safe, nutritious and convenient alternative of non-synthetic bioactive glycopeptides source (Babji et al., 2015; Babji, 2017). The encapsulated EBNH can be taken directly as an alternative to consuming REBN soup which has tedious preparation method.
It is expected that a formulated plant based food product that is fortified with EBNH gives complementary effect to the quality of the finished product. This is beneficial from the standpoint of exploiting its therapeutic effects to benefit human health. A large variety of EBN related products have emerged in the market. The development of downstream products from bio-technically processed REBN by entrepreneurs have produced many value-added and innovative products, but merely as conventional raw product of EBN such as drink, food supplement, additive or extract added in food and cosmetic. The use of EBN should be optimized in the form of its hydrolysates. The EBNH has a good potential in enhancing the combined health benefits when it is incorporated as an ingredient in both food and non-food products. However, exploiting EBNH to be as a component that can contribute a significant value added ingredient in food product development is still limited. To date, no known study is reported in published literature to indicate EBNH fortification gives value added to food product. As revealed by Daud et al. (2019) some research efforts to use EBNH as an ingredient in foods such as chicken patties, confectionery (chocolate and ice cream), ready-to-drink beverages of roselle (Hibiscus sabdariffa) and aloe vera (A. vera) have been attempted but not reported.
The reported research on the development of food product comprising of bioactive compound in a mixture of soybean and cocoa powders which can be conveniently consumed as ready-to-eat (RTE) healthy powder drink mix (PDM) is still scarce. Obviously, for such food powder product to be successfully formulated it should compose of functional food ingredients and provide maximum other quality appeal to consumers. Tasty flavour, nice aroma and hygienically safe are among the deciding factors of any functional drink (Zubairi et al., 2023). Consumption of soy-based foods is increasing worldwide due to the acclaimed health benefits as evidenced from numerous scientific studies (Chatterjee et al., 2018; Lokuruka, 2010). Specifically, the acceptance of soy-based foods has increased due to the demand for alternatives to dairy products by consumers which face problem of intolerance and allergy to lactose, apart as desire for vegetarian alternatives (Granato et al., 2010). It is also to get away from long-term consumption of red meat protein for fear of getting chronic diseases (Herzler et al., 2020). In addition, food manufacturers may also have contributed to this effect because of their brilliant creativity in continuously developing new lines of soy-based products. The latter do not only contain enough soy to meet the claim requirement but also are developed specifically to taste good in view of consumers reluctant to try soy-based foods because they fear a bad taste. Cocoa on the other hand, apart from being mostly valued for its flavour worldwide, it is also admired for its health benefits contribution and possesses excellent potential as functional food (Aprotosoaie et al., 2016). In view of the beneficial functional role of EBN as discussed above, the objective of this study is to formulate a plant-based sugar free cocoa-flavoured PDM containing soybean powder fortified with functional EBNH to evaluate its in vitro antioxidant capacity and sensory quality. Specifically, the main interest with respect to EBNH is to evaluate whether its low dose enrichment in PDM gives significant value-added impact to the overall antioxidant capacity of the product.
2 Materials and methods
2.1 EBN hydrolysates preparation
Spray-dried EBNH was used as an ingredient of the product, in view of its low processing cost compared to freeze-dried EBNH. In addition, few studies indicate nutritional values, soluble protein, sialic acid content and antioxidant activity of spray-dried EBNH are comparable or higher than that of freeze-dried EBNH (Gan et al., 2020). Moulded REBN of Aerodramus fuciphagus which is still considered as Grade A due to its cleanliness was purchased from Mobile Harvester (M) Sdn. Bhd., Shah Alam, Selangor, Malaysia. The EBN was then grounded into powder by using a stainless-steel Waring blender before it was soaked in distilled water at 4 °C (1: 100 w/v) for 16 h. The samples were then placed in the water bath and heated to 100 °C to undergo the process of double boiling for 30 min. Subsequently, the sample was allowed to cool down by using ice cubes and then incubated at 60 °C for 1 h with alcalase enzyme (1:100 w/v, pH 8.0) of Bacillus licheniformis (Novozyme Corps, Denmark). The enzymatic hydrolysis was then terminated by boiling the solution of the hydrolyzed sample at 100 °C for 5 min. The solution was cooled and the hydrolysates were separated from the solution by filtering and then spray-dried instead of freeze-dried as based on patented parameters (patent no.: WO2017034390A3) by Babji (2017) from Universiti Kebangsaan Malaysia. The spray-drying process involved using a spray dryer (L-115, Agridon Manufacturers Sdn. Bhd., Malaysia) that has an inlet chamber and output air temperature of 180 ± 1 °C and 90 ± 1 °C, respectively, while maintaining a flow rate of 100 mL/h using a peristaltic pump (Ravel Hiteks, Chennai).
2.2 Product formulation optimization
The multivariate statistic technique (central composite design) from Design Expert Software (version 12) of Stat Ease Inc. was utilized in experimental design and analysis of formulations optimization for the product. Central composite design is a factorial design that develops second order polynomial models for the responses in response surface methodology (RSM) (Montgomery, 2017). Response surface models representing the relationship between the independent variables and responses were utilized to optimize formulations of the product.
2.2.1 Independent variables
The experiment involved careful preparation of twenty formulations of ingredients powder in various combinations containing soybean powder, cocoa powder, EBNH, silicon dioxide, xanthan gum and sucralose, mixed in 40 mL 90 °C hot water. Cocoa powder, xanthan gum and silicon dioxide were assigned as three quantitative controllable factors (independent variables) in the levels of 15–35 %, 0.3–0.8 % and 0.5–1.0 %, respectively (Table 1). The amount of EBNH and sucralose were fixed at 3.0 % (0.15 g) and 0.06 %, respectively. Soybean powder as the main ingredient make up the remaining weight of each formulation (5.0 g). The amount of EBNH that was added as ingredient was equivalent to its weight in capsules (0.15 g each) that was developed by Babji et al. (2015), which can be taken daily as a source of bioactive compound. Considering the solubility and cost of EBNH, it is considered adequate and is expected to impose significant impact of its functional activity. Assuming consuming 240 mL per serving of soy-based beverage (USFDA, 2018), the drink of the product (12.5 % concentration containing 1.8 mg/mL protein) provides 0.9 g EBNH. With respect to ACE inhibitory activity, references indicated effective inhibition (IC50) by EBNH corresponds to only 0.02 mg protein/mL (Nurfatin et al., 2016), whereas Daud et al. (2019) reported 0.514 mg glycopeptides/mL. * Powder drink mix served as hot beverage 5.0 g in 40 mL 90 °C hot water.
Formulation* (Runs)
Factors
Responses
Cocoa powder (%)
Xanthan gum (%)
Silicon dioxide (%)
Water Activity (Aw)
Consistency index (Pa.sn)
Flow behavior index (n)
Degree of caking (%)
1
35
0.3
1
0.456
0.2124
0.346
26.4
2
25
0.13
0.75
0.445
0.0481
0.6859
41
3
25
0.97
0.75
0.456
0.3972
0.4444
27.2
4
35
0.8
1
0.457
0.5118
0.4192
20.6
5
35
0.3
0.5
0.433
0.1114
0.5167
62
6
25
0.55
0.75
0.44
0.3328
0.3967
35.4
7
35
0.8
0.5
0.451
0.5423
0.4035
19.4
8
25
0.55
1.17
0.44
0.2446
0.4402
69.4
9
25
0.55
0.75
0.432
0.2181
0.4466
48.2
10
25
0.55
0.75
0.44
0.2228
0.4875
56.2
11
15
0.8
1
0.435
0.3675
0.4852
59.8
12
15
0.3
1
0.443
0.1233
0.5594
52.8
13
25
0.55
0.75
0.442
0.405
0.3226
48.4
14
25
0.55
0.75
0.429
0.2067
0.5037
64
15
15
0.3
0.5
0.443
0.0835
0.6234
55.4
16
25
0.55
0.75
0.438
0.2704
0.4542
63
17
15
0.8
0.5
0.436
0.4535
0.4206
62
18
8.18
0.55
0.75
0.439
0.295
0.4691
79.2
19
25
0.55
0.33
0.433
0.2349
0.4468
60.8
20
41.82
0.55
0.75
0.465
0.6035
0.3052
38.4
2.2.2 Dependent variables
Water activity, degree of caking and rheological parameters (flow behaviour and consistency index) which accounted for the behaviour of the product formulations in their non-liquid and liquid states were set as four dependent variables or responses. A hedonic test (performed by 30 subjects) on cocoa flavour for the product formulations containing 15–35 % cocoa powder (5.0 g in 40 mL 90 °C hot water) was conducted since cocoa flavour is not easily measurable instrumentally to assign as a response. The tasters considered a formulation with 25 % cocoa powder provided an adequate cocoa flavour, which was used as a criterion to aid in optimizing the formulation of the product. To estimate caking formation, 5.0 g of each formulation was placed in air-tight plastic container (120 mL) and incubated at room temperature for two months. Subsequently, each formulation was carefully sieved to remove its non-caking portion (using USA standard testing sieve No. 25). What was sieved out was weighed and expressed as degree of caking (%) by weight (Zafar et al., 2017).
The water activity of each formulation was measured with Resistive Electrolytic Hygrometer (Novasina, Switzerland). The rheology for each formulation of the product (5.0 g in 40 mL 90 °C hot water) was measured at room temperature by using rheometer (model Physics MCR 301, brand Anton Paar, Germany). The rheological parameters of flow behaviour index (n) and consistency index (K) were calculated based on the logarithmic relationship between shear stress (η) and shear rate (γ) according to the flow curve of the power-law model: η = Kγ(n-1) (Björn et al., 2012).
2.2.3 Model fitting
The experimental data were fitted to develop the relevant models containing terms according to an empirical second-order polynomial equation written as: Y = βo + Ʃβi Xi + Ʃβii Xi2 + Ʃβij XiXj, where Y is the response variable (Ramlan et al., 2022; Mohd Azzimi et al., 2018). The βo is the constant coefficient, βi, βii and βij are the linear, quadratic and interaction regression variables coefficient, respectively, while Xi and Xij are input independent variable factors. For the analysis of variance (ANOVA), the statistical significance of each overall model, its coefficients of terms in the model and as well as lack of fit (error) were accepted as significantly different at 95 % level (p < 0.05).
2.3 Product sensory quality
Sensory evaluation of the formulated PDM was conducted upon receiving the ethical approval (Ethics approval number: UKM PPI/111/8/JEP-2019–741) from Universiti Kebangsaan Malaysia Medical Centre, Kuala Lumpur, Malaysia. An in-house acceptance test was performed using a 7-point hedonic scale which is represented by a line, anchored at its ends with the minimum and maximum degrees of acceptance for each sensory attribute (1 = dislike very much and 7 = like very much, respectively). Since the hedonic test is to be complemented by quantitative descriptive analysis (QDA), only 30 subjects were selected as panelists to evaluate four sensory properties (appearance, aroma, taste, texture and overall acceptability) of formulations comparing with a commercial powdered mix (CPM). The latter is a nutritious powder mix product of soy protein drink from Italy. It is a soy-based chocolate-flavoured powdered drink mix formulation without additive of EBN related substances but containing other numerous ingredients (milk protein, sucralose, xanthan gum and silicon dioxide). Each formulation was served as hot drink (5.0 g of each product mixed in 40 mL 90 °C hot water). CPM was prepared in the dilution of 5.0 g per 48 mL 90 °C hot water instead of milk as suggested. Samples were coded using three-digit random numbers. QDA (Stone and Sidel, 1985) was conducted to appropriately evaluate the sensory properties of PDM. Ten panelists were given training and focus group discussion was conducted to develop the sensory profile of the products and ultimately decide with consensus on the appropriate terminology of sensory attributes to be used in QDA (Fadzilah et al., 2022). The samples of the products that were served as hot drink were coded using three random numbers. The panelists used graphic line (15 cm) scales to give score rating on the sensory attributes. They evaluated 12 sensory attributes in term of appearance (brown colour, clumpiness, thickness, suspension, and sliminess), aroma (cocoa and beany), taste (creaminess, sweetness, bitterness, beany and aftertaste) by giving score rating. The CPM that was used in the hedonic acceptance test was included as reference sample. The scores of each sensory attribute were converted to numerical measurements (in the range of 0–15) and statistically analyzed.
2.4 Product antioxidant capacity
The measurement of PDM’s in vitro antioxidant capacity was done on its water extract (a concentration of 125 mg/mL). The latter was prepared by using solid-to-liquid ratio of 1:8 (5 g in 40 mL 90 °C hot water) as adopted in the sensory evaluation of the food product. Solution for all ingredients were also prepared separately in 40 mL 90 °C hot water where the amount of each ingredient used corresponded to its quantity that make up the 5 g weight of PDM. All solutions were vigorously stirred for 5 min and then let to cool down for a period of 30 min before they were centrifuged and filtered. Antioxidant capacity measurement was done on the filtrate of all samples that were diluted in the concentration of 1 mg/mL, except for xanthan gum and sucralose, 0.625 mg/mL and 0.075 mg/mL, respectively. Four antioxidant assays were used, namely radical scavenging assays of 1, 1-diphenyl-2-piccryl hydrazyl (DPPH) based on Yang et al. (2009), 2,2-azino-bis-3-ethylbenzthiazoline-6-sulphonic acid (ABTS) as proposed by Wiriyaphan et al. (2012), ferric reducing power (FRAP) as described by Benzie and Strain (1996), and Folin-Ciocalteu reagent (FCR) as proposed by Everette et al. (2010). Trolox (6-hydroxy-2,5,7,8-tetramethylchroman-2-carboxylic acid) and gallic acid were used as standards. The antioxidant activity was expressed as trolox equivalents of product sample weight of (TE mg/g) for DPPH, FRAP and ABTS, whereas gallic acid equivalents (GAE mg /g) for FCR. All the required chemicals for the assays were purchased form Sigma Chemical Co. (St. Louis, MO, USA).
2.5 Statistical analysis
ANOVA and t-test on other relevant data of experiments were conducted to verify significant differences among means (p < 0.05) using IBM SPSS Statistics software version 22.
3 Result and discussion
3.1 Product formulation optimization
The conducted analysis of variance on the relationship between independent variables (cocoa powder, silicon dioxide and xanthan gum) and responses (water activity, rheological behaviour and degree of caking) obtained significant quadratic models (p < 0.05) where their lack of fit was insignificant (p > 0.05). Table 2 shows the coefficients and their associated probability of the all the reliable model terms that could be included in the models (Equations 1 to 4), together with their achievable coefficient of determination (adjusted R2 values). The latter indicates the percentage of variation explained by the independent variables that actually affect each dependent variable. Overall, the models were considered good for predicting outcome of responses. Fig. 1, shows the geometrical representation of the independent variables plotted as a function of responses (water activity, degree of caking, consistency index and flow behaviour index). A = cocoa powder, B = xanthan gum, C = silicon dioxide.
Responses
Model terms coefficients
Adjusted R2
Intercept
A
B
C
AB
AC
A2
B2
Equation 1
Water activity (Aw)
0.4364
0.0061
0.0016
0.0029
0.0043
0.0038
0.0049
0.0043
0.74
p-values
0.0006
0.2403
0.0495
0.0312
0.0524
0.0027
0.0057
Equation 2
Degree of caking (%)
55.2706
−12.4639
−4.2476
–
−7.75
–
–
−8.4802
0.64
p-values
0.0004
0.1461
0.0491
0.0063
Equation 3
Consistency index (Pa.sn)
0.2517
0.0641
0.1428
–
–
–
–
–
0.81
p-values
0.0029
<0.0001
Equation 4
Flow behavior index
0.4258
−0.0499
−0.0544
–
–
–
0.0638
0.0467
0.58
p-values
0.0071
0.0040
0.0023
0.0086
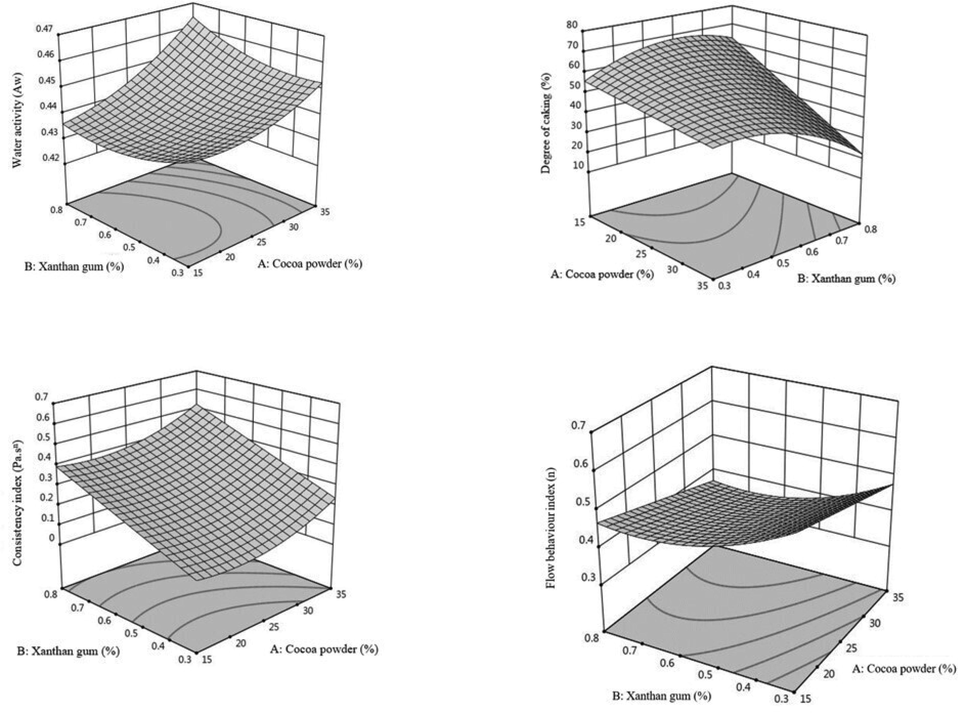
Geometrical representation of the independent variables (cocoa powder and xanthan gum) plotted as a function of responses (water activity, degree of caking, consistency index and flow behaviour index) at an independent variable of silicon dioxide (1%).
By setting the initial criteria of all the relevant parameters of independent variables and responses and subsequently changing them accordingly to achieve maximum desirability of 1 during the process of optimization, three optimum formulations were attained. The obvious differences between formulations are in terms of concentration levels of soybean, cocoa and xanthan gum. Formulation 1 (F1) is composed of 25 % cocoa powder, 0.5 % xanthan gum, and 70.44 % soybean powder. Formulation 2 (F2) has 20 % the cocoa powder, 0.5 % xanthan gum and 75.44 % soybean powder, whereas Formulation 3 (F3) has 25 % cocoa powder, 0.3 % xanthan gum and 70.64 % soybean powder. The consistency index of F1, F2 and F3 were about 0.223, 0.207 and 0.110 Pa.sn, respectively.
3.2 Product sensory quality
The mean scores rating of the hedonic test for the four sensory properties (appearance, aroma, taste and texture) were all above the value of 4.0, stipulating not a single sensory attribute of all the product formulations was disliked by the panelists (except CPM, for the properties of appearance and texture). Only appearance and texture sensory attributes showed significant differences between product formulations (p < 0.05). The panelists most likely perceived appearance and texture as the two most obvious sensory attributes that clearly differentiated F1, F2 and F3 from CPM, resulting all formulations of the developed product received higher scores rating than CPM. With respect to texture, F1, F2 and F3 were considered dispersible in hot water (90 °C) and free-flowing, unlike CPM which was more viscous. Average across formulations of the product, the mean scores rating for sensory attributes of appearance, aroma, taste and texture were 5.38, 4.79, 4.40 and 4.99, respectively. The panelists’ differences in ratings for overall acceptability (mean score 4.34) of product formulations were not significant (p > 0.05). Their ranking preference was in the order of F2 > F1 > F3 > CPM.
The QDA that was conducted complement the hedonic test. The differences in sensory quality of all properties between the product formulations were significant (p < 0.05), except for brown colour, beany aroma, sweetness, aftertaste and suspension. The CPM received the lowest score rating for clumpiness, bitterness, cocoa aroma and beany taste (mean scores of 2.92, 1.79, 2.34 and 4.97, respectively), but obtained the highest score ratings for thickness, creaminess and sliminess (mean scores 10.65, 5.79 and 9.92, respectively. Taking F1, F2 and F3 into consideration, the panelists perceived all the formulations had comparable quality of clumpiness (mean score range 6.43–8.23), beany taste (mean score range 6.31–7.16), creaminess (mean score range 2.71–3.00), thickness (mean score range 2.18–3.29) and sliminess (mean score range 2.65–2.95). For the quality that is related to cocoa flavour, the differences of cocoa aroma for F1 (mean score 6.10), F2 (mean score 3.80) and F3 (mean score 4.67) were not significant (p > 0.05). The panelists rated F2 be the least bitter formulation with respect to cocoa taste, where they ranked bitterness in the order of F3 (mean score 5.50) > F1 (mean score 5.27) > F2 (mean score 3.85), although the differences in the score ratings were not significant (p > 0.05). The differences in score ratings for overall acceptability between F1 (mean score 10.97) > F2 (mean score 10.50) > F3 (mean score 8.86) were not significant (p > 0.05). The CPM (mean score 4.43) was the least preferred formulation. Fig. 2 depicted the variability in the observations of score rating for the designated sensory properties in the QDA of the food products. The beverage of PDM was perceived as being easier to swallow due to its liquid texture. Food texture is positively related to consistency index which influences swallowing (Wendin et al., 2020). Probably, differences in chemical properties may also influence sensory evaluation. Proximate analysis by the methods of (AOAC, 1990) indicates F1 and F2 have comparable crude fat content (p > 0.05). However, F2 has significantly lower content of ash (p < 0.05) and crude carbohydrate (p < 0.05), but significantly higher content of crude protein (p < 0.05) as compared to F1. The crude protein, crude carbohydrate and crude fat content of F2 was about 34.7 %, 48.0 % and 3.8 %, respectively.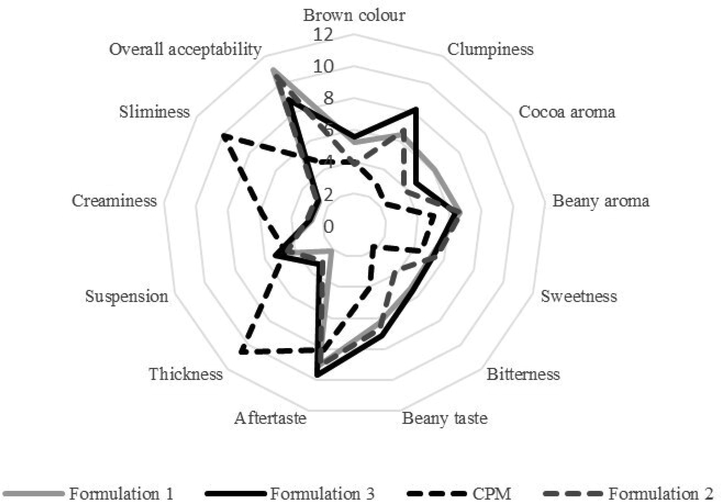
Spider chart displaying the range of scores for the sensory attributes as perceived by quantitative descriptive analysis (the relative intensity of each attribute increases as it moves farther away from the centre).
3.3 Product antioxidant capacity
The water extracts of PDM (F2) as well as its ingredients are shown to be antioxidative as measured by the four antioxidant assays. Table 3 indicates only three antioxidant assays (ABTS, FRAP and FCR) were capable in portraying the antioxidative potential of all the food product’s ingredients. The linear correlation between antioxidant assays is significant (ABTS versus FRAP: R2 = 0.99, p < 0.05; ABTS versus FCR: R2 = 0.90, p < 0.05; and FRAP versus FCR: R2 = 0.89, p < 0.05). The differences of antioxidant capacity between antioxidant assays are significant (p < 0.05), where there is no single antioxidant assay excelled in giving high antioxidant capacity for all ingredients. Clearly, this indicates the fact that the achievable antioxidant capacity among others depends on antioxidant assay chemistry apart from physicochemical properties and concentration of antioxidants (Gulcin, 2020). Thus, it was not surprising to see even silicon dioxide as a food additive having certain amount of antioxidant capacity, higher than sucralose. This behaviour of silicon dioxide could be due to its nature as an amorphous silica. Its Si-O bonds are more polar than Si-C bonds, which can exist as silicic acid (SiOH4) in neutral solution. Chemistry involving of Si-O bonds is important in grafting functional molecules that is appropriate for many short-term drug delivery applications (Sailor, 2014). Note: *sum of all the ingredients, # t-test (2 tailed) probability of significance for comparisons. Different letters for means (±standard deviation) for each ingredient or product (A, B, C and D) in each row indicates significant difference between antioxidant assays (p < 0.05). PDM: powder drink mix. EBNH: edible bird’s nest hydrolysates.
Assay Ingredients/Products
FCR (GAE mg /g)
ABTS (TE mg/g)
FRAP (TE mg/g)
DPPH (TE mg/g)
Soybean powder
10.25 ± 0.34b
11.01 ± 0.74b
12.50 ± 0.37a
1.46 ± 0.03c
Cocoa powder
4.90 ± 0.33c
9.55 ± 0.57b
11.14 ± 0.14a
2.09 ± 0.03d
Spray-dried EBNH
0.49 ± 0.08b
0.79 ± 0.15a
0.36 ± 0.02b
0.05 ± 0.01c
Silicon dioxide
0.07 ± 0.009c
0.22 ± 0.02a
0.15 ± 0.03b
0d
Xanthan gum
0.04 ± 0.003b
0.12 ± 0.02a
0.06 ± 0.002b
0c
Sucralose
0.004 ± 0.001c
0.01 ± 0.001a
0.007 ± 7 × 10⁻⁴b
0d
A. PDM fortified with EBNH (expected*)
15.75 ± 0.56c
21.71 ± 0.18b
24.22 ± 0.24a
3.61 ± 0.08d
B. PDM without EBNH (expected*)
15.26 ± 0.61c
20.92 ± 0.22b
23.86 ± 0.22a
3.56 ± 0.07d
C. PDM fortified with EBNH (observed)
14.72 ± 0.29b
20.75 ± 0.30a
21.95 ± 1.18a
2.93 ± 0.19c
D. PDM without EBNH (observed)
13.47 ± 0.13c
19.48 ± 0.33b
21.17 ± 0.27a
2.79 ± 0.17d
Comparison of differences in antioxidant capacity between products #
A versus B
Difference: 3.2 %
Difference: 3.8 %
Difference: 1.5 %
Difference: 1.4 %
p = 0.367
p = 0.008
p = 0.129
p = 0.428
C versus D
Difference: 9.3 %
Difference: 6.5 %
Difference: 3.7 %
Difference: 5.0 %
p = 0.009
p = 0.008
p = 0.326
p = 0.404
A versus C
Difference: 7.0 %
Difference: 4.6 %
Difference: 10.3 %
Difference: 23.2 %
p = 0.066
p = 0.009
p = 0.031
p = 0.005
B versus D
Difference: 13.2 %
Difference: 7.4 %
Difference: 12.7 %
Difference: 27.6 %
p = 0.032
p = 0.003
p < 0.05
p = 0.002
The antioxidant capacity of water extract of soybean powder, cocoa powder and all MCS products as measured by FRAP was significantly higher than the rest of antioxidant assays (p < 0.05), probably due to its specificity of reaction with phenolic and flavonoid compounds. Bolanho and Beléia (2011) observed the higher antioxidant capacity of several soy products was correlated with total phenolic and flavonoid compounds, where the significant differences of antioxidant capacity (p < 0.05) as estimated by 3 assays were tend to be in the order of FRAP > ABTS > DPPH. They postulated the superior performance of FRAP to be due to the ability of flavonoids to chelate metal apart from behaving as scavenging free radicals. According to Kostyuk et al. (2004) metals (Fe and Cu) that catalyse the peroxidation reactions can be chelated by flavonoids.
The method of antioxidant assays varies primarily in term of mechanisms, based either on single electron transfer (SET) or hydrogen atom transfer (HAT) to quench free radicals (Bibi Sadeer et al., 2020). ABTS involves both HAT and SET reaction mechanisms. Unlike ABTS, the antioxidant assays of DPPH, FRAP and FCR are based on SET that reduces any compound, including metals, carbonyls and radicals. The reaction mechanism of FCR is normally described as an antioxidant capacity method that involves single electron transfer preferably from hydroxyl group of substrates (Santos-Sánchez et al., 2019). Besides phenols, FCR has been reported to react with other antioxidants, such as proteins, amino acids, carbohydrates, nucleotides, thiols, unsaturated fatty acids, vitamins, amines, aldehydes and ketones. Everette et al. (2010) through his thorough study of reactivity of various compound classes toward FCR came in agreement with other investigators in suggesting that FCR should be seen as a measure of total antioxidant capacity rather than phenolic content alone.
Results in Table 3 indicated the antioxidant capacity of all food additives by ABTS was significantly higher than other antioxidant assays (p < 0.05), indicating the chemical properties of the compounds are accommodative to both HAT and SET reaction mechanisms. Regarding EBNH, its antioxidant capacity as measured by ABTS (0.79 ± 0.15 TE mg/g) is significantly higher than the rest of antioxidant assays (p < 0.05). Probably, this might be due to the combined effect of SET and HAT reaction mechanisms of ABTS with the radical-scavenging capability of EBNH peptides having various chain length and amino acids composition. It is not possible to be bias due to antioxidants of EBNH forming adducts with ABTS radicals as suggested by Ilyasov et al. (2020) since such reaction occurs specifically for antioxidants of phenolic compounds which are most abundant in plants. Ghassem et al. (2017) observed ABTS radical-scavenging activity is the highest and comparable to FRAP but significantly higher than DPPH. They postulated EBNH has high ability as hydrogen donor to produce non-radical species.
The antioxidant capacity of PDM beverage (12.5 % concentration, consistency index 0.39 ± 0.09 Pa.sn) as measured by antioxidant assays of ABTS and FRAP was comparable (p > 0.05) but significantly higher than FCR and DPPH (p < 0.05). The observed antioxidant capacity of the EBNH enriched PDM in terms of trolox equivalent (TE) and gallic acid equivalent (GAE) are 21.95 ± 1.18 TE mg/g, 20.75 ± 0.30 TE mg/g, 14.72 ± 0.29 GAE mg/g and 2.93 ± 0.19 TE mg/g for FRAP, ABTS, FCR and DPPH, respectively. On the contrary, for the beverage of PDM devoid of EBNH, the observed antioxidant capacity for FRAP, ABTS, FCR and DPPH are 21.17 ± 0.27 TE mg/g, 19.48 ± 0.33 TE mg/g, 13.47 ± 0.13 GAE mg/g and 2.79 ± 0.17 TE mg/g, respectively. Depending on antioxidant assay, EBNH in PDM beverage contributed an increase in the range of 3.7–9.3 % or about 6.0 % (average of four antioxidant assays) to its overall antioxidant capacity. In the case of FCR and ABTS, the difference in the observed antioxidant capacity between those beverage of PDM that is enriched and devoid of EBNH is significant (p < 0.05), an increase of about 9.3 % and 6.5 %, respectively.
Mixture of bioactive compounds have greater bioactivity than a single compound because a mixture has the ability to affect multiple targets and also the activity of one antioxidant is dependent on the other (Sonam and Guleria, 2017). The interactions among different antioxidant components can be synergistic (the effect of two components is much greater the sum of the effects of each compound given alone), antagonistic (opposite of synergism) or additive. The latter is the interaction where the combined effect of two or more components is equal to the sum of the effect of each compound given alone. To get the expected health benefit, it is preferred that the changes in total antioxidant capacity resulting from the interactions among the food components to be of additive or synergistic effects. Several research evidence from literature on in vitro tests of food antioxidant mixtures indicated that the antioxidant properties are not always the additive value of individual mixture components or produce maximum synergistic effect. Synergistic interaction is very sensitive and depends on the types of different compounds in the combination and also on their proportions. A particular combination may show synergistic behaviour at one combination ratio while antagonistic at the other. Table 3 indicates that interaction among the antioxidant activity of all the PDM’s ingredients that is fortified with EBNH is antagonistic since the difference between the expected and observed total antioxidant potential is significantly higher (p < 0.05) for all antioxidants assays, except FCR. In the case of PDM sample that is devoid of EBNH, the interaction among the antioxidant activity of all ingredients is also antagonistic for all antioxidant assays, since the difference of antioxidant activity between expected and observed not significant (p > 0.05). Wang et al. (2011) investigated the synergistic, additive and antagonistic effects of the antioxidant capacity of different food mixture extracts comprising of fruits, vegetables and legumes using in vitro analysis by four antioxidant assays (FCR, FRAP, DPPH and oxygen radical absorbance capacity). The results indicated that within the same food category, 13, 68 and 21 % of the combinations produced synergistic, additive and antagonistic effect respectively.
4 Conclusion
Enriching PDM with EBNH is a way that improvises the availability of bioactive glycopeptides to be consumed deliciously as a ready-to-eat food containing soybean and cocoa powders as the major components. It is much better compared to taking encapsulated hydrolysates (0.15 g per capsule) or raw EBN (low solubility) on a daily basis to acquire the functional effect of natural glycopeptides for the benefit of human health. Raw EBN has to be tediously prepared as soup by double boiling it with sugar because on its own the slimy soft and fishy smell soup almost has no flavor. In the modern twist of preparing REBN, soup has to include other ingredients such as fruits, herbs and coconut milk that convert it to be a sweet high-energy-dense gelatinous texture beverage, served as breakfast or afternoon drink.
Served as hot beverage, the PDM has sufficient sweetness. It has no unpleasant beany smell but instead possesses good aroma together with adequate flavour and bitterness taste of cocoa. The cocoa flavour managed to suppress the beany taste and smell of soybean. The sugar free and high protein food product manifests a respectable functional effect with respect to antioxidant capacity. The enrichment of the food product with low amount of 3.0 % EBNH (in view of its high solubility and cost) that is derived from white EBN originating from swiftlet (Aerodramus fuciphagus) managed to contribute significant value-added to the overall functional impact with respect to in vitro antioxidative potential. The food product is expected to have other functional effects, has low glycemic response and it also can perform as a satiating meal which need to be proven by conducting further studies.
Nowadays, beverages are no longer considered only as a thirst quencher. Consumers look for specific functions in beverages. The functionality in a beverage may be to address different needs and lifestyles, perhaps to increase energy, fight aging, overcome fatigue or stress and avoiding certain diseases. Considering the health benefits that the PDM is able to provide, we are confident that the product can be accepted as a drink that will be highly in demand by adult consumers of all ages, if the quality is maintained. The PDM differs in many aspects compare to those concoction beverages presently available in the market that have EBN as an ingredient (raw and in form still unmodified physically). Almost all of them are in the liquid form of various flavours containing about two to eight major ingredients. It is boosted that the drinks can benefit overall human health but such claim is not supported with scientific evidence.
To meet consumers’ expectation and to be competitive in the market, the PDM needs various appropriate attention from the aspects of production, promotion and packaging strategy (for example, durability of sachets material quality to sustain the expected shelf-life). Quality control is critical during production process which involves formulation and blending of ingredients to achieve a homogeneous mixture product of PDM. The preparation of good quality EBNH at the initial stage of production is a crucial step. It is the key to accomplish success in producing the intended PDM that exhibits an extra functionality coming from the presence of EBNH, added in low amount.
Acknowledgements
The authors would like to thank the Centre for Research and Instrumentation Management, Universiti Kebangsaan Malaysia (CRIM-UKM), for providing financial support through the research project grant GUP-2018-059, ST-2022-016 & ST-2022-021. We would also like to thank the Department of Food Sciences and Innovative Centre for Confectionery Technology (MANIS), Faculty of Science and Technology for providing the research facilities and the Edible Bird’s Nest Research Team of UKM for support and guidance.
Declaration of Competing Interest
The authors declare the following financial interests/personal relationships which may be considered as potential competing interests: Zalifah Mohd Kasim reports financial support, administrative support, article publishing charges, and statistical analysis were provided by National University of Malaysia.
References
- AOAC. 1990. Official Methods of Analysis, 15th ed. Association of Official Analytical Chemists, Virginia
- Flavor chemistry of cocoa and cocoa products-an overview. Compr. Rev. Food Sci. Food Saf.. 2016;15(1):73-91.
- [CrossRef] [Google Scholar]
- Babji, A.S., Etty Syarmila, I.K., Nur ‘Aliah, D., Nurul Nadia, M., Hadi Akbar, D., Norrakiah, A.S., Ghassem, M., Najafian, L., Salma, M.Y., 2018. Assessment on bioactive components of hydrolysed edible bird nest. International Food Research Journal. 25(5), 1936-1941.
- Babji, A.S. 2017. Bioactive swiftlet nest supplement. www.google.com/patents/WO2017034390A3/en (accessed 10 January 2020).
- The ferric reducing ability of plasma (FRAP) as a measure of “antioxidant power”: the FRAP assay. Anal. Biochem.. 1996;239(1):70-76.
- [CrossRef] [Google Scholar]
- The versatility of antioxidant assays in food science and safety- chemistry, applications, strengths, and limitations. Antioxidants. 2020;9(8):709.
- [CrossRef] [Google Scholar]
- Bioactive compounds and antioxidant potential of soy products. Brazilian J. Food Nutr./Alimentos Nutrição. 2011;22(4):539-546.
- [Google Scholar]
- Soybean bioactive peptides and their functional properties. Nutrients. 2018;10(9):1211.
- [CrossRef] [Google Scholar]
- The anti-viral and anti-inflammatory properties of edible bird’s nest in influenza and coronavirus infections: from pre-clinical to potential clinical application. Front. Pharmacol.. 2021;12:633292
- [CrossRef] [Google Scholar]
- A comprehensive review of edible bird's nest. Food Res. Int.. 2020;140:109875
- [CrossRef] [Google Scholar]
- Edible bird’s nest: physicochemical properties, production, and application of bioactive extracts and glycopeptides. Food Rev. Intl.. 2019;37(2):177-196.
- [CrossRef] [Google Scholar]
- Thorough study of reactivity of various compound classes toward the Folin-Ciocalteu reagent. J. Agric. Food Chem.. 2010;58(14):8139-8144.
- [CrossRef] [Google Scholar]
- Physico-chemical and sensory acceptance of carica papaya leaves extract edible O/W emulsion as prospective natural remedies. Arab. J. Chem.. 2022;13(11):7829-7842.
- [CrossRef] [Google Scholar]
- Recent advances in edible bird's nests and edible bird's nest hydrolysates. Food Sci. Technol.. 2022;42:e67422.
- [Google Scholar]
- Food Processing Technology: Principle and Practice (2nd ed.). Cambridge: Woodhead Publishing Limited; 2017.
- Evaluation of physicochemical properties, amino acid profile and bioactivities of edible bird's nest hydrolysate as affected by drying methods. LWT. 2020;131:109777
- [CrossRef] [Google Scholar]
- Identification of two novel antioxidant peptides from edible bird's nest (Aerodramus fuciphagus) protein hydrolysates. Food Funct.. 2017;8(5):2046-2052.
- [CrossRef] [Google Scholar]
- Sialic Acids Sialoglycoconjugates in the Biology of Life. Health and Disease: Academic Press, United Kingdom; 2020.
- Functional foods and nondairy probiotic food development: Trends, concepts, and products. Compr. Rev. Food Sci. Food Saf.. 2010;9(3):292-302.
- [CrossRef] [Google Scholar]
- Antioxidants and antioxidant methods: An updated overview. Arch. Toxicol.. 2020;94(3):651-715.
- [CrossRef] [Google Scholar]
- Plant proteins: assessing their nutritional quality and effects on health and physical function. Nutrients. 2020;12(12):3704.
- [CrossRef] [Google Scholar]
- ABTS/PP decolorization assay of antioxidant capacity reaction pathways. Int. J. Mol. Sci.. 2020;21(3):1131.
- [CrossRef] [Google Scholar]
- Effect of enzymatic hydrolysis of pancreatin and alcalase enzyme on some properties of edible bird’s nest hydrolysate. AIP Conf. Proc.. 2014;1614(1):427-432.
- [CrossRef] [Google Scholar]
- Experimental evidence that flavonoid metal complexes may act as mimics of superoxide dismutase. Arch. Biochem. Biophys.. 2004;428(2):204-208.
- [CrossRef] [Google Scholar]
- Edible bird’s nest: The functional values of the prized animal-based bioproduct from southeast asia- a review. Front. Pharmacol.. 2021;12:626233
- [CrossRef] [Google Scholar]
- Recovery of value-added glycopeptides from edible bird's nest (EBN) co-products: enzymatic hydrolysis, physicochemical characteristics and bioactivity. J. Sci. Food Agric.. 2020;100(13):4714-4722.
- [CrossRef] [Google Scholar]
- Soybean nutritional properties: the good and the bad about soy foods consumption-a review. Afr. J. Food Agric. Nutr. Dev.. 2010;10(4):2439-2459.
- [CrossRef] [Google Scholar]
- Sketch of the edible bird's nest and its important bioactivities. Food Res. Int.. 2012;48(2):559-567.
- [CrossRef] [Google Scholar]
- Malaysian National News Agency (BERNAMA), 2020. RM3 billion export value projection for Malaysian bird's nest. https://www.astroawani.com/berita-malaysia/rm3-billion-export-value-projection-malaysian-birds-nest-251076 (accessed 1 February 2020).
- Response surface optimization on the phenolic content and antioxidant activities of Sabah Snake Grass (Clinacanthus nutans) leaves extract. Int. Food Res. J.. 2018;25(Suppl. 1):S105-S115.
- [Google Scholar]
- Montgomery, D.C., 2017. Design and Analysis of Experiments. John Wiley & Sons, Hoboken.
- Ng, S.R., Noor, H.S.M., Ramachandran, R., Tan, H.Y., Ch’ng, S.E., Chang, L.S., Babji, A.S., Lim, S.J., 2020. Recovery of glycopeptides by enzymatic hydrolysis of edible bird’s nest: the physicochemical characteristics and protein profile. Journal of Food Measurement and Characterization. 14(5), 2635-2645. https://doi.org/10.1007/s11694-020-00510-4.
- Preliminary study of the nutritional content of Malaysian edible bird's nest. Malays. J. Nutr.. 2010;16(3):389-396.
- [Google Scholar]
- Nurfatin, M.H., Etty Syarmila, I.K., Nur ‘Aliah, D., Zalifah, M.K., Babji, A.S., Ayob, M.K., 2016. Effect of enzymatic hydrolysis on Angiotensin converting enzyme (ACE) inhibitory activity in swiftlet saliva. International Food Research Journal. 23(1), 141-146.
- Response surface optimization of polydimethylsiloxane (PDMS) on borosilicate glass and stainless steel (SS316) to increase hydrophobicity. Molecules. 2022;27(11):3388.
- [CrossRef] [Google Scholar]
- Chemical reactivity and surface chemistry of porous silicon. In: Canham L., ed. Handbook of Porous Silicon. Switzerland: Springer International Publishing; 2014. p. :355-380.
- [Google Scholar]
- Antioxidant compounds and their antioxidant mechanism. In: Shalaby E., ed. Antioxidants. London: Intech Open; 2019. p. :1-28.
- [Google Scholar]
- Synergistic antioxidant activity of natural products. Ann. Pharmacol. Pharma.. 2017;2(8):1086.
- [Google Scholar]
- Sensory Evaluation Practices. Florida: Academic Press; 1985.
- USFDA. 2018. Reference amounts customarily consumed: List of products for each product category: Guidance for industry https://www.fda.gov/media/102587/download (accessed 29 May 2020).
- Synergistic, additive, and antagonistic effects of food mixtures on total antioxidant capacities. J. Agric. Food Chem.. 2011;59(3):960-968.
- [CrossRef] [Google Scholar]
- Antioxidant activity of protein hydrolysates derived from threadfin bream surimi byproducts. Food Chem.. 2012;132(1):104-111.
- [CrossRef] [Google Scholar]
- Complete digestion of edible bird's nest releases free N-acetylneuraminic acid and small peptides: An efficient method to improve functional properties. Food Funct.. 2018;9(10):5139-5149.
- [CrossRef] [Google Scholar]
- Consumer Awareness. Attitudes and Preferences Towards Heritage Cereals. 2020;9(13):742.
- [CrossRef] [Google Scholar]
- Effect of high oxygen atmosphere storage on quality, antioxidant enzymes, and DPPH-radical scavenging activity of Chinese bayberry fruit. J. Agric. Food Chem.. 2009;57(1):176-181.
- [CrossRef] [Google Scholar]
- Sialic acid concentrations in plants are in the range of inadvertent contamination. Planta. 2006;224(1):222-227.
- [CrossRef] [Google Scholar]
- The Biological Response of Carica papaya Leaves Extract to Saponin Reduction (O/W) Emulsion on Human Bronchial Epithelium Cell (BEAS-2B) Arab. J. Chem.. 2023;16(1):104416
- [CrossRef] [Google Scholar]


