

Antioxidant capacity, anti-inflammatory activity, and mutagenicity of Sterculia lychnophora (Pangdahai) polysaccharide
⁎Corresponding author. pohsien0105@pu.edu.tw (Po-Hsien Li)
-
Received: ,
Accepted: ,
This article was originally published by Elsevier and was migrated to Scientific Scholar after the change of Publisher.
Abstract
-
Scientific evidence and validation confirmed the safety of PP consumption.
-
The bioactive components and potential benefits of PP have been validated.
-
PP's biological activity comes from its monosaccharides, phenols, and flavonoids.
Abstract
Dried boat-fruited ripped seeds of Sterculia lychnophora, commonly known as Pangdahai, are frequently used in traditional Chinese medicines and functional foods. However, research on these constituents is limited. In this study, the extraction of Pangdahai polysaccharide (PP) was investigated using different solvents (deionized water, 50 % methanol, and 50 % ethanol), and its chemical composition, antioxidant capacity, and anti-inflammatory activity were analyzed. Additionally, the Ames test was used to evaluate PPs’ food safety and mutagenicity. The results showed that the yields of PPs extracted with the three solvents ranged from ∼ 19 % to 21 % and that their monosaccharide compositions (rhamnose, arabinose, galactose, and glucose) were similar, with slightly different proportions. Moreover, the antioxidant capacity of all three PPs showed concentration-dependent effects. The EC50 values for each antioxidant were approximately 0.71–1.35 mg/mL for 1, 1-diphenyl-2-picrylhydrazyl free radical scavenging ability, 1.88–46.13 µg/mL for 2,2-azino-bis-(3-ethylbenzothiazoline-6-sulfonic acid) radical scavenging ability, 2.22–3.61 mg/mL for ferric reducing antioxidant power, and 0.52–3.11 mg/mL for hydroxyl radical scavenging ability. At concentrations below 500 µg/mL, the anti-inflammator activity of PPs promoted cell proliferation while inhibiting nitric oxide production at concentrations ranging from 31.25 to 125 µg/mL. In the Ames test, PPs (1–5 mg/plate) exhibited no toxicity or mutagenicity against the five strains of Salmonella typhimurium (TA98, TA100, TA102, TA1535, and TA1537). These findings will particularly be of interest to individuals involved in PP-related research or commercial enterprises. Thus, the findings of this study will elucidate the bioactive components and potential benefits of PP, making it especially valuable to researchers and practitioners in the Pangdahai industry and expanding opportunities for industrial development.
Keywords
Ames test
Food safety
Mutagenicity
Pangdahai
Polysaccharides

1 Introduction
Pangdahai has a long history of usage in traditional Chinese medicine and Japanese folk medicine, as well as in Vietnam, Cambodia, Thailand, Laos, Indonesia, and Indian traditional medicine (Ai et al., 2012; Lv et al., 2022; Oppong et al., 2018; Soejarto et al., 2023; Srichamroen & Chavasit, 2011; Toan & Chi, 2022; Wu, Cui, Tang, & Gu, 2007). Additionally, it has been used as a health food, functional beverage, dessert, buccal tablet, or candy (often combined with other herbs in complex formulas), Pangdahai belongs to the class of herbs with dual roles in food and medicine and is popularly known for its effectiveness in preventing and treating inflamed throats, pharyngitis (throat pain), dry or nonproductive cough, and hoarseness (Ai et al., 2012; Kanlayavattanakul et al., 2017; Lim, 2012; Oppong et al., 2018; Xue et al., 2022; Yang et al., 2016). Its benefits may be attributed to its enrichment in bioactive compounds such as polysaccharides, lipids, flavonoids, organic acids, alkaloids, phenolics, peptides, cerebrosides, steroids, and terpenoids (Li, 2015; Oppong et al., 2018; Wang, Wu, & Geng, 2013; Wu, Cui, Tang, & Gu, 2007; Yang et al., 2016).
Moreover, Pangdahai gum has been explored in food science, serving as a fat substitute in Thai emulsion-based pork sausage products (Lim, 2012), reducing cooking losses while improving the texture of frankfurter sausages, among other benefits (Lim, 2012; Somboonpanyakul et al., 2007). It has also been used to replace wheat flour in bread formulations, thereby improving the shelf life and textural properties (Srichamroen, 2014). In addition, regarding enhancing dietary fiber in meat products, Lertnimitmongkol and Mongkontanawat (2022) reported that a 3 % contribution of Pangdahai gum improved the aroma and taste of fish tofu while providing the highest acceptability sensory scores and enhancing its physicochemical properties. Pongthananikorn, Veranitinun and Meksawan (2007) reported that supplementation with the Pangdahai beverage reduced serum glucose and lipid levels in patients with type 2 diabetes (n = 32) in an 8-week clinical study. Following incubation of Caco-2 cell lines with 0.25 % (w/w) Pangdahai gum, a significant reduction in glucose uptake ranging from 50 % to 85 % was observed compared to the control group. This highlights the potential of Pangdahai gum as a promising candidate for health promotion, particularly for mitigating hyperglycemia (Srichamroen, 2018). Therefore, a comprehensive analysis of the Pangdahai polysaccharide (PP) constituents is required to gain insights into its properties and potential benefits. Thus, this study investigated the extraction of PP from Pangdahai gum and aimed to determine its efficacy in terms of antioxidant capacity, anti-inflammatory activity, and safety (using toxicity and mutagenicity tests).
2 Materials and methods
2.1 Materials
Pangdahai was purchased from a local market (Taichung, Taiwan). The mouse BALB/c macrophage cell line RAW264.7 (BCRC 60001) was purchased from the Bioresource Collection and Research Center (BCRC; Hsinchu, Taiwan). Dulbecco Modified Eagle Medium (DMEM), Fetal Bovine Serum (FBS), trypsin-EDTA (0.5 %), phenol red, and 0.4 % trypan blue were purchased from Gibco (Thermo Fisher Scientific, Inc., Waltham, MA, USA). All the chemicals were purchased from Sigma-Aldrich (Merck KGaA, Darmstadt, Germany). Salmonella typhimurium TA98, TA100, TA102, TA1535, and TA1537 were purchased from the Bioresource Collection and Research Center (BCRC, Hsinchu, Taiwan).
2.2 Basic composition analysis
The basic composition analysis of the samples was performed with moisture (950.46), crude protein (935.11), crude fat (920.39), crude fiber (962.09), and ash (942.05) contents, as described by the AOAC (2023) Official Method.
2.3 Extraction and purification of polysaccharides
Three different solvents were used to extract PP, as described by Ai et al. (2012) and Devasvaran, Alallam, and Lim (2023), with some modifications. Each 100 g sample was immersed in deionized water, methanol, and ethanol at 1/10 (w/v) and 4 °C for 24 h. Next, the inner and outer seed coats were removed and lyophilized. Each of the three solvents was stirred (80 rpm) for 4 h and filtered through a 100-mesh sieve, followed by centrifugation (9,000 × g, 4 °C, 15 min) of the collected filtrate. The supernatant was collected, and then a 4-fold volume of 95 % alcohol was added and incubated at 4 °C for overnight sedimentation. The sample was then centrifuged (9,000 × g, 4 °C, 15 min), and the residue was lyophilized. Dark reddish-brown PP was also obtained.
PPs were dissolved in hot deionized water (50 °C) to a concentration of 1.5 % (g/mL) and centrifuged (10,000 g × 15 min) to remove insoluble substance, and the supernatant was decanted and concentrated. The concentrated PPs were fractionated by anion-exchange chromatography on a DEAE-cellulose column (D 2.6 × 30 cm) equilibrated with 0.02 M acetic acid-sodium acetate buffer (pH 5.0). The column was first eluted with the same buffer at a 2.0 mL/min flow rate, followed by a linear gradient of the NaCl concentration (0–2.0 M). Eluting solutions were collected with a fraction collector, concentrated using a rotary evaporator at 50 °C, dialyzed for 3 days, and lyophilized. The sample was then loaded onto a Sepharose CL-6B gel column (D 1.6 × 100 cm) and eluted with phosphate buffer at a flow rate of 0.3 mL/min. The obtained eluate was pooled, concentrated, dialyzed, and lyophilized. Finally, the ground powder was passed through a 100-mesh sieve and stored in a desiccator until further use. Three solvent extractions of PP were obtained: deionized water (PPW), 50 % methanol (PPM), and 50 % ethanol (PPE).
2.4 Compositions analysis of polysaccharide
2.4.1 Determination of total carbohydrate content
The total carbohydrate content of the samples was determined using the phenol–sulfuric acid method described by Nielsen (2017). Briefly, the three crude polysaccharide samples were reconstituted with deionized water (100 µg/mL), 1 mL of each sample was collected, and 1 mL of 5 % phenol was added, followed by the rapid addition of 5 mL of sulfuric acid within 30 s, and mixed uniformly before cooling in an ice bath. Finally, the absorbance at 490 nm was measured using a spectrophotometer (U-2001, Hitachi, Ltd., Tokyo, Japan). Standard curves were prepared using glucose (20–100 µg/mL), and the total carbohydrate content of the samples was calculated using the obtained regression equations.
2.4.2 Determination of protein content
The protein content of the samples was determined using the Lowry method described by Waterborg (2009). The sample (1 mL) was added 1 mL of reaction reagent (composed of 15 mL of 0.1 % Na2CO3 dissolved in 0.5 N NaOH, 0.75 mL of 1 % CuSO4, and 0.75 mL of 1 % NaKC4O6) mixed uniformly by oscillation and kept at room temperature for 15 min. Next, 3 mL of Folin-phenol reagent was added, the reaction was kept at room temperature for 45 min, and the absorbance at 750 nm was measured using a spectrophotometer (Hitachi Co., Ltd.). A standard curve was prepared using bovine serum albumin (BSA) (0–100 µg/mL), and the protein content of the sample was calculated by interpolation.
2.4.3 Determination of uronic acid content
The uronic acid content of the samples was determined as described by Huang et al. (2012) with minor modifications. The sample (0.2 mL) was mixed with 1.2 mL of a 0.0125 M sodium tetraborate solution by oscillation. It was then placed in an ice bath for cooling and oscillated again until it was homogenized. The reaction was allowed to proceed in boiling water at 100 °C for 5 min and then cooled in an ice bath. Subsequently, 20 µL of 0.15 % meta-hydroxydiphenyl solution (in 0.5 % NaOH solution) was added by mixing uniformly and standing for 5 min. Finally, the absorbance of the sample was measured at 520 nm. The standard curve was prepared from the glucuronides, which were calculated by interpolation of the uronic content of the samples.
2.4.4 Determination of monosaccharide composition
The monosaccharide composition was determined as described by Wang et al. (2021), with minor modifications. The crude polysaccharide samples in this study were acid-hydrolyzed with 2 M HCl (shaking at 120 rpm in a hot water bath at 85 °C for 16 h). Next, the samples were concentrated to dryness by rotary evaporation (N-1300EF-W; EYELA Co., Tokyo, Japan), followed by re-dissolution with 10 mL of deionized water. Then, the samples were pH-neutralized using anion-exchange resin and filtered through a 0.22 µm membrane. Next, the filtered sample was injected into the High-Performance Anion Exchange chromatography with Pulsed Amperometric Detection (HPAEC-PAD; Dionex DX-500 Bio-LC system, Thermo Fisher Scientific, Inc.) to analyze the monosaccharide composition. The conditions were as follows: the protection column used was CarboPac™MpA100 (4 × 50 mm, Thermo Fisher Scientific, Inc.); the separation column was CarboPac™MPA100 (4 × 250 mm, Thermo Fisher Scientific, Inc.), and the eluent solutions were 0.2 M NaOH and 2 % 0.2 M NaOH in distilled water with gradient separation in various ratios, at a flow rate of 0.75 mL/min. Finally, the composition of the samples was confirmed using the standards [(rhamnose (Rha), arabinose (Ara), galactose (Gal), glucose (Glu), xylose (Xyl), and mannose (Man)], and the monosaccharide contents were calculated using the equations obtained from the standard curves.
2.4.5 Determination of total polyphenol content (TPC)
The TPC in the samples was determined following the method described by Huang et al. (2022), with minor modifications. The sample (400 µL) was mixed with 400 µL of Folin & Ciocalteu's phenol reagent by oscillation and allowed to stand for 3 min. Subsequently, 40 µL of 10 % Na2CO3 was added, followed by 1 h of reaction (with oscillations every 10 min). Finally, absorbance at 735 nm was measured using a spectrophotometer (Hitachi Co., Ltd.). The standard curve was prepared from gallic acid (GA), for which the TPC content of samples was expressed as gallic acid equivalent (mg GAE/mL).
2.4.6 Determination of total flavonoid content (TFC)
This study determined based on the method described by Liu et al. (2023), with slight modifications. The sample (1 mL) was added to 4 mL of deionized water and 0.3 mL of 5 % NaNO2 and allowed to react for 5 min, to add 0.3 mL of 10 % AlCl·6H2O and mix well with shaking at room temperature for 6 min. Next, 2 mL of the reaction solution was added to 2 mL of 1 M NaOH, followed by a spectrophotometry measurement of absorbance at 510 nm. The TFC in the samples was expressed as quercetin equivalents (µg QE/mL).
2.5 Determination of antioxidant capacity
2.5.1 DPPH free radical scavenging ability
DPPH radical scavenging ability was determined as described by Li, Chan, et al. (2020) and Wang, Chen, and Hou (2019), with minor modifications. One hundred microliters of the sample were added to 400 µL of 100 mM Tris-HCl buffer solution (pH 7.4) and 500 µL of 250 µM DPPH ethanol solution before shaking for 20 s. The reaction was incubated in a dark room for 20 min, and the absorbance at 517 nm was determined using a spectrophotometer (Hitachi Co., Ltd.). The control group received BHT. The DPPH free radical scavenging ability of the samples was calculated based on the following equation:
2.5.2 Reducing power
The reducing power of the samples was based on the method described by Huang et al. (2011), with minor modifications. The sample (150 µL) was added to 150 µL of phosphate buffer solution (PBS; pH 6.6) with 150 µL of 1 % K3Fe(CN)6, mixed homogeneously, and then incubated in a water bath for 20 min at 50 °C. After cooling in an ice bath for 3 min, 150 µL of 10 % TCA, 600 µL of deionized water, and 120 µL of 0.1 % FeCl3 were mixed uniformly, followed by a 14-min reaction at room temperature, and the absorbance value at 700 nm was then determined.
2.5.3 FRAP
The FRAP of the samples was determined as described by Li, Chan, et al. (2020), with minor modifications. The sample was taken at 250 µL, and 925 µL of PBS (pH 7.4) and 25 µL of FeCl2 were mixed by oscillation. After 30 s, 50 µL of ferrozine was added and allowed to react for 10 min. Finally, the absorbance value was measured at 562 nm. EDTA was used as the control group. The chelating ability of FRAP was calculated using the following equation.
2.5.4 ABTS free radical scavenging ability
The ABTS free radical scavenging ability was determined based on the method described by Huang et al. (2011) and Li, Chan, et al. (2020), with minor modifications. The sample or Trolox (prepared in 0.01 M pH 7.4 PBS with 0.15 M HCl) was mixed with 500 µL of 0.01 M PBS (pH 7.4, 0.15 M HCI) and 500 µL of 0.175 M ABTS, then shocked until uniform, and the allowed to stand for 10 min before measuring the absorbance value at 734 nm. Remarkably, the entire operation of the trial was performed with avoidance of light. ABTS free radical-scavenging ability was calculated using the following formula:
2.5.5 Hydroxy free radical scavenging ability
The hydroxyl free radical scavenging ability was determined according to the method described by Lo Scalzo (2021) with minor modifications. Each 300 µL of the sample (or Catechin; control group) was added 1,000 µL of 4 µM H2O2 and horseradish peroxidase-phenol red (0.2 mg/mL of phenol red dye with 0.1 mg/mL horseradish peroxidase), followed by shaking and mixing evenly. Then, the reaction was allowed to stand for 20 min, protected from light, and the absorbance at 610 nm was measured.
2.5.6 Half effective concentration (EC50)
In this study, the above antioxidant capacity analyses were expressed as EC50, while the EC50 is the concentration required for a sample to reach 50 % effectiveness, with the value being smaller, meaning that the antioxidant ability of the sample was better, while the high value indicated that the antioxidant ability of the sample was better.
2.6 Determination compositions of the functional groups
The functional groups of the polysaccharides were determined as described by Chou et al. (2023) and Li, Lu, et al. (2020). The dried sample (2 mg) was mixed with 120 mg of potassium bromide and pressed into a 13 mm film tablet using a tablet press. This tablet was analyzed using a Fourier transform infrared spectrometer (FT-IR, Satellite 5000, Mattson Technology, Fremont, CA, USA) in the 400–4000 cm−1 range.
2.7 Determination of cell viability by MTT assay
The RAW264.7 cell lines’ viability assay was performed as described by Huang et al. (2012), with minor modifications. The RAW264.7 cell lines’ concentration was adjusted to 1 × 10⁵ cells per mL and inoculated into a 96-well plate at 1 mL per well, and 9 mL of DMEM medium (with 10 % FBS) was added and incubated for 24 h (37 °C, 5 % CO2). Then, the medium used for incubation was removed, and 10 mL of DMEM medium (with 10 % FBS) containing different concentrations of samples for another 24 h. Next, 10 µL of MTT (5 mg/mL) was added and incubated for 4 h. Finally, 200 µL of DMSO was added, and absorbance at 570 nm was determined using an ELISA reader. The cell viability was calculated using the following formula:
2.8 Determination of NO concentration
NO concentration was determined based on the Griess colorimetric reaction method described by Liu et al. (2020), with some modifications. The inoculated cells were treated as described in section 2.7 above; apart from that, samples were treated for 4 h before adding lipopolysaccharides (LPS). The cells were then incubated for 20 h. Then, 150 µL of supernatant medium was taken from each well, and 20 µL of Griess reagent (prepared with 1 % sulfanilamide and 0.1 % naphthylenediamine dissolved in 5 % phosphoric acid at a ratio of 1:1 v/v) was added. Next, the reaction mixture was allowed to stand for 10 min in the dark. Finally, absorbance values were determined at 540 nm using an ELISA reader. The standard curve was prepared from NaNO2, and the NO contents derived from the samples-treated RAW264.7 cell lines were calculated by interpolation.
2.9 Ames test screening
The Ames test followed the methods described by Pillco and de la Peña (2014), Vijay et al. (2018), and Tsirigotis-Maniecka et al. (2023), with some modifications. One milliliter of five strains of S. typhimurium (TA98, TA100, TA102, TA1535, and TA1537) broth and 9 mL of nutrient broth was added to a 50 mL tapered flask and incubated in a shaking incubator (150 rpm, 37 ± 2 °C) for 8–10 h. All assays were performed after activation of the strains.
2.9.1 Toxicity assay
Each 0.1 mL broth (the absorptance at 600 nm was 0.3) was taken, then 0.1 mL of sample was added and mixed with 0.2 mL of sterile water, split equally into 2 groups, one with 0.6 mL of 0.2 M sodium PBS (pH 7.4), and the other with 0.6 mL of S9 mixture [it was prepared by 1 mL of 0.2 M B-Nicotinamide adenine dinucleotide phosphate, sodium salt, 1.25 mL of 0.2 M Glucose-6-phosphate monosodium salt (G-6-P), and 42.75 mL sodium PBS (consisting of 1.0 mL of 0.4 M MgCl, 1.0 mL of 1.65 M KCI, 25.0 mL of 0.2 M phosphate buffer (pH 7.4) mixed with 15.75 mL of sterile water, obtained by mixing then sterilization) Finally, 2 mL of rodent liver extract (S9) and 3 mL of sterile water were added, which were evenly mixed]. Next, 12 mL of nutrient agar was added and evenly mixed. It was then transferred to a sterile culture dish, coagulated, inverted, and incubated at 37 °C for 48 h. Finally, colonies were counted. The control group contained no sample and was replaced with 0.1 mL of DMSO. The inhibition of the toxicity assay implied that the number of colonies of the five strains of S. typhimurium decreased as the concentration of the test samples increased (Pillco & de la Peña, 2014).
2.9.2 Mutagenicity test
All operations were performed as described in the previous Section 2.9.1, except for the composition of the solutions that were added (0.1 mL of sample, 0.1 mL of sterile water, and 0.2 mL of 0.5 mM histidine/biotin) and subsequent incubation was conducted using the glucose minimal agar. The control groups were the mutagenesis 2-anthracene (2-AA), 2-aminifluorene (2-AF), sodium azide (AZ-Na), 4-nitroquinoline-N-oxide (4-NQO), and t-buty-hydroperoxide (t-BHP). The rationale relates to the limited growth of His-deficient strains due to the lack of sufficient histidine in the medium used, while the colonies mutated by spontaneous revertant mutations developed (Hoenerhoff et al., 2022). A positive reaction was determined in cases where the colony count was more than 2 folds higher than that in the control group or when the colony count increased as the sample concentration increased. Conversely, a sample with a significantly lower colony count than the control group was determined to be negative and exhibited antioxidant mutagenicity (Panchal et al., 2023).
2.10 Statistical analysis
Unless otherwise specified, all trials were conducted in triplicate, and the results are expressed as mean ± SD. All statistical analyses of the data collected in this study were performed using SAS statistical software (version 9.4, SAS Institute, Cary, NC, USA). One-way analysis of variance (ANOVA) was used to analyze each group of trials. Duncan's multivariate analysis of variance was used to analyze the differences between the groups, which were statistically significant (p < 0.05).
3 Results and discussion
3.1 Basic composition contents
Analysis of the basic composition of the Pangdahai samples used in this study revealed a moisture content of 13.71 % (Table A1), with carbohydrates accounting for 84.90 % of the composition. Additionally, the samples contained 5.28 % crude fat, 3.61 % crude fiber, 4.11 % crude protein, and 1.99 % ash. Despite the slight variations in their values, the proportional distribution of these nutrients was similar to that reported by Srichamroen and Chavasit (2011), Yang et al. (2016), and Srichamroen (2018). These discrepancies can be attributed to differences in origin and processing conditions.
3.2 Yield of PPs
Three solvents (deionized water, methanol, and ethanol) were utilized in the extraction of PPs in this study, resulting in yields of 19.95 % (PPW), 21.54 % (PPM), and 19.09 % (PPE) (Table 1). PPM exhibited a relatively high extraction yield (p < 0.05). These results align with those of Somboonpanyakul et al. (2006) for different extraction methods (e.g., hot water, dilute acid, and alkaline). They suggested that most polysaccharides might either be covalently linked to other components or physically trapped within the cell wall.
| Measured item | Pangdahai polysaccharide (PP) extracted by | ||
|---|---|---|---|
| Deionized Water (PPW) | Methanol (PPM) | Ethanol (PPE) | |
| Yield (%) | 19.95 ± 0.20a | 21.54 ± 0.33b | 19.09 ± 0.37c |
| Total carbohydrate (%) | 78.38 ± 1.89a | 77.29 ± 3.71a | 88.35 ± 3.08b |
| Protein (%) | 6.86 ± 1.50a | 8.17 ± 1.63b | 7.17 ± 0.70c |
| Uronic acid (mg/g) | 354.12 ± 26.97a | 241.75 ± 9.48b | 269.07 ± 8.75c |
| Total polyphenol content (TPC) (mg/g) | 23.21 ± 0.75a | 64.58 ± 4.94b | 57.93 ± 4.28c |
| Total flavonoid content (TFC) (mg/g) | 2.97 ± 0.18a | 1.95 ± 0.23b | 3.54 ± 0.21c |
| Rhamnose (Rha) (%) | 28.7 ± 0.48a | 31.0 ± 0.57a | 29.7 ± 0.60a |
| Arabinose (Ara) (%) | 31.9 ± 0.55a | 29.6 ± 0.39b | 33.1 ± 0.67a |
| Galactose (Gal) (%) | 29.3 ± 0.47a | 30.1 ± 0.14b | 32.0 ± 0.57c |
| Glucose (Glu) (%) | 4.60 ± 0.50a | 4.90 ± 0.27a | 1.90 ± 0.04b |
Different lowercase letters in the same row represent significant differences (p < 0.05).
3.3 PPs composition content
Subsequent analysis of the PPs composition showed that the total carbohydrate content was 78.38 % (PPW), 77.29 % (PPM), and 88.35 % (PPE), with the highest content observed in PPE (p < 0.05) (Table 1). This difference could be attributed to the lower polarity of ethanol than that of water and methanol. However, compared to Wu, Cui, Tang and Gu (2007), who extracted 58.2 % of the total carbohydrates in 2.3–3.1 h, extending the extraction time in this study might have yielded more carbohydrates. Moreover, Wu, Cui, Tang, et al. (2007) found that PP contained a total carbohydrate content of 61.17 %, whereas the neutral and acidic PP purified by DEAE gel filtration were 89.06 % and 86.38 %, respectively. Therefore, the total carbohydrate content of PP depends on the extraction method, conditions, and availability of fractions, considering the variations in the source region of the sample.
In the plants, polysaccharides were often covalently bonded with proteins, making them resistant to rupture, thus forming proteoglycans or peptide polysaccharides during extraction and precipitation (Muthusamy, Udayakumar, & Narala, 2021). Simultaneously, organic solvents and alcohols bind intermolecularly with polysaccharides, reducing the dielectric constant of these polysaccharides and inducing conformational changes, aggregation, and molecule precipitation (Muthusamy, Udayakumar, & Narala, 2021). This process effectively eliminated impurities, thus enhancing the overall quality and stability of the polysaccharides. In this study, the protein contents of the three extracted PPs were 8.17 % (PPM), 7.17 % (PPE), and 6.86 % (PPW), with PPM aligned with the results reported by Wu, Cui, Tang, et al. (2007). Additionally, the uronic acid contents of the three extracted PPs in this study were 354.12 mg/g (PPW), 269.07 mg/g (PPE), and 241.75 mg/g (PPM) (Table 1), indicating that PPs comprise acidic polysaccharides, consistent with previously reported results (Li, 2015; Toan & Chi, 2022).
3.4 Total polyphenol content (TPC) and total flavonoid content (TFC) of PPs
TPC and TFC exhibit a remarkable ability to scavenge free radicals, thereby regulating inflammatory pathways in vivo (Liu et al., 2023). The TPC of the three extracted PPs in this study were 64.58 mg/g (PPM), 57.93 mg/g (PPE), and 23.21 mg/g (PPW) (Table 1). It was hypothesized that using alcoholic solvents would enhance TPC extraction, with methanol extraction being the preferred method. In contrast, the highest to lowest TFC values were 3.54 mg/g (PPE), 2.97 mg/g (PPW), and 1.95 mg/g (PPM) (Table 1).
3.5 Various monosaccharide contents of PPs
In this study, the PPs obtained through the three extraction methods had similar monosaccharide compositions, with Rha (28.70 %–31.00 %), Ara (29.60 %–33.10 %), and Gal (29.30 %–32.00 %) contents (Table 1). However, the Glu content was the lowest, accounting for 1.90 % of PPE, compared to 4.60 % and 4.90 % for PPW and PPM, respectively (p < 0.05). Moreover, PPs primarily contained branched units with varying amounts of uronic acid (40.1 %–58.2 %) and Rha (10.0 %–11.4 %), while unbranched units contained Ara (7.9 %–17.5 %), Gal (5.00 %–15.7 %), and Xyl (0.6 %–0.8 %) residues (Wu, Cui, Tang, & Gu, 2007; Wu, Cui, Tang, et al., 2007). The monosaccharide composition of PP did not differ depending on extraction conditions. However, their contents were significantly different, consistent with the findings of Somboonpanyakul et al. (2006) and Srichamroen and Chavasit (2011).
3.6 PP functional group analysis
This study analyzed the PP functional groups obtained from the three extraction methods using FT-IR spectroscopy. The results showed that an –OH stretching band was observed at 3,200–3,600 cm−1 (Fig. 1), and that an infrared absorption band derived from the stretching vibration of the C–H bonds was observed at 2,850–3,000 cm−1 (Lim et al., 2022; Wu, Cui, Tang, & Gu, 2007). One of the absorption peaks at 2,300–2,400 cm−1 indicated the presence of the C≡N functional group, and C = N was at 1,730 cm−1 and 1,760 cm−1. In the 1,600–1,630 cm−1 range, the −COOR and –COO groups exhibited asymmetric and symmetric stretching. The 1,400–1,600 cm−1 range displays overlapping absorption peaks for the C-O-C and C-OH stretching vibrations (Kanlayavattanakul et al., 2017). In addition, a significant absorption peak was observed between 1,010 cm−1 and 1,095 cm−1, indicating the presence of a pyranose ring. These FT-IR results were consistent with those of previous studies (Patra et al., 2023; Srichamroen & Chavasit, 2011; Wu, Cui, Tang, et al., 2007; Xie et al., 2023; Zhang et al., 2023).
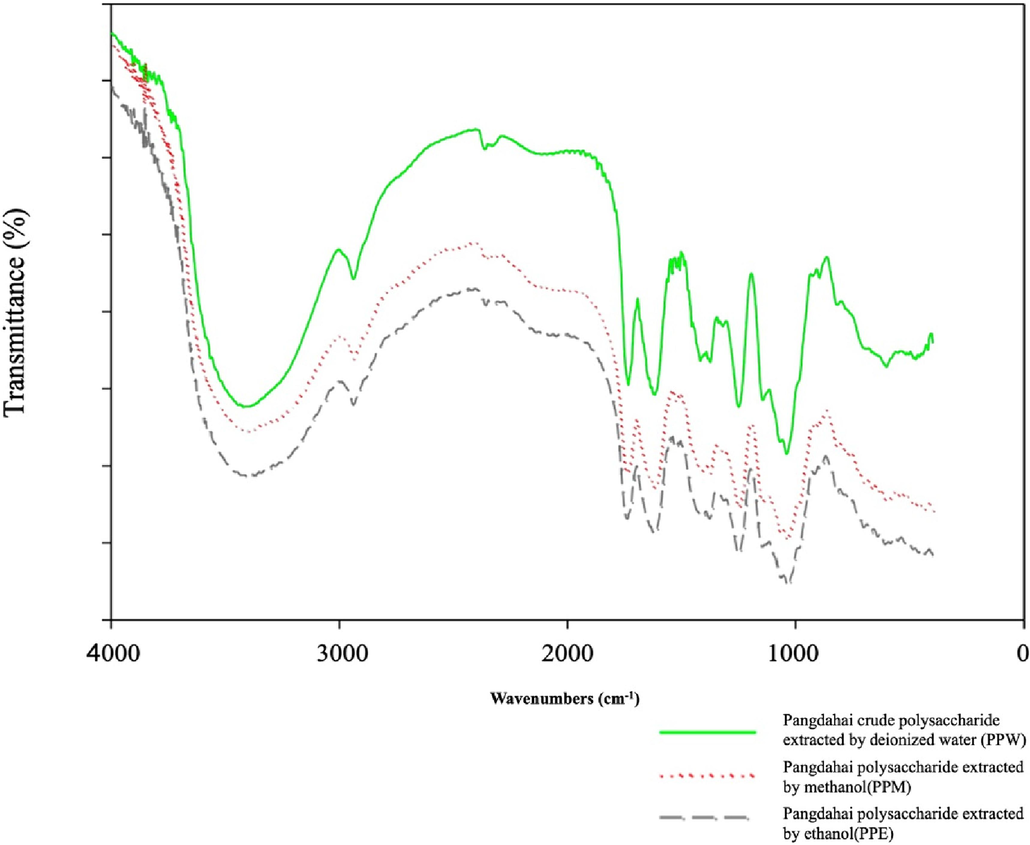
- FTIR spectra of polysaccharide of Sterculia lychnophora.
3.7 Antioxidant capacity evaluation of PPs
Polysaccharides from various natural sources play a crucial role in antioxidant capacity by mitigating the harmful effects of excessive production of reactive oxygen species (ROS) on cellular components of the body (Devasvaran, Alallam, & Lim, 2023). Therefore, this study aimed to determine the antioxidant capacity of PP by using five common evaluation methods, expressed as EC50 values.
The EC50 values for 1, 1-diphenyl-2-picrylhydrazyl free radical scavenging ability in this study were 1.35 mg/mL (PPW), 0.71 mg/mL (PPM), and 0.80 mg/mL (PPE) (Table 2), while the control BHT, had an EC50 value of 0.14 mg/mL, showing significant differences in each group (p < 0.05). Although the PPs extracted in this study were less effective than BHT, they demonstrated a certain degree of antioxidant ability.
| Radical scavenging ability | Pangdahai polysaccharide (PP) extracted by | BHT | EDTA | Trolox | Citric acid | ||
|---|---|---|---|---|---|---|---|
| Deionized Water (PPW) | Methanol (PPM) | Ethanol (PPE) | |||||
| DPPH (mg/mL) | 1.35 ± 0.08a | 0.71 ± 0.02b | 0.80 ± 0.07c | 0.14 ± 0.00d | − | − | − |
| FRAP (mg/mL) | 5.95 ± 0.06a | 2.02 ± 0.11b | 1.24 ± 0.09c | − | 0.27 ± 0.03d | − | − |
| ABTS (μg/mL) | 46.13 ± 0.21a | 1.97 ± 0.09b | 3.76 ± 0.13c | − | − | 1.88 ± 0.02b | − |
| Hydroxyl (mg/mL) | 1.25 ± 0.09a | 3.11 ± 0.13b | 0.52 ± 0.06c | − | − | − | 0.36 ± 0.02d |
Different lowercase letters in the same row represent significant differences (p < 0.05).
The measurement of the reducing power primarily serves as an indicator to evaluate whether the sample functions as a good electron supplier. In this study, the reducing power of the three extracted PPs was 0.74, 1.42, and 1.30 at a concentration of 1 mg/mL (Figure A1), which was considerably lower than that of the control group with BHT concentrations above 2.5. However, the reducing power of PPs exhibited a dose-dependent relationship with the concentration. PPM and PPE required 2.5 mg/mL to achieve effects similar to those obtained with 1 mg/mL of BHT. Therefore, it was concluded that 2.5–10 mg/mL PP was required to act as a suitable electron donor, reacting with free radicals to stabilize products and terminate free radical chain reactions.
Regarding ferric reducing antioxidant power, the EC50 values for PPs obtained by the three extraction methods were 5.95 mg/mL (PPW), 2.02 mg/mL (PPM), and 1.24 mg/mL (PPE). However, there was still a notable difference compared to BHT (0.27 mg/mL), with significant differences observed in each group (p < 0.05) (Table 2).
The EC50 values of PPs obtained from the three extraction methods regarding 2,2-azino-bis-(3-ethylbenzothiazoline-6-sulfonic acid) (ABTS) were 45.13 μg/mL (PPW), 1.97 μg/mL (PPM), and 3.76 μg/mL (PPE) (Table 2), PPM showed a similar ABTS radical scavenging effect to Trolox (1.88 μg/mL). The ABTS radical scavenging abilities of PP extracted from different solvents may be attributed to the availability of many OH groups that provide abundant antioxidant activity hydrogen ions, where PPM showed satisfactory efficacy. Additionally, substances bonded to the side chain of PP or TPC could affect antioxidant capacity, along with the molecular size and conformation of polysaccharides (Li, Li, & Zhou, 2007; Muhaxi, Liu, & Ng, 2023).
Hydroxyl radicals, which are considered highly reactive oxygen species (ROS) in biological systems, tend to interact with polyunsaturated fatty acids in cell membranes, contributing to cellular senescence (Muhaxi, Liu, & Ng, 2023) and potential health complications. The EC50 values for the hydroxyl free radical scavenging ability of PP obtained from the three extraction methods were 1.25 mg/mL (PPW), 3.11 mg/mL (PPM), and 0.52 mg/mL (PPE), while the control, citric acid, had an EC50 value of was 0.36 mg/mL. The PPE exhibited the optimal and most significant overall performance (p < 0.05) (Table 2). These findings suggest that PPE can scavenge hydroxyl radicals, thereby reducing their harmful effects on cellular health. This underscores the promising health-promoting properties of PP and its potential as an effective antioxidant. The results of this study are consistent with those of previous studies, showing a connection between the antioxidant capacity of natural substances and TPC (Chou et al., 2023; Rahman et al., 2015). Although the TPC of PPM in this study was higher than that of PPE, the antioxidant capacity showed the opposite trend, possibly because the side chains of polysaccharides differ from monosaccharides.
3.8 Anti-inflammatory properties of PPs
3.8.1 Effects of PP on the viability of RAW 264.7 cell lines
During inflammation, excessive NO can react with ROS to form peroxynitrite, which is associated with oxidative damage. This formation has been implicated in several pathological processes and can cause extensive biomolecular damage (Wang et al., 2020). This study examined the impact of three extracted PPs on the viability of RAW 264.7 cells. The cells were exposed to varying concentrations (0–1,000 μg/mL) of PPW and PPM extracts. The results indicated that neither PPW nor PPM negatively affected the viability of RAW 264.7 cell lines (Table 3). These extracts positively affected cell viability, consistent with the findings of Liu et al. (2022) and Wufuer et al. (2020), who observed similar outcomes with other polysaccharides. These results were also observed for PPE at treatment concentrations of 250 μg/mL or less. However, when the PPE treatment concentration increased to 500–1,000 μg/mL, RAW 264.7 cell viability decreased to 78 %–82 %. Notably, various studies have reported the production of 1-O-β-D-glucopyranosyl-(2S,3R,4E,8Z)-2-[(2-hydroxyoctadecanoyl)amido]-4,8-octadecadiene-1,3-diol and soybean-brain glycoside I via ethanol extraction and subsequent purification. Furthermore, at a concentration of 2.5 μg/mL, these compounds exhibited a moderate protective effect against H2O2-induced cell damage in SH-SY5Y cell lines (Wang, Wu and Geng, 2013). Therefore, the maximum added dose of PP was set at 500 μg/mL for all groups during the subsequent assessment of NO levels in the inflammatory response.
| Pangdahai polysaccharide (PP) extracted by | Concentration (μg/mL) | Cell viability (%) | Nitric oxide (NO) | |
|---|---|---|---|---|
| Production (μM) | Inhibition production rate (%) | |||
| Deionized water (PPW) | 1000 | 114.18 ± 0.03e | − | − |
| 500 | 120.78 ± 0.06c | 15.14 ± 0.01b | 30.62 ± 0.03 g | |
| 250 | 118.79 ± 0.11 cd | 12.32 ± 0.03e | 46.77 ± 0.05d | |
| 125 | − | 12.17 ± 0.01e | 47.82 ± 0.02c | |
| 100 | 113.64 ± 0.02e | − | − | |
| 62.5 | − | 10.94 ± 0.03 g | 49.93 ± 0.05c | |
| 50 | 110.21 ± 0.13f | − | − | |
| 31.25 | − | 10.66 ± 0.01 g | 50.45 ± 0.01c | |
| 15.625 | − | 11.72 ± 0.02f | 48.24 ± 0.02c | |
| methanol (PPM) | 1000 | 109.82 ± 0.03f | − | − |
| 500 | 122.22 ± 0.05c | 11.69 ± 0.05f | 52.56 ± 0.02b | |
| 250 | 126.39 ± 0.16b | 11.53 ± 0.01f | 49.89 ± 0.04c | |
| 125 | − | 9.95 ± 0.02 h | 55.10 ± 0.02a | |
| 100 | 134.57 ± 0.11a | − | − | |
| 62.5 | − | 9.88 ± 0.04 h | 55.97 ± 0.04a | |
| 50 | 127.17 ± 0.07b | − | − | |
| 31.25 | − | 13.78 ± 0.02d | 38.90 ± 0.02e | |
| 15.625 | − | 12.15 ± 0.05e | 44.12 ± 0.03d | |
| ethanol (PPE) | 1000 | 80.58 ± 0.06 h | ||
| 500 | 86.78 ± 0.07 g | 14.21 ± 0.02c | 33.95 ± 0.05f | |
| 250 | 116.49 ± 0.12d | 14.93 ± 0.01b | 31.79 ± 0.01 g | |
| 125 | − | 14.43 ± 0.02c | 33.93 ± 0.02f | |
| 100 | 126.84 ± 0.02b | − | − | |
| 62.5 | − | 13.68 ± 0.03d | 39.93 ± 0.03e | |
| 50 | 118.67 ± 0.08 cd | − | − | |
| 31.25 | − | 9.85 ± 0.03 h | 34.62 ± 0.01f | |
| 15.625 | − | 20.74 ± 0.02a | 5.66 ± 0.07 h | |
| Lipopolysaccharides (LPS) | − | 21.87 ± 0.01a | − | |
Different lowercase letters in the same row represent significant differences (p < 0.05).
3.8.2 Effects of PP on NO production by RAW 264.7 cell lines
During inflammatory cell injury, upregulation of the immune response is due to the activation of macrophages, which perform phagocytosis (cellular drinking and phagocytic activity) and the release of NO, serving as a signal to activate immune cells (Liu et al., 2020; Liu et al., 2022; Wufuer et al., 2020). In this study, the three extraction methods used to extract PP and LPS were used to treat RAW 264.7 cell lines. The results revealed that PPW at 31.25–62.5 μg/mL concentrations, PPM at 62.5–250 μg/mL, and PPE at 31.25 μg/mL effectively reduced NO production by the RAW 264.7 cell lines (Table 3). Additionally, when RAW 264.7 cell lines were induced with LPS to trigger NO production and then evaluated for the inhibition of NO production using the three PPs, all groups showed satisfactory inhibition of NO production at concentrations of 31.25–500 μg/mL (Table 3). Moreover, all groups displayed dose-dependent inhibition of NO production. Notably, PPM exhibited a high inhibition rate at 62.5–125 μg/mL, significantly different from the others (p < 0.05). These results suggest that the antioxidant capacity of PP effectively reduces cellular stimulation by free radicals, thus inhibiting NO production, which aligns with the findings of Wu, Cui, Tang, et al. (2007). Therefore, the inflammatory mediator NO is produced during inflammation by oxidizing L-arginine and converting arachidonic acid to COX-2 through inducible NO synthase (Liu et al., 2020).
3.9 Ames test of PPs
3.9.1 Toxicity assay
Despite the historical use of Pangdahai in food and medicine, concerns regarding the food safety of PP extracted using chemical solvents (methanol and ethanol) require clarification. In this study, the Ames test was employed to evaluate the toxicity of PP (1–5 mg/plate) using three extraction methods. These results showed that the colony sizes of the S. typhimurium strain TA98, TA100, TA102, TA1535, and TA1537 were at least 80 % compared to those of the control group at different concentrations of the three PPs (Table 4). The same results were observed when the S9 mix was added. These findings indicated that Pangdahai exhibited no toxic effects on developing the five S. typhimurium strains (Oppong et al., 2018).
| Pangdahai polysaccharide extracted by | Extracts (mg/plate) | TA98 | TA100 | TA102 | TA1535 | TA1537 | |||||
|---|---|---|---|---|---|---|---|---|---|---|---|
| -S9 | +S9 | -S9 | +S9 | -S9 | +S9 | -S9 | +S9 | -S9 | +S9 | ||
| Deionized water (PPW) | Control | 12.57 ± 0.08 | 12.23 ± 0.13 | 12.01 ± 0.31 | 12.23 ± 0.22 | 12.55 ± 0.11 | 12.67 ± 0.17 | 11.69 ± 0.53 | 11.62 ± 0.39 | 12.59 ± 0.10 | 12.63 ± 0.13 |
| 1 | 12.28 ± 0.18 | 12.30 ± 0.13 | 11.38 ± 0.38 | 11.44 ± 0.10 | 11.69 ± 0.19 | 11.68 ± 0.19 | 10.49 ± 0.49 | 10.40 ± 0.50 | 11.75 ± 0.12 | 11.71 ± 0.07 | |
| 2 | 12.42 ± 0.11 | 12.33 ± 0.06 | 11.35 ± 0.37 | 11.32 ± 0.30 | 11.58 ± 0.35 | 11.58 ± 0.35 | 10.84 ± 0.76 | 10.75 ± 0.60 | 11.57 ± 0.33 | 11.56 ± 0.17 | |
| 3 | 12.49 ± 0.18 | 12.42 ± 0.11 | 11.69 ± 0.30 | 11.48 ± 0.18 | 11.62 ± 0.12 | 11.61 ± 0.20 | 10.78 ± 0.37 | 10.06 ± 0.23 | 11.62 ± 0.20 | 11.66 ± 0.16 | |
| 4 | 12.51 ± 0.27 | 12.43 ± 0.13 | 12.08 ± 0.51 | 11.72 ± 0.23 | 11.73 ± 0.23 | 11.71 ± 0.16 | 10.97 ± 0.45 | 10.01 ± 0.55 | 11.80 ± 0.16 | 11.68 ± 0.12 | |
| 5 | 12.62 ± 0.14 | 12.48 ± 0.10 | 11.48 ± 0.52 | 11.21 ± 0.16 | 11.62 ± 0.12 | 11.64 ± 0.13 | 10.31 ± 0.36 | 10.23 ± 0.49 | 11.68 ± 0.07 | 11.62 ± 0.09 | |
| Methanol (PPM) | |||||||||||
| 1 | 12.37 ± 0.10 | 12.12 ± 0.21 | 11.33 ± 0.08 | 11.44 ± 0.08 | 12.05 ± 0.08 | 11.49 ± 0.22 | 10.13 ± 0.55 | 10.03 ± 0.50 | 11.71 ± 0.07 | 12.01 ± 0.04 | |
| 2 | 12.47 ± 0.12 | 12.26 ± 0.18 | 11.48 ± 0.18 | 11.31 ± 0.19 | 12.35 ± 0.09 | 11.30 ± 0.19 | 10.93 ± 0.60 | 10.83 ± 0.71 | 11.56 ± 0.17 | 11.45 ± 0.18 | |
| 3 | 12.55 ± 0.13 | 12.30 ± 0.12 | 11.79 ± 0.49 | 11.57 ± 0.19 | 12.27 ± 0.22 | 11.35 ± 0.23 | 10.72 ± 0.55 | 10.79 ± 0.30 | 11.66 ± 0.16 | 11.32 ± 0.14 | |
| 4 | 12.17 ± 0.13 | 11.98 ± 0.24 | 11.82 ± 0.20 | 11.68 ± 0.10 | 12.29 ± 0.21 | 11.85 ± 0.16 | 10.67 ± 0.22 | 10.74 ± 0.34 | 11.68 ± 0.12 | 11.40 ± 0.03 | |
| 5 | 12.55 ± 0.25 | 12.13 ± 0.13 | 11.39 ± 0.07 | 11.46 ± 0.19 | 11.94 ± 0.22 | 11.97 ± 0.36 | 10.83 ± 0.43 | 10.77 ± 0.56 | 11.62 ± 0.09 | 11.85 ± 0.85 | |
| Ethanol (PPE) | |||||||||||
| 1 | 11.80 ± 0.14 | 11.68 ± 0.07 | 11.36 ± 0.30 | 11.30 ± 0.15 | 11.49 ± 0.22 | 11.56 ± 0.11 | 10.19 ± 0.46 | 10.46 ± 0.58 | 11.45 ± 0.17 | 11.43 ± 0.16 | |
| 2 | 11.74 ± 0.14 | 11.64 ± 0.09 | 11.19 ± 0.62 | 11.46 ± 0.18 | 11.30 ± 0.19 | 11.36 ± 0.20 | 10.18 ± 0.32 | 10.44 ± 0.30 | 11.40 ± 0.08 | 11.42 ± 0.12 | |
| 3 | 11.46 ± 0.17 | 11.41 ± 0.16 | 11.21 ± 0.67 | 11.50 ± 0.17 | 11.35 ± 0.23 | 11.42 ± 0.21 | 10.79 ± 0.35 | 10.61 ± 0.46 | 11.21 ± 0.13 | 11.24 ± 0.11 | |
| 4 | 11.54 ± 0.20 | 11.50 ± 0.17 | 11.91 ± 0.22 | 11.81 ± 0.19 | 11.85 ± 0.16 | 11.80 ± 0.16 | 10.39 ± 0.40 | 10.53 ± 0.37 | 11.95 ± 0.30 | 11.85 ± 0.16 | |
| 5 | 11.60 ± 0.23 | 11.54 ± 0.19 | 11.12 ± 0.39 | 11.36 ± 0.11 | 11.51 ± 0.36 | 11.56 ± 0.19 | 10.07 ± 0.34 | 10.16 ± 0.52 | 11.68 ± 0.80 | 11.69 ± 0.16 | |
Data are presented as Means ± SD (n = 3).
3.9.2 Mutagenicity test
In the mutagenicity test, the results from the three PPs used in this study at different doses (1–5 mg/plate) showed that the colony counts of S. Typhimurium strains TA98, TA100, TA102, TA1535, and TA1537 were lower than those of the control group, irrespective of the addition of S9 mix (Table 5). This implies that all PPs used in this study were not mutagenic to the five S. typhimurium strains and were safe to consume. Implementing reasonable manufacturing procedures to facilitate product quality control in the future and developing rules based on historical control values when commercialized are worth considering (Levy et al., 2019). Interestingly, incorporating model predictions can potentially reduce the number of Ames tests required in the future, thereby saving time and resources. Toxicity and mutagenicity tests have long been recognized as fast and inexpensive alternatives to animal testing for standard carcinogen assays (Chu et al., 2021).
| Extracts (mg/plate) | TA98 | TA100 | TA102 | TA1535 | TA1537 | |||||||
|---|---|---|---|---|---|---|---|---|---|---|---|---|
| -S9 | +S9 | -S9 | +S9 | -S9 | +S9 | -S9 | +S9 | -S9 | +S9 | |||
| Pangdahai polysaccharide extracted by | Control | 110 ± 10 | 182 ± 4 | 101 ± 6 | 168 ± 2 | 113 ± 7 | 181 ± 7 | 47 ± 1 | 32 ± 14 | 111 ± 4 | 199 ± 4 | |
| Deionized water (PPW) | 1 | 92 ± 12 | 169 ± 6 | 93 ± 5 | 167 ± 11 | 94 ± 5 | 176 ± 5 | 23 ± 7 | 21 ± 6 | 92 ± 5 | 186 ± 7 | |
| 2 | 88 ± 14 | 168 ± 9 | 96 ± 7 | 173 ± 5 | 99 ± 6 | 192 ± 4 | 21 ± 4 | 19 ± 3 | 99 ± 3 | 181 ± 4 | ||
| 3 | 98 ± 7 | 177 ± 5 | 88 ± 4 | 177 ± 4 | 103 ± 2 | 199 ± 2 | 18 ± 5 | 19 ± 7 | 89 ± 7 | 175 ± 7 | ||
| 4 | 94 ± 7 | 181 ± 3 | 91 ± 7 | 161 ± 9 | 91 ± 8 | 163 ± 9 | 19 ± 8 | 16 ± 4 | 97 ± 4 | 183 ± 4 | ||
| 5 | 103 ± 9 | 173 ± 5 | 101 ± 4 | 163 ± 7 | 89 ± 7 | 172 ± 4 | 15 ± 5 | 15 ± 4 | 101 ± 5 | 192 ± 6 | ||
| Methanol (PPM) | 1 | 93 ± 11 | 188 ± 4 | 92 ± 9 | 181 ± 3 | 93 ± 7 | 183 ± 11 | 25 ± 8 | 22 ± 5 | 103 ± 7 | 192 ± 3 | |
| 2 | 88 ± 7 | 179 ± 7 | 97 ± 11 | 190 ± 7 | 99 ± 10 | 191 ± 2 | 21 ± 6 | 19 ± 5 | 97 ± 9 | 183 ± 7 | ||
| 3 | 95 ± 6 | 189 ± 6 | 96 ± 5 | 189 ± 9 | 89 ± 9 | 176 ± 7 | 23 ± 5 | 21 ± 6 | 105 ± 8 | 197 ± 8 | ||
| 4 | 91 ± 9 | 177 ± 5 | 99 ± 7 | 179 ± 4 | 96 ± 8 | 187 ± 9 | 19 ± 7 | 13 ± 5 | 98 ± 7 | 189 ± 6 | ||
| 5 | 96 ± 4 | 188 ± 4 | 95 ± 8 | 182 ± 3 | 91 ± 6 | 189 ± 6 | 17 ± 5 | 15 ± 4 | 101 ± 10 | 191 ± 4 | ||
| Ethanol (PPE) | 1 | 102 ± 5 | 192 ± 9 | 107 ± 8 | 192 ± 9 | 110 ± 7 | 196 ± 4 | 29 ± 5 | 22 ± 8 | 99 ± 6 | 189 ± 7 | |
| 2 | 99 ± 7 | 189 ± 5 | 99 ± 5 | 189 ± 6 | 106 ± 10 | 191 ± 7 | 22 ± 7 | 25 ± 7 | 103 ± 9 | 192 ± 10 | ||
| 3 | 97 ± 9 | 186 ± 4 | 104 ± 7 | 191 ± 8 | 101 ± 9 | 188 ± 6 | 26 ± 4 | 19 ± 7 | 97 ± 8 | 179 ± 9 | ||
| 4 | 101 ± 11 | 193 ± 7 | 106 ± 4 | 183 ± 9 | 109 ± 6 | 201 ± 2 | 24 ± 8 | 19 ± 5 | 101 ± 7 | 186 ± 7 | ||
| 5 | 93 ± 98 | 176 ± 3 | 98 ± 3 | 179 ± 8 | 107 ± 5 | 194 ± 5 | 26 ± 8 | 21 ± 7 | 100 ± 7 | 190 ± 5 | ||
| *Positive control | 998 ± 43 | 1032 ± 39 | 1037 ± 49 | 1217 ± 33 | 979 ± 31 | 1211 ± 22 | 411 ± 23 | 293 ± 32 | 989 ± 21 | 1315 ± 31 | ||
| (A) | (C) | (B) | (B) | (E) | (D) | (E) | (F) | (G) | (H) | |||
Data are presented as Means ± SD (n = 3); *Positive control: A = 2- AF (100 μg/plate), B = 4-NQO (0.1 μg/mL), C = 2 AA (5 μg/plate), D = 2-AA (2 μg/plate), E = 4NQO (2 μg/mL), F = t-BHP (20 μg/plate), G = AZNa (0.5 μg/plate), H = AZNa (5 μg/plate).
4 Conclusions
In this study, three solvents (deionized water, methanol, and ethanol) were used to extract Pangdahai and obtain PP. The extraction rates ranged from 19 to 21 %, with PPM yielding the highest rate. The monosaccharide composition of PP was primarily dominated by Rha, Ara, and Gal (all in the range of 28.7 %–32.0 %), while the Glu content was relatively low (1.90 %–4.90 %). PPM exhibited optimal performance when evaluating antioxidant capacity, especially ABTS radical scavenging ability (EC50 of 1.97 μg/mL), similar to Trolox. PPM also demonstrated satisfactory anti-inflammatory activity at doses ranging from 62.5 μg/mL to 250 μg/mL, with over 50 % inhibition of NO production, followed by PPW and PPE. Notably, this study confirmed that the PPs obtained from the three extraction methods were neither toxic nor mutagenic to S. typhimurium strains TA98, TA100, TA102, TA1535, and TA1537. Therefore, further investigation of the structure–activity relationships of PP is crucial to gain a more profound understanding of the exact mechanisms governing its biological activities, which can be instrumental for future applications. The results of this study may be of interest in exploring the potential of PP as a viable resource and offering valuable insights into its potential applications as a natural antioxidant.
CRediT authorship contribution statement
Ping-Hsiu Huang: Methodology, Resources, Supervision, Visualization, Writing – original draft. Chien-Shan Chiu: Data curation, Funding acquisition, Resources. Wen-Chien Lu: Conceptualization, Data curation, Formal analysis, Investigation, Methodology. Chang-Wei Hsieh: Investigation, Methodology. Zeng-Chin Liang: Data curation, Formal analysis, Methodology, Project administration. Li-Ling Fan: Conceptualization, Data curation, Formal analysis, Investigation, Methodology, Resources, Software. Chiun-Chung R. Wang: Conceptualization, Data curation, Formal analysis, Funding acquisition, Investigation, Methodology, Project administration, Resources. Po-Hsien Li: Conceptualization, Data curation, Formal analysis, Funding acquisition, Investigation, Methodology, Project administration, Resources, Software, Supervision, Validation, Visualization, Writing – original draft, Writing – review & editing.
Acknowledgments
This research was financially supported by Taichung Veterans General Hospital and by Rong Sing Medical Foundation, Taiwan.
Declaration of competing interest
The authors declare that they have no known competing financial interests or personal relationships that could have appeared to influence the work reported in this paper.
References
- Extraction, partial characterization and bioactivity of polysaccharides from boat-fruited sterculia seeds. Int. J. Biol. Macromol.. 2012;51(5):815-818.
- [CrossRef] [Google Scholar]
- AOAC. (2023). Official Methods of Analysis of AOAC INTERNATIONAL. Oxford University Press. 10.1093/9780197610145.001.0001.
- Characterization and antibacterial properties of fish skin gelatin/guava leaf extract bio-composited films incorporated with catechin. LWT. 2023;178:114568
- [CrossRef] [Google Scholar]
- Machine learning – Predicting Ames mutagenicity of small molecules. J. Mol. Graph. Model.. 2021;109:108011
- [CrossRef] [Google Scholar]
- Optimisation of the extraction of crude polysaccharides from Clinacanthus nutans leaves for antioxidant applications: Content analysis, chemometrics and metabolomics analysis. Ind. Crop. Prod.. 2023;202:117086
- [CrossRef] [Google Scholar]
- Hoenerhoff, M. J., Boyle, M., Minocherhomji, S., & Pandiri, A. R. (2022). Chapter 8 - Carcinogenesis: mechanisms and evaluation. In W. M. Haschek, C. G. Rousseaux, M. A. Wallig, & B. Bolon (Eds.), Haschek and Rousseaux's Handbook of Toxicologic Pathology (Fourth Edition) (pp. 205-254). Academic Press. 10.1016/B978-0-12-821044-4.00013-3.
- Antioxidant activity and emulsion-stabilizing effect of pectic enzyme treated pectin in soy protein isolate-stabilized oil/water emulsion. J. Agric. Food Chem.. 2011;59(17):9623-9628.
- [CrossRef] [Google Scholar]
- The uptake of oligogalacturonide and its effect on growth inhibition, lactate dehydrogenase activity and galactin-3 release of human cancer cells. Food Chem.. 2012;132(4):1987-1995.
- [CrossRef] [Google Scholar]
- Effect of heat treatment on nutritional and chromatic properties of mung bean (Vigna radiata L.) Agronomy. 2022;12(6):1365.
- [CrossRef] [Google Scholar]
- Preparation and efficacy assessment of malva nut polysaccharide for skin hydrating products. Ann. Pharm. Fr.. 2017;75(6):436-445.
- [CrossRef] [Google Scholar]
- Product development of fish tofu supplemented with Malva nut gum. Int. J. Agric. Technol.. 2022;18(5):2057-2070.
- [Google Scholar]
- Recommended criteria for the evaluation of bacterial mutagenicity data (Ames test) Mutation Res./Genet. Toxicol. Environ. Mutagenesis. 2019;848:403074
- [CrossRef] [Google Scholar]
- Extraction and characterization of collagen from sea cucumber (Holothuria cinerascens) and its potential application in moisturizing cosmetics. Aquaculture. 2020;515:734590
- [CrossRef] [Google Scholar]
- Bioresource utilization of Djulis (Chenopodium formosanum) biomass as natural antioxidants. Sustainability. 2020;12(15):5926.
- [CrossRef] [Google Scholar]
- Evaluation of antioxidant activity of the polysaccharides extracted from Lycium barbarum fruits in vitro. Eur. Polym. J.. 2007;43(2):488-497.
- [CrossRef] [Google Scholar]
- Li, C. (2015). Sterculia lychnophora Hance 胖大海 (Pangdahai, Malva Nut Tree). In Y. Liu, Z. Wang, & J. Zhang (Eds.), Dietary Chinese Herbs: Chemistry, Pharmacology and Clinical Evidence (pp. 535-542). Springer Vienna. 10.1007/978-3-211-99448-1_61.
- Vibrational spectroscopy-based chemometrics analysis of Clinacanthus nutans extracts after postharvest processing and extract effects on cardiac C-kit cells. Evid. Based Complement. Alternat. Med.. 2022;2022:1967593.
- [CrossRef] [Google Scholar]
- Lim, T. K. (2012). Scaphium macropodum. In T. K. Lim (Ed.), Edible Medicinal And Non Medicinal Plants: Volume 3, Fruits (pp. 189-191). Springer Netherlands. 10.1007/978-94-007-2534-8_25.
- Activation of NLRP3 inflammasome in RAW 264.7 cells by polysaccharides extracted from Grateloupia livida (Harv.) Yamada. Int. Immunopharmacol.. 2020;85:106630
- [CrossRef] [Google Scholar]
- Immunomodulatory effects of the polysaccharide from Sinonovacula constricta on RAW264.7 macrophage cells. Food Sci. Nutr.. 2022;10(4):1093-1102.
- [CrossRef] [Google Scholar]
- Bioactive compounds in malanto (Kalimeris Indica) leaves and their antioxidant characteristics. Agriculture. 2023;13(1):211.
- [CrossRef] [Google Scholar]
- EPR free radical scavenging activity on superoxide, hydroxyl and tert–butyl hydroperoxide radicals by common hydrophilic antioxidants: effect of mixing and influence of glucose and citric acid. Eur. Food Res. Technol.. 2021;247(9):2253-2265.
- [CrossRef] [Google Scholar]
- Study on the anti-hyperuricemic bioactivity and chemical components of Sterculiae lychnophorae Semen. J. Funct. Foods. 2022;95:105173
- [CrossRef] [Google Scholar]
- Structural characterization and in vitro hepatoprotective activity of a novel antioxidant polysaccharide from fruiting bodies of the mushroom Pleurotus ferulae. Int. J. Biol. Macromol.. 2023;243:125124
- [CrossRef] [Google Scholar]
- Recent advances in the extraction and characterization of seed polysaccharides, and their bioactivities: A review. Bioact. Carbohydr. Diet. Fibre. 2021;26:100276
- [CrossRef] [Google Scholar]
- Total carbohydrate by phenol-sulfuric acid method. In: Nielsen S.S., ed. Food Analysis Laboratory Manual. Springer International Publishing; 2017. p. :137-141.
- [CrossRef] [Google Scholar]
- Ethnopharmacology, phytochemistry, and pharmacology of Sterculia lychnophora Hance (Pangdahai) Chin. J. Nat. Med.. 2018;16(10):721-731.
- [CrossRef] [Google Scholar]
- Panchal, M., Pawar, V., Mhatre, M., Ingole, S., Polaka, S., Tekade, M., Rajpoot, K., & Tekade, R. K. (2023). Chapter 24 - Cells and tissue-based models as a rational substitute in toxicity testing. In R. Tekade (Ed.), Essentials of Pharmatoxicology in Drug Research (Vol. 1, pp. 625-672). Academic Press. 10.1016/B978-0-443-15840-7.00018-X.
- Structural and chemical insights into the prebiotic property of hemicellulosic polysaccharide from Santalum album L. Carbohydr. Polym.. 2023;321:121291
- [CrossRef] [Google Scholar]
- Ames test (bacterial reverse mutation test): why, when, and how to use. In: Sierra L.M., Gaivão I., eds. Genotoxicity and DNA Repair: A Practical Approach. New York: Springer; 2014. p. :3-22.
- [CrossRef] [Google Scholar]
- Clinical outcome of malva nut drink in type 2 diabetic patients. FASEB J.. 2007;21(5):A696-A.
- [CrossRef] [Google Scholar]
- In vitro antioxidant and free radical scavenging activity of different parts of Tabebuia pallida growing in Bangladesh. BMC. Res. Notes. 2015;8(1):621.
- [CrossRef] [Google Scholar]
- Soejarto, D., Sydara, K., Elkington, B., Douangdeuane, B., Souliya, O., & Xayvue, M. (2023). Conservation of medicinal plants of Laos. In (pp. 55-84). 10.1201/9781003216636-4.
- Malva nut gum. (Part I): Extraction and physicochemical characterization. Carbohydr. Polym.. 2006;64(2):247-253.
- [CrossRef] [Google Scholar]
- Textural and sensory quality of poultry meat batter containing malva nut gum, salt and phosphate. LWT Food Sci. Technol.. 2007;40(3):498-505.
- [CrossRef] [Google Scholar]
- Physical quality and in vitro starch digestibility of bread as affected by addition of extracted malva nut gum. LWT Food Sci. Technol.. 2014;59(1):486-494.
- [CrossRef] [Google Scholar]
- Effect of extracted malva nut gum on reducing high glucose levels by Caco-2 cells. Food Biosci.. 2018;21:107-116.
- [CrossRef] [Google Scholar]
- Rheological properties of extracted malva nut gum (Scaphium scaphigerum) in different conditions of solvent. Food Hydrocoll.. 2011;25(3):444-450.
- [CrossRef] [Google Scholar]
- Nutritional evaluation of functional biscuits supplemented with Malva nuts(Sterculia Lychnophora) Int. J. Scient. Res. Manage.. 2022;10(3):64-81.
- [CrossRef] [Google Scholar]
- Antioxidant and protective effects of the polyphenolic glycoconjugate from Agrimonia eupatoria L. Herb in the prevention of inflammation in human cells. Journal of Functional. Biomaterials. 2023;14(4):182.
- [CrossRef] [Google Scholar]
- Vijay, U., Gupta, S., Mathur, P., Suravajhala, P., & Bhatnagar, P. (2018). Microbial Mutagenicity Assay: Ames Test. Bio-protocol, 8(6), e2763. 10.21769/BioProtoc.2763.
- Antioxidant and antibacterial activity of seven predominant terpenoids. Int. J. Food Prop.. 2019;22(1):230-238.
- [CrossRef] [Google Scholar]
- Anti-inflammatory activity of 3-cinnamoyltribuloside and its metabolomic analysis in LPS-activated RAW 264.7 cells. BMC Complement. Med. Ther.. 2020;20(1):329.
- [CrossRef] [Google Scholar]
- Comparison of determination of sugar-PMP derivatives by two different stationary phases and two HPLC detectors: C18 vs. amide columns and DAD vs. ELSD. J. Food Compos. Anal.. 2021;96:103715
- [CrossRef] [Google Scholar]
- Two cerebrosides Isolated from the seeds of Sterculia lychnophora and their neuroprotective effect. Molecules. 2013;18(1):1181-1187.
- [CrossRef] [Google Scholar]
- The Lowry method for protein quantitation. In: Walker J.M., ed. The Protein Protocols Handbook. Humana Press; 2009. p. :7-10.
- [CrossRef] [Google Scholar]
- Optimization of extraction process of crude polysaccharides from boat-fruited sterculia seeds by response surface methodology. Food Chem.. 2007;105(4):1599-1605.
- [CrossRef] [Google Scholar]
- Preparation, partial characterization and bioactivity of water-soluble polysaccharides from boat-fruited sterculia seeds. Carbohydr. Polym.. 2007;70(4):437-443.
- [CrossRef] [Google Scholar]
- Biological activity of Brassica rapa L. polysaccharides on RAW264.7 macrophages and on tumor cells. Bioorg. Med. Chem.. 2020;28(7):115330
- [CrossRef] [Google Scholar]
- Characterization of sea buckthorn polysaccharides and the analysis of its regulatory effect on the gut microbiota imbalance induced by cefixime in mice. J. Funct. Foods. 2023;104:105511
- [CrossRef] [Google Scholar]
- X-ray-based machine vision technique for detection of internal defects of sterculia seeds. J. Food Sci.. 2022;87(8):3386-3395.
- [CrossRef] [Google Scholar]
- Composition analysis and inhibitory effect of Sterculia lychnophora against biofilm formation by Streptococcus mutans. Evid. Based Complement. Alternat. Med.. 2016;2016:8163150.
- [CrossRef] [Google Scholar]
- Sulfated modification, basic characterization, antioxidant and anticoagulant potentials of polysaccharide from Sagittaria trifolia. Arab. J. Chem.. 2023;16(7):104812
- [CrossRef] [Google Scholar]
Appendix
| Content (%) | |||||
|---|---|---|---|---|---|
| Dried boat-fruited Sterculia lychnophora Hance ripped seeds (pangdahai, malva nut, đười ươi, lười ươi, samrong or samrung) powder | Crude fat | Crude fiber | Crude protein | Ash | Carbohydrate* |
| 5.28 ± 0.52 | 3.61 ± 0.55 | 4.11 ± 0.09 | 1.99 ± 0.17 | 84.9 ± 0.21 | |
*Carbohydrate = 100 % − (Crude protein + Crude fat + Crude fiber + Ash).
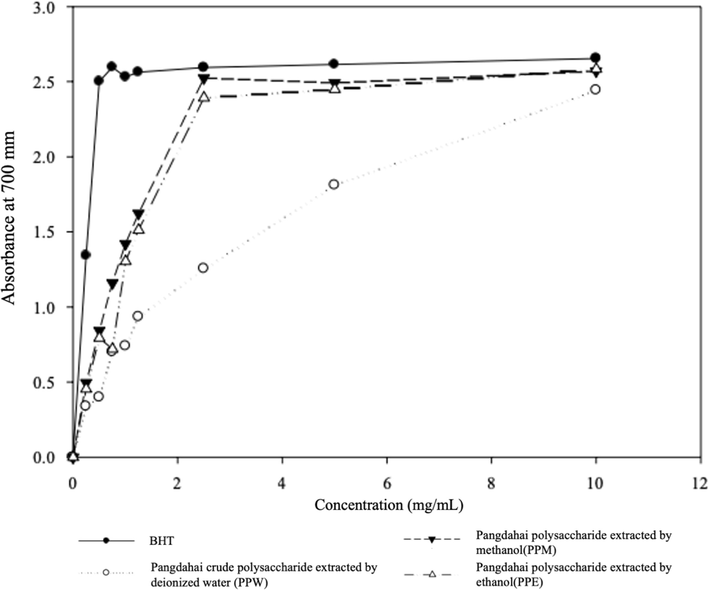
- Effects of three solvents (deionized water, methanol, and ethanol) extracted pangdahai polysaccharide (PP) on reducing power.


