

Applicable pharmacokinetic study: Development and validation of bioanalytical LC-MS/MS method for the simultaneous quantification of cytarabine and glasdegib used for the treatment of acute myeloid leukemia
⁎Corresponding author. mhefnawy@ksu.edu.sa (Mohamed Hefnawy)
-
Received: ,
Accepted: ,
This article was originally published by Elsevier and was migrated to Scientific Scholar after the change of Publisher.
Peer review under responsibility of King Saud University. Production and hosting by Elsevier.
Abstract
Acute myeloid leukemia (AML) is characteristic by high concentrations of immature bone marrow myeloid cells. Glasdegib (DaurismoTM, GSB) in combination with low dose cytarabin (DepocytTM, CTB) have recently been approved by the US Food and Drug Administration for the treatment of newly diagnosed AML in patients over 75 years of age or who have comorbidities that are prohibitive to intensive induction chemotherapy. However, the pharmacokinetic characteristics of the CTB and GSB is yet unknown. This study developed a selective, sensitive and fast analytical method using liquid chromatography-electrospray ionization (ESI) with tandem mass spectrometry (LC-MS/MS) to simultaneously quantify of CTB and GSB in rat plasma using duvelisib as internal standard (IS). The LC-MS/MS instrument was performed in the ESI interface operating at positive ionization and multiple reaction monitoring (MRM) mode. The CTB and GSB with the IS were extracted from rat plasma by using cation exchange solid-phase extraction cartridge before the analysis. The cartridge gave high recovery rates for both drugs without interference from plasma endogenous. Chromatographic separation was performed on reversed-phase polar-100 column (100 mm × 2.1 mm, 3 µm), with an isocratic mobile phase consisted of a mixture of water containing 0.1% formic acid and acetonitrile (85:15, v/v, pH 3.2) at a flow rate of 0.4 mL/min and the process of analysis was run for 3.5 min. The developed method was validated as per the FDA guidelines over a linear concentration range of 5–3000, for both CTB and GSB with high correlation coefficient (r2 ≥ 0.99). The lower limits of detection (LLOD) were 2.0 ng/mL for both drugs. The overall recoveries of CTB and GSB from rat plasma were in the range of 93.93–101.43%, and the mean relative standard deviation (RSD) of the results was 2.99%. The validated-method was successfully applied for the first time, to a pharmacokinetic study on concurrent oral administration of CTB and GSB in rats (12.0 mg/kg of CTB and 8.5 mg/kg of GSB). The maximum plasma concentration (Cmax) for CTB and GSB was 2312.23 ± 448.26 ng/mL and 1710.61 ± 166.04 ng/mL achieved at 2.83 ± 0.14 h and 2.39 ± 0.10 h, respectively. The AUC0-∞ for CTB and GSB was found to be 8592.49 ± 1714.12 and 4527.67 ± 390.01 ng/mL.h; respectively. The elimination half-life (t1/2kel) of CTB and GSB in rat plasma, were determined to be 2.00 ± 0.19 h and 1.58 ± 0.13 h, respectively. The newly developed approach stands out for its high extraction recovery and absence of matrix interference. Findings further demonstrated the high sensitivity of the developed method, which allowed for effective routine tests in pharmacokinetic investigations with LLOD of 2.0 ng/mL and a run time of 3.5 min.
Keywords
LC–MS/MS
Acute myeloid leukemia
Cytarabine
Glasdegib
Pharmacokinetics rat plasma

1 Introduction
Acute myeloid leukemia (AML) is clinically and genetically heterogeneous myeloid stem cell disorders with a median age at onset of about 65 years (Klepin et al., 2014). Due to comorbidities and a higher prevalence of high-risk biological characteristics, which frequently result in chemotherapy resistance, older patients with AML have few treatment options and frequently are not eligible for intense chemotherapy. Therefore, novel therapeutic strategies are needed to achieve more durable responses, higher response rates, and improved survival. Hedgehog signaling is essential for embryonic development but is normally inactive in adults (Ok et al., 2012). Hematologic cancers have been linked to aberrant Hedgehog signaling, which is essential for leukemia stem cell survival and growth (Heidel et al., 2015; Irvine et al., 2012; Wellbrock et al., 2015). Chemotherapy-resistant myeloid leukemia cells were shown to overexpress components of the Hedgehog system, and pharmacological inhibition of the Hedgehog pathway significantly increased the sensitivity to chemotherapy (Queiroz et al., 2010). These findings provide the rationale for combining an inhibitor of Hedgehog pathway with chemotherapy. GSB is a novel, potent and selective oral inhibitor of Hedgehog signaling through binding to Smoothened. As a single agent or in conjunction with chemotherapy, GSB generated rapid and full tumor regression, lower expression of important leukemia stem-cell regulators, and decreased leukemia stem-cell populations in patient-derived AML cells (Fukushima et al., 2016; Sadarangani et al., 2015). Leukemia cell generation is slowed with low-dose cytarabine (LDAC), which also encourages the bone marrow to create more normal, healthy cells. Therefore, on November 21, 2018, the FDA approved GSB (Daurismo, Pfizer Labs) in combination with LDAC, for newly-diagnosed AML in patients who are 65 years old or older or who have comorbidities that preclude intensive induction chemotherapy (US-FDA Approves, 2018).
Few mass spectrometry-based methods, including liquid chromatography with tandem mass spectrometry (LC-MS/MS) have been published for the quantification of CTB (Büttner et al., 2016; Hilhorst et al., 2011; Sun et al., 2008; Wang et al., 2020; Wang et al., 2016) and GSB (Shaik et al., 2019) individually. Analytical methods for determination of both drugs, have not yet been reported. This work was aimed at the development of a rapid and sensitive analytical method for simultaneous determination of GSB and CTB in rat plasma using LC–MS/MS with the application to pharmacokinetic study. In this study rats received 12.0 mg/kg of cytarabine and 8.5 mg/kg of glasdegib. The goal was to develop a method for high sample throughput, thus we aimed at an analysis time of less than 3.5 min. The new developed validated method has a wide linear range, lower sensitivity (0.2 ng/mL) and employs a lower plasma volume (50.0 µL) for processing than other bioanalytical methods (Shaik et al., 2019; Sun et al., 2008; Sun et al., 2008; Wang et al., 2020). As far as we know, this newly developed approach is the first study applied with desired accuracy and precision for monitoring the pharmacokinetic behavior of GSB and CTB in rats and parameters such as, Cmax, Tmax, t1/2, AUC0–24, and AUC0–∞ were evaluated.
2 Experimental
2.1 Chemicals and reagents
Reference standards of CTB (99.0%), GSB (99.0%) and duvelisib (DVS, internal standard, IS, 98.7%) were purchased from Med Chem Express (USA). HPLC-grade methanol, acetonitrile and formic acid (HCOOH) were procured from Sigma-Aldrich (NJ, USA). HPLC-grade water was obtained from an in-house Milli-Q plus purification system procured from the Millipore Company (Millipore, USA). Rat plasma devoid of drugs was purchased from the Animal Care Center (College of Pharmacy, King Saud University, Saudi Arabia).
2.2 LC-MS/MS conditions
Chromatographic separation was performed using a Waters® Acquity UPLC with model code (UPH) and serial number (H10UPH), and mass analysis of peaks from eluted analytes was performed using a Waters® Acquity TQD MS with model code (TQD) and serial number (QBB1203) (Waters Corp., Milford, MA, USA). The electrospray ionization (ESI), operated in positive mode, was used for ionization processing, and multiple reaction monitoring (MRM) was used for identification and quantification of analytes. The system was operated with the MassLynx program (Waters corporation, Milford, MA 01757, USA), and the data acquisition used the TargetLynxTM software. CTB, GSB and DVS (IS) were separated on a reversed phase polar-100 column (100 mm × 2.1 mm, 3 µm; Sepax Technologies, Inc., Newark, DE 19711, USA) in isocratic mode. The mobile phase consisted of a mixture of water containing 0.1% formic acid and acetonitrile (85:15, v/v, pH 3.2) at a flow rate of 0.4 mL/min. 25 °C room temperature was maintained for the autosampler and column. The overall run time was 3.5 min, and the injection volume was 5.0 µL. The solvents were filtered through membrane filters (0.22 µm) obtained from Chrom Tech (Kent, UK). After each injection, cleaning the needle with a methanol and water mixture (80:20). Triple quadrupole mass analyzer (TQD MS) mass spectrometry parameters were tuned to provide good separation of CTB, GSB, and IS with good sensitivity. To improve chromatographic peak properties including signal intensity and selectivity, IntelliStart® software's tuning parameters for CTB, GSB, and IS were manually readjusted in combined mode (fluidics and LC). Nitrogen (650 L/H) was used as drying gas at 350 °C. The cone gas flow rate was kept at 100L/H. Argon (0.14 mL/min) was used as a collision gas inside the fragmentation cell. The cone voltages for CTB, GSB and DVS were set as 12 (V), 18 (V) and 30 (V), respectively. Extractor voltage, capillary voltage, and RF lens were set at 3.0 (V), 4 (kV), and 0.1 (V), respectively. To eliminate interference from rat plasma endogenous components and to improve the selectivity and sensitivity of the developed method, CTB, GSB, and IS were detected using a multiple reaction monitoring (MRM) mass analyzer in positive ion mode (Al-Shehri et al., 2020; Hefnawy et al., 2023).
2.3 Preparation of stock, standard, calibrators and quality control samples
Dimethyl sulfoxide (DMSO) was used to prepare primary stock solutions of CTB, GSB, and IS. These solutions were each prepared individually and stored at −20 °C. Additionally, successive working solutions of CTB and GSB at concentrations of 0.05, 0.5, 5 and 20 µg/mL were obtained by dilution with ultrapure water. A working solution of IS was prepared in ultrapure water at concentration 10 µg/mL. Calibrators at concentrations of 5, 10, 15, 50, 100, 200, 400, 500, 1000, 2000, 2600 and 3000 ng/mL for CTB and GSB was prepared in blank rat plasma from the intermediate solutions. Different quality control samples at 5 ng/mL for the LLOQ, 15 ng/mL for the QC sample at low concentration, 1500 ng/mL for the QC sample at mid concentration and 2500 ng/mL for the QC sample at high concentration were prepared by spiking appropriate volume of the intermediate solutions with blank rat plasma. The calibration curves for each drug were obtained by treating the peak area ratios of each drug to IS. As an alternative, the appropriate regression equation was created.
2.4 Sample preparation
To a 50 µL aliquot of plasma sample, 20 µL of IS solution (10 µg/mL) in 2.0 mL disposable polypropylene micro centrifuge tubes. Each tube was diluted to 750 µL with ultrapure water and vortex for 30 s. A cation exchange solid-phase extraction cartridges (Waters) were attached to a vacuum manifold (VacElute, Harbor City, CA, USA) and conditioned with 2 × 500 µL of methanol and 2 × 500 µL of deionized water. Caution was taken to make sure that the cartridges did not dry out. The blank and plasma sample was loaded into the cartridges and a vacuum was applied to gain a flow rate of 0.5 mL/min. The cartridges were washed with 2 × 500 µL of deionized water. The cartridges were dried under a vacuum for 3 min (15 psi). CTB and GSB were eluted with 2 × 100 µL of ammonium hydroxide in methanol (5:95, v/v). The eluates were evaporated to dryness under nitrogen at 37 0C and then reconstituted in 2 × 100 µL of water by vortex mixing (1 min). The resulting solution was transferred to an autosampler vials and 5 µL was injected into the LC–MS/MS system.
2.5 Pre-study validation
The proposed LC-MS/MS method was fully validated, guided by the US-FDA guidelines for the validation of bioanalytical methods (US-FDA Guidelines, 2018). The studied validation parameters in the rat plasma involved determining method selectivity, precision and accuracy, linearity and range, extraction recovery, dilution integrity, carry-over, matrix effect and stability. By estimating the interference from endogenous components at the retention times of CTB, GSB, and IS in blank rat plasma from six different lots, method selectivity was carried out. The response less than 20% of the LLOQ for CTB, GSB and less than 5% of the IS were accepted (US-FDA Guidelines, 2018).
Plotting the active response for each linearity solution against its corresponding theoretical values allowed to assess the calibration curves in rat plasma. The concentrations used for CTB and GSB were 5, 10, 15, 50, 100, 200, 400, 500, 1000, 2000, 2600 and 3000 ng/mL. We calculated the calibration curve equations (y = mx + b) using the statistical least squares approach. The coefficient of determination (r2) value, which demonstrated linearity in the range of 5 to 3000 ng/mL, was used to confirm the linear fit. The deviation of non-zero calibrators should be ± 15% of the nominal values except at LLOQ where the calibrators should be ± 20% of the nominal concentrations (US-FDA Guidelines, 2018).
Analysis of a calibration curve (in triplicate), spiked plasma samples at the lower limit (LLOQ), and three different QC levels (LQC, MQC, and HQC, respectively) in six fold on three different days were used to evaluate intra-day and inter-day accuracy and precision. The examined levels were 5 ng/mL (LLOQ), 15 ng/mL (LQC), 1500.0 ng/mL (MQC) and 2500.0 ng/mL (HQC) for CTB and GSB. The relative standard deviation (RSD) must meet the LLOQ's acceptance requirements and should be less than 20%. For all other concentrations the RSD has to be less than 15%.
In order to make sure that there is no effect of carry-over of the developed method on the accuracy of the study samples, carry-over was examined by injecting a blank sample without IS after injection of the HLOQ containing the two drugs and IS. This procedure was carried out six times. The detected response should be less than 20% of the LLOQ of each drug and less than 5% of the IS.
Recovery was calculated for CTB and GSB by comparing replies of extracted plasma at three levels (15, 1500, and 2500 ng/mL) with those achieved by direct injection of the same concentration of CTB and GSB in the water in triplicate. The mean percentage recoveries (n = 6) for both drugs were assessed. Moreover, the extraction recovery of the IS at the same concentration level of the method was calculated.
The concentration of the CTB and GSB in the blank rat plasma above the ULOQ of the calibration standard was assessed to evaluate the dilution integrity of the method. The samples were diluted to be in the range of the calibration curve. After pre-treatment (Section 2.4), it was detected by LC–MS/MS.
It is necessary to estimate the matrix factor (MF) between different batches of sample matrices during method validation. IS normalized MF is the ratio of the MF of the analytes to the MF of IS had to be within 15% of RSD. The matrix effects were calculated by comparing at least three replicates of LLOQ and HCQ of CTB and GSB samples prepared from six-individual rat blank plasma collected from rats with nominal values. The accuracy (%) should be within ± 15 % of the nominal concentration and precision (% RSD) should not be greater than 15% (US-FDA Guidelines, 2018).
The stability of CTB and GSB in plasma was calculated by analyzing the QC samples at LQC, MQC, and HQC under short term stability at room temperature for 24 h, long-term stability for 30 days at − 80 °C, and freeze–thaw treatment (3 cycles, −80 °C). The stability of CTB and GSB in extracted rat plasma stored in the autosampler for 24 h at 10 °C was also determined. All sample accuracies should be ± 15% to be considered as stable.
2.6 Pharmacokinetic study
In order to evaluate the ability of the developed method to measure CTB and GSB concentration in vivo samples, a pharmacokinetic (PK) study was conducted in six Wistar healthy male rats (220–250 g).). All experimental procedures were reviewed in accordance with the guidelines of King Saud University Institutional Research Ethics Committee (REC) with an ethics reference number (SE-19–109). Rats were fasted for 12 h before the experiment, while water was allowed ad libitum. On the day of the experiments, rats were treated with a single oral dose of cytarabine (12 mg/kg) and glasdegib (8.5 mg/kg) dissolved in 1% DMSO/saline (Nair et al., 2016). Blood samples (300 µL) were collected into tubes containing ethylenediamine tetra-acetic acid dipotassium (EDTA K2) (anticoagulant) at the following time points: zero (before administration), 0.15, 0.5, 1, 2, 4, 6, 8, 12, 18 and 24 h. The samples were directly centrifuged at 3500 rpm for 10 min at 4 °C. The plasma obtained was stored at − 80 °C until analysis. The same method of extraction described under calibration standards preparation (2.4.) was used for sample preparation. The PK parameters were calculated by fitting the data to a noncompartmental analysis (NCA) model with PK Solver Add-In software (Zhang et al., 2010).
2.7 Statistical analysis
Statistical analysis for assessing the performance of the developed LC-MS-MS method in terms of linearity and range, precision and accuracy, extraction recovery, carry-over, dilution integrity, matrix effect and stability was conducted according to the FDA guidelines (US-FDA Guidelines, 2018). Results was reported as mean ± SD of at least six independent experiments. Comparisons between the control group and the treated group was performed by One-way Analysis of Variance (ANOVA). Results with a p value less than 0.05 will be considered statistically significant. The pharmacokinetic parameters such as Cmax, Tmax, t1/2kel, AUC0–24, and AUC0–∞ was calculated by fitting the data to a non-compartmental analysis (NCA) model with PK Solver Add-In software (Zhang et al., 2010).
3 Results and discussion
3.1 Optimization of chromatographic conditions and MS detections
Positive ionization mode produces potent mass responses for cytarabine, glasdegib, and IS. The product spectrum of the [M + H]+ ion of CTB is highly depended on the CE. At lower CE (12–15 eV), a major fragment ion was at m/z 69. At high CE (38 eV), a major fragment ion at m/z 111.9 was formed (Fig. 1 and Table 1). The transition of m/z 244–111.9 gave a considerably better response and a higher signal-to-noise ratio than that of m/z 244–69. As a result, the transition of m/z 244–111.9 at CE 38 eV was selected for use in MRM. In a similar fashion, m/z 375.1–96 with CE of 22 eV for GSB and m/z 417–135.9 with CE of 28 eV for IS were selected for the MRM analysis.
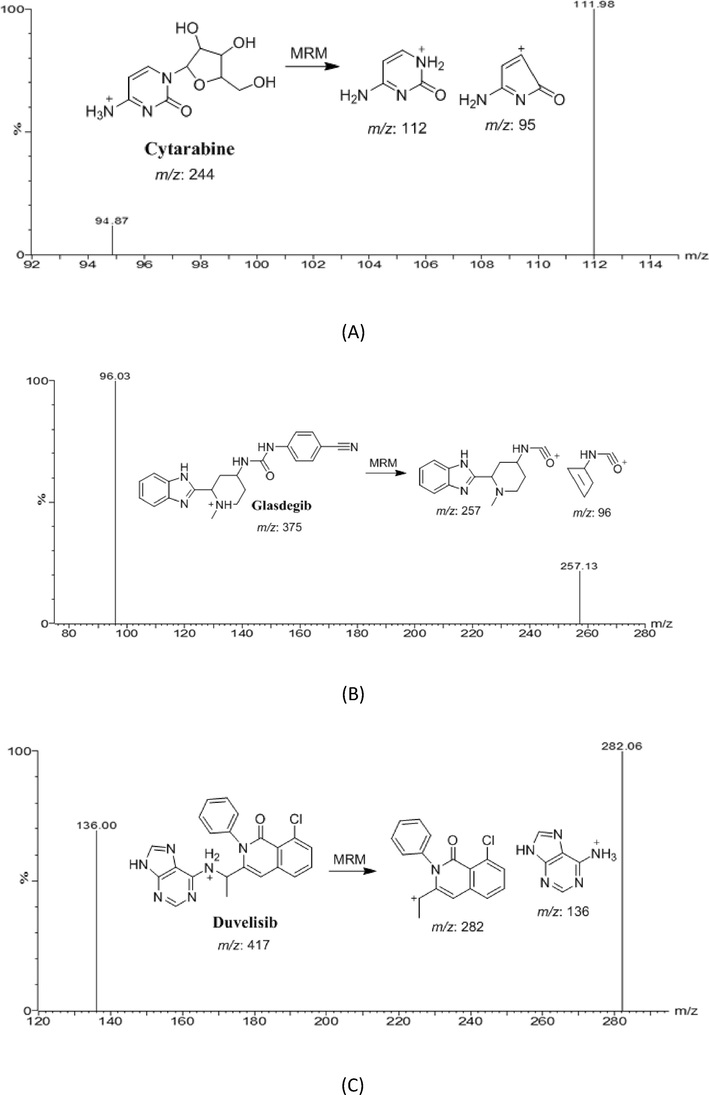
- Multiple reaction monitoring (MRM) mass spectra and the expected fragmentation pathway of cytarabine, (A), glasdegib (B), and duvelisib (C) (IS).
| Drug | Retention time (min) | Ion mode | Precursor (m/z) | Quantification trace (m/z) | Qualification trace (m/z) | Cone Voltage (V) | Collision energy (CE, eV |
|---|---|---|---|---|---|---|---|
| DCB | 0.98 | +ve | 229.03 | 113.03 | 98.94 | 8 | 10/22 |
| VTX | 2.44 | +ve | 868.28 | 177.05 | 321.13 | 50 | 38/44 |
| ENF (IS) | 1.48 | +ve | 540.10 | 359.10 | 116.00 | 54 | 46/44 |
Chromatographic conditions such as the stationary phases and its types, nature of mobile phase and its composition, were adjusted through many trials in order to obtain the best separation and the highest signal for CTB and GSB and IS. Several mobile phase compositions of ammonium acetate buffer, ammonium format buffer, 0.1% formic acid, 0.1% acetic acid and 0.1% trifluoracetic acid in water, with either acetonitrile or methanol were tested in an isocratic mode regarding peak shape, peak area, response, analysis time. Higher pH values caused peak tailing and prolonged elution times, so the 0.1% formic acid solution in the aqueous mobile phase had its pH reduced to 3.2. Also, the effects of a chosen mobile phase with various methanol or acetonitrile percentages (10–90%) and water each mixed with 0.1% formic acid were studied (Hefnawy et al., 2020; Hefnawy and Attwa, 2023). The separation and retention times of CTB, GSB, and IS were significantly influenced by the percentage of acetonitrile in the mobile phase. Long running times were observed by a decreasing acetonitrile percentage, while overlapping peaks and poor separation were caused by an increasing percentage of acetonitrile. With an improved signal-to-noise ratio, the optimized mobile phase of 0.1% formic acid in water (85%) and 15% acetonitrile was found to be appropriate for the chromatographic separation of the analytes at a flow rate of 0.4 mL/min. For chromatographic separation, various stationary phases, both polar and non-polar, were tested using various column packs, with different dimensions including cyano-, phenyl-, octyl (C8), and octadecyl (C18). A reversed-phase C18 (150 mm × 0.46 cm, 5 µm, Diamosil, DIKMA) was even tried to separate CTB, GSB and IS under the chosen mobile phase. However, CTB was not retainable, as reported by other studies (Hsieh et al., 2007). A satisfactory resolution between CTB, GSB and IS were achieved using polar-100 column (100 mm × 2.1 mm, 3 µm; Sepax Technologies, Inc., Newark, DE 19711, USA).
As well as, we investigate the use of different internal standards, such as binimetinib, sulpride encorafenib, repaglinide, nateglinide, pemigatinib and chloroquine, however, these internal standards either produced poor peaks or lead to overlapping with CTB and GSB. Duvelisib was chosen as the method's IS because it is chemically comparable to CTB and GSB and has similar extraction recovery and performance properties.
In the current study, the SPE method was a useful extraction procedure related to protein precipitation that has been reported in the previous studies (Hilhorst et al., 2011; Shaik et al., 2019), where it provided less solvent consumption, less time-consuming, low background noise and high recoveries of the CTB, GSB and IS from rat plasma. For plasma sample cleanup, six different SPE cartridges including Water oasis HLB, C18, C8, C2, CN and strong cation exchange (SCX) were investigated. The eluting capabilities of numerous solvents toward CTB, GSB and IS were studied. Of these solvents, only ammonium hydroxide in methanol (5:95, v/v) rather than a mixture of methanol with water or acetonitrile was able to disrupt all types of interactions in the case of CTB, GSB and IS and thus to extract them from the SCX sorbent. High recoveries and clean chromatograms for CTB, GSB and IS were achieved with SCX cartridge. The recoveries ranged from 90.73 to 95.89 and 98.77 to 103.23 for CTB and GSB in the rat plasma, respectively. Chromatographic separation of CTB, GSB, and IS was achieved with good separation over a run time of 3.5 min (Fig. 2).
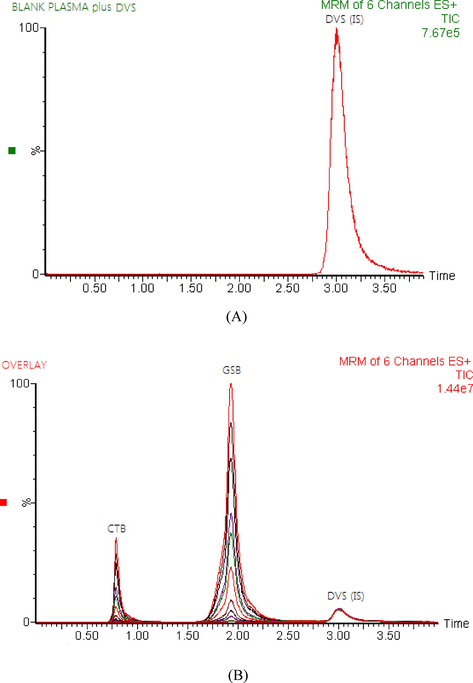
- Representative total ion chromatograms for blank rat plasma spiked with duvelisib (IS) at a concentration of 500.0 ng/mL (A) and overlays of the LC–MS/MS analysis of cytarabine (CTB), glasdegib (GSB) at concentrations of 5–3000 ng/ml, and duvelisib (IS) at a concentration of 500.0 ng/mL (B).
3.2 In-study validation
Following the United States FDA's guidelines for the validation of bioanalytical methods, the proposed LC-MS/MS method was fully validated (US-FDA Guidelines, 2018). Method linearity and range, selectivity, precision and accuracy, carry-over, extraction recovery, matrix effect, dilution integrity and stability were the studied validation parameters in the rat plasma. A linear range of the developed method was recognized over a wide concentration range 5 to 3000 ng/ mL in rat plasma. The linear regression of CTB and GSB achieved during the method validation is listed in Table 2. The regression equations attained by least squared regression for CTB and GSB were; y = 0.0047x + 0.0352, r2 = 0.997, and y = 0.0045x + 0.0209, r2 = 0.998; for CTB and GSB, respectively, where y is the peak area ratio of D/IS and × is the concentration (ng/mL). The results established the linearity and reproducibility of the developed method. The application of the developed assay for the measurement of trace amounts of CTB and GSB in plasma was confirmed by the LLOD of CTB and GSB in rat plasma, which was 2 ng/mL.
| Parameters | DCB | VTX |
|---|---|---|
| Concentration range (ng/mL) | 5–––3000 | 5––1000 |
| Intercept (a) | 7.29 × 10⁻² | 2.88 × 10⁻² |
| Slope (b) | 4.65 × 10⁻³ | 1.55 × 10⁻³ |
| Coefficient of determination (r2) | 0.999 | 0.998 |
| SY/Na | 3.92 × 10⁻³ | 2.94 × 10⁻³ |
| Sa b | 1.30 × 10⁻³ | 1.03 × 10⁻³ |
| Sb c | 1.30 × 10⁻⁴ | 2.64 × 10⁻⁴ |
| LLOQ (ng/mL) | 5.0 | 5.0 |
| LLOD (ng/mL) | 2.0 | 2.0 |
The analysis of blank plasma samples and plasma spiked with lower limit quality control (LLOQ), lower quality control (LQC), middle quality control (MQC), and high quality control (HQC) levels revealed that there were no interferences at the retention times of CTB, GSB, and IS, confirming the method's selectivity. Representative total ion chromatograms of CTB, GSB, and IS in rat plasma are established in Fig. 3. The carry-over in the blank sample, following injection of the upper limit of quantification (ULOQ) of the calibration curve, was less than 20% of LLOQ for CTB and GSB and less than 5% of response for IS (US-FDA Guidelines, 2018).
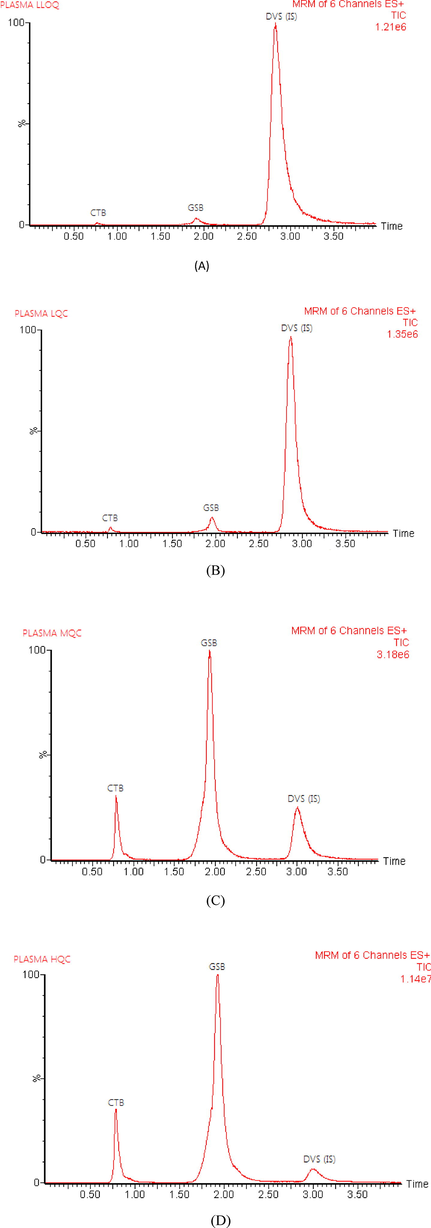
- Representative total ion chromatograms of rat plasma spiked with LLOQ (A), LOQ (B), MQC (C), and HQC (D); for cytarabine (CTB), glasdegib (GSB) and duvelisib (DVS, IS).
To assess the intra- and inter-assay precision and accuracy, six replicates of four concentrations of QC samples (LLOQ, LQC, MQC, and HQC) were used. Table 3 provides an overview of the accuracy and precision findings from CTB and GSB determination. The values for intra-day and inter-day precision and accuracy were 1.19–3.38 % and 93.55–97.95 % for CTB and 0.66–2.72 % and 93.67–101.7 % for GSB, respectively; these values is met the acceptance criteria of the guidelines; LLOQ within 20% and the other QCs within 15% (US-FDA Guidelines, 2018).
| Analyte | Concentration (ng/mL) | Within-run | Between-run | |||
|---|---|---|---|---|---|---|
| Recovery (%) | RSD (%) | Recovery (%) | RSD (%) | |||
| DCB | LLOQ | 5.0 | 94.60 | 6.84 | 93.62 | 5.24 |
| QCL | 15.0 | 90.27 | 5.29 | 91.68 | 4.95 | |
| QCM | 1400.0 | 94.79 | 3.37 | 94.47 | 3.18 | |
| QCH | 2300.0 | 102.78 | 2.23 | 97.46 | 3.75 | |
| VTX | LLOQ | 5.0 | 93.23 | 4.54 | 93.43 | 4.26 |
| QCL | 15.0 | 94.07 | 6.50 | 94.47 | 6.06 | |
| QCM | 500.0 | 95.66 | 4.17 | 95.35 | 2.41 | |
| QCH | 800.0 | 100.60 | 5.22 | 100.67 | 4.46 | |
| n | 6 | 18 | ||||
After SPE sample preparation, CTB and GSB were extracted from the plasma matrix and examined at three QC levels (15, 1500, and 2500 ng/mL) in six duplicates. The mean percent recoveries were 93.93% and 101.43%, respectively. For all of the tested samples shown in Table 4 the mean% recovery of IS was not less than 97.11 ± 2.36.
| Nominal concentration (ng/mL) |
Cytarabine | Glasdegib | IS | ||||
|---|---|---|---|---|---|---|---|
| 15.0 | 1500.0 | 2500.0 | 15.0 | 1500.0 | 2500.0 | 500.0 | |
| Mean a | 13.61 | 1427.11 | 2397.25 | 14.81 | 1548.45 | 2557.25 | 485.53 |
| RSD | 1.51 | 2.94 | 1.35 | 0.79 | 2.99 | 1.42 | 2.36 |
| Recovery (%) | 90.73 | 95.14 | 95.89 | 98.77 | 103.23 | 102.29 | 97.11 |
| Mean recovery (%) | 93.93 | 101.43 | 97.11 | ||||
By dividing the peak area in the presence of matrix components by the peak area in the neat standard solution of the analyte, the matrix factor (MF) for CTB, GSB, and IS was calculated as low and high QC samples. By dividing the MF of the analyte by the MF of the IS, the IS normalized MF is calculated. The six batches of plasma had an RSD of IS-normalized MF that was less than 15%. For LQC and HQC for CTB, it was 1.05 and 0.84, respectively. Also, it was 1.02 and 1.72 for LQC and HQC of GSB, respectively, showing that plasma ion suppression/enhancement was insignificant.
To examine the precision of the developed method after dilution, six replicates of plasma samples spiked with with high concentrations of each drug beyond the linear range were processed and analyzed using dilution factors 2 and 4. The accuracy ranged from 93.38 to 101.30%, and the results were within the method quantitation range for RSD to be between 1.35 and 1.93% (Table 5). This approves the minimal effect of dilution on the outcomes of the developed assay.
| Analyte | Spiked Conc. (ng/ mL) |
Dilution fold | Mean recovery (%) ± RSD a |
|---|---|---|---|
| Cytarabine | 4500.0 | 1:2 | 93.38 ± 1.35 |
| 1:4 | 96.75 ± 1.93 | ||
| Glasdegib | 4500.0 | 1:2 | 101.30 ± 1.84 |
| 1:4 | 97.81 ± 1.49 |
Stability evaluation is a crucial step in the validation of bioanalytical methods. Using the study of three QC samples (LQC, MQC, and HQC) of each drug following the application of the various storage conditions, the stability of CTB and GSB was investigated. Three freeze and thaw cycles following storage at −80 0C, long term stability at −80 0C for 30 days, short term stability at room temperature for 24 h, autosampler stability at 10 0C for 24 h. The stability experiment results met the accuracy requirement of 15% of its theoretical concentration, which was satisfied (US-FDA Guidelines, 2018). Table 6 shows the detailed results.
| Analyte | Concentration (ng/mL) | Short term stability at room temperature (24 h) | Autosampler stability at_10 ⁰C (24 h) | Freeze and thaw stability at_80 ⁰C (3 cycles) | Long term stability at_80 ⁰C (30 days) | |||||
|---|---|---|---|---|---|---|---|---|---|---|
| Recovery (%) | RSD (%) | Recovery (%) | RSD (%) | Recovery (%) | RSD (%) | Recovery (%) | RSD (%) | |||
| Decitabine | QCL | 15.0 | 97.28 | 5.69 | 95.04 | 2.77 | 98.55 | 4.25 | 96.02 | 5.28 |
| QCM | 1400.0 | 95.87 | 3.47 | 103.12 | 4.37 | 93.81 | 6.48 | 94.42 | 1.88 | |
| QCH | 2300.0 | 93.35 | 8.14 | 95.83 | 0.51 | 98.73 | 3.18 | 95.40 | 2.90 | |
| Venetoclax | QCL | 15.0 | 99.15 | 2.90 | 97.20 | 3.16 | 91.91 | 4.83 | 94.46 | 2.94 |
| QCM | 500.0 | 95.74 | 3.68 | 94.62 | 1.08 | 93.16 | 3.79 | 105.13 | 5.14 | |
| QCH | 800.0 | 102.02 | 7.34 | 93.79 | 5.25 | 103.94 | 1.57 | 95.37 | 1.53 | |
| n | 3 | 3 | 3 | 3 | ||||||
3.3 Application to pharmacokinetic study
The validated assay was successfully applied to evaluate CTB and GSB in rat plasma for pharmacokinetic study after oral administration of 12 mg/kg CTB and 8.5 mg/kg GSB for six Wistar healthy male rats in a fasting condition. As far as we know, this investigation is the first time to utilize LC-MS/MS technique to quantify the concentrations of CTB and GSB in rat plasma and its application to a pharmacokinetic study. The typical MRM chromatograms of rat plasma at 1.0 h after oral administration are shown in Fig. 4, it has been indicated that the developed assay was found sufficient for a good resolution for CTB, GSB and IS. The mean plasma concentration–time profiles of CTB and GSB were presented in Fig. 5 and the pharmacokinetic parameters from non-compartment model analysis were summarized in Table 7. The maximum plasma concentration (Cmax) for CTB and GSB was 2312.23 ± 448.26 and 1710.61 ± 166.04 ng/mL achieved at 1.0 h for both drugs; respectively. The AUC0-∞ for CTB and GSB was found to be 8592.49 ± 1714.12 and 4527.67 ± 390.01 ng/mL.h; respectively. These values obtained for CTB and GSB were found to be in close accord with previously reported values (Hilhorst et al., 2011; US-FDA Center, 2018). The values acquired in the current investigation for CTB, Cmax, Tmax and t1/2kel parameters, are consistent with in vivo CTB PK studies (Büttner et al., 2016; Cheon et al., 2007; Hilhorst et al., 2011). On the other hands, The elimination half-life (t1/2kel), Tmax, Cmax and AUC0-∞ parameters for GSB were consistent with previously reported values (European, 2020; Masters et al., 2021; Shaik et al., 2019).
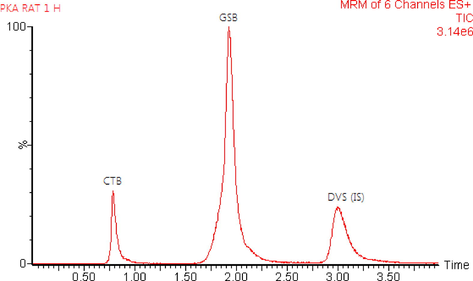
- Typical multiple reaction monitoring (MRM) chromatograms for in vivo rat plasma sample 1.0 h after oral administration of 12.0 mg/kg cytarabine (CTB) and 8.5 mg/kg glasdegib (GSB) with the duvelisib (DVS), IS at a concentration of 500.0 ng/mL.
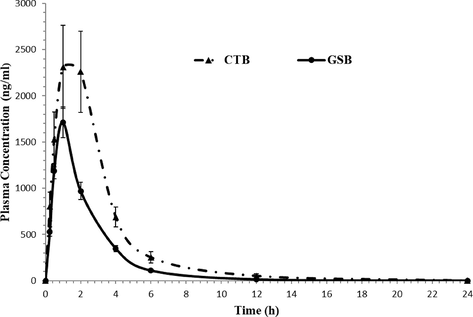
- Mean plasma concentration–time profile of cytarabine (CTB) and glasdegib (GSB) in rats after a single oral dose of 12.0 mg/kg cytarabine and 8.5 mg/kg glasdegib (n = 6, mean ± SD).
| Parsmeter | Unit | Decitabine | Venetoclax |
|---|---|---|---|
| AUC0-t a | ng/mL.h | 1287.40 ± 151.47 | 7469.69 ± 1355.19 |
| AUC0-∞b | ng/mL.h | 1343.61 ± 151.47 | 7539.22 ± 1366.34 |
| Cmaxc | ng/mL | 432.27 ± 54.43 | 812.13 ± 129.40 |
| Tmaxd | h | 1 | 6 |
| Cl/Fe | ng/mL.h | 11.28 ± 1.33 | 13.56 ± 2.24 |
| t1/2kelf | h | 3.32 ± 0.16 | 3.17 ± 0.03 |
| MRT0-∞g | h | 3.16 ± 0.04 | 7.53 ± 0.50 |
* Data are presented as mean ± SD.
4 Conclusions
Analysis of CTB and GSB in rat plasma was done using a newly developed and fully validated LC-MS/MS bioanalytical assay. The developed method was validated as per the FDA guidelines over a linear concentration range of 5–3000, for both CTB and GSB with high correlation coefficient (r2 ≥ 0.99). The LLOD were 2.0 ng/mL for both drugs. The overall recoveries of CTB and GSB from rat plasma were in the range of 93.93–101.43%, and the mean RSD of the results was 2.99%. The validated-method was successfully applied for the first time, to a pharmacokinetic study on concurrent oral administration of CTB and GSB in rats (12.0 mg/kg of CTB and 8.5 mg/kg of GSB). The maximum plasma concentration (Cmax) for CTB and GSB was 2312.23 ± 448.26 ng/mL and 1710.61 ± 166.04 ng/mL achieved at 2.83 ± 0.14 h and 2.39 ± 0.10 h, respectively. The AUC0-∞ for CTB and GSB was found to be 8592.49 ± 1714.12 and 4527.67 ± 390.01 ng/mL.h; respectively. The elimination half-life (t1/2kel) of CTB and GSB in rat plasma, were determined to be 2.00 ± 0.19 h and 1.58 ± 0.13 h, respectively.
Acknowledgments
The authors extend their appreciation to the Researchers Supporting Project number (RSPD2023R754), King Saud University, Riyadh, Saudi Arabia for funding this research.
Declaration of Competing Interest
The authors declare that they have no known competing financial interests or personal relationships that could have appeared to influence the work reported in this paper.
References
- Development and validation of an UHPLC-MS/MS method for simultaneous determination of palbociclib, letrozole and its metabolite carbinol in rat plasma and pharmacokinetic study application. Arab. J. Chem.. 2020;13:4024-4034.
- [Google Scholar]
- Simultaneous determination of clofarabine and cytarabine in human plasma by LC-MS/MS. J. Pharm. Biomed. Anal.. 2016;125:286-291.
- [Google Scholar]
- Pharmacokinetic characteristics of L-valyl-ara-C and its implication on the oral delivery of ara-C. Acta Pharmacol. Sin.. 2007;28:268-272.
- [Google Scholar]
- European Medicines Agency, Committee for Medicinal Products for Human Use (CHMP), EMA/CHMP/284008/2020 (accessed on 15 March 2023).
- Small-molecule Hedgehog inhibitor attenuates the leukemia-initiation potential of acute myeloid leukemia cells. Cancer Sci.. 2016;107:1422-1429.
- [Google Scholar]
- Effective quantification of ravidasvir (an NS5A inhibitor) and sofosbuvir in rat plasma by validated LC-MS/MS method and its application to pharmacokinetic study. Arab. J. Chem.. 2020;13:8160-8171.
- [Google Scholar]
- A rapid and sensitive liquid chromatography-tandem mass spectrometry bioanalytical method for the quantification of encorafenib and binimetinib as a first-line treatment for advanced (unresectable or metastatic) melanoma. Application to a Pharmacokinetic Study. Molecules.. 2023;28:79-92.
- [Google Scholar]
- A Liquid Chromatography Tandem Mass Spectrometry Method for the Simultaneous Estimation of the Dopamine Receptor Antagonist LE300 and Its N-methyl Metabolite in Plasma: Application to a Pharmacokinetic Study. Molecules. 2023;28:1553-1565.
- [Google Scholar]
- Evolutionarily conserved signaling pathways: acting in the shadows of acute myelogenous leukemia’s genetic diversity. Clin. Cancer Res.. 2015;21:240-248.
- [Google Scholar]
- HPLC-MS/MS method for the determination of cytarabine in human plasma. Bioanalysis. 2011;3:1603-1611.
- [Google Scholar]
- A mixed-mode liquid chromatography-tandem mass spectrometric method for the determination of cytarabine in mouse plasma. J. Chromatogr. B.. 2007;854:8-12.
- [Google Scholar]
- Acute myeloid leukemia and myelodysplastic syndromes in older adults. J. Clin. Oncol.. 2014;32:2541-2552.
- [Google Scholar]
- Masters, J.C., Shaik, N., Mendes, da Costa, L., Hee B, LaBadie, R.R. 2021. Clinical and Model-Based Evaluation of the Effect of Glasdegib on Cardiac Repolarization From a Randomized Thorough QT Study. Clin. Pharmacol. Drug Dev. 10, 272-282.
- Simple practice guide for dose conversion between animals and human. J. Basic Clin. Pharm.. 2016;7:27-31.
- [Google Scholar]
- Aberrant activation of the hedgehog signaling pathway in malignant hematological neoplasms. Am. J. Pathol.. 2012;11:180-182.
- [Google Scholar]
- Hedgehog signaling maintains chemoresistance in myeloid leukemic cells. Oncogene. 2010;29:6314-6322.
- [Google Scholar]
- GLI2 inhibition abrogates human leukemia stem cell dormancy. J. Transl. Med.. 2015;13:98-101.
- [Google Scholar]
- Absolute Oral Bioavailability of Glasdegib (PF-04449913), a Smoothened Inhibitor, in Randomized Healthy Volunteers. Clin. Pharmacol. Drug Dev.. 2019;8:895-902.
- [Google Scholar]
- High-performance liquid chromatography/tandem mass spectrometry method for the simultaneous determination of cytarabine and its valyl prodrug valcytarabine in rat plasma. J. Chromatogr. B.. 2008;870:121-125.
- [Google Scholar]
- US FDA. Center for Drug Evaluation and Research. DAURISMO (glasdegib), non-clinical review(s), Application number: 210656Orig1s000, 2018 (accessed on 11 March 2023).
- US. FDA, FDA approves glasdegib for AML in adults age 75 or older or who have comorbidities, 2018. https://www.fda.gov/drugs/fda-approves-glasdegib-aml-adults-age-75-or-older-or-who-have-comorbidities (accessed on 15 March 2023).
- US-FDA, Bioanalytical method validation guidance for industry. 2018. https://www.fda.gov/files/drugs/published/Bioanalytical-Method-Validation-Guidance-for-Industry.pdf (accessed on 15 March 2023).
- Pharmacokinetics, drug metabolism, and tissue distribution of CPX-351 in animals. Nanomedicine 2020102275
- [Google Scholar]
- HPLC-MS/MS method for the simultaneous determination of MB07133 and its metabolites, cytarabine and arabinofuranosyluracil, in rat plasma. J. Pharm. Biomed. Anal.. 2016;120:228-234.
- [Google Scholar]
- Expression of Hedgehog pathway mediator GLI represents a negative prognostic marker in human acute myeloid leukemia and its inhibition exerts antileukemic effects. Clin. Cancer Res.. 2015;21:2388-2398.
- [Google Scholar]
- PKSolver: An add-in program for pharmacokinetic and pharmacodynamic data analysis in Microsoft Excel. Comput. Methods Programs Biomed.. 2010;99:306-314.
- [Google Scholar]


