

Translate this page into:
Application of Photo-Fenton, Electro-Fenton, and Photo-Electro-Fenton processes for the treatment of DMSO and DMAC wastewaters
⁎Corresponding authors. m.abbasi@pgu.ac.ir (Mohsen Abbasi), m.akrami@exeter.ac.uk (Mohammad Akrami)
-
Received: ,
Accepted: ,
This article was originally published by Elsevier and was migrated to Scientific Scholar after the change of Publisher.
Abstract
Abstract
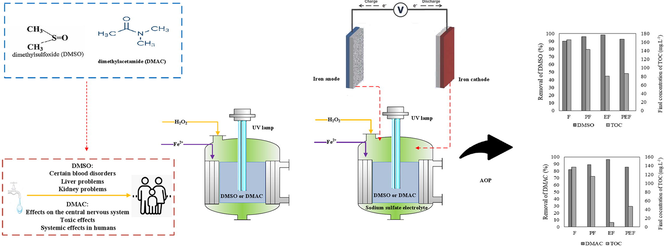
Biological treatment, due to the formation of hazardous chemicals to remove organic compounds such as dimethyl sulfoxide (DMSO) and N, N-dimethylacetamide (DMAC), has limited potential. Advanced oxidation processes (AOPs) are regarded as a viable alternative for treating molecules containing carbon-hydrogen bonds that cannot be broken down by traditional physico-chemical methods. In this investigation, various AOPs such as Photo-Fenton, Electro-Fenton, and Photo-Electro-Fenton processes were studied to treat wastewaters containing DMSO and DMAC. The effects of the operating parameters, including various initial concentrations of DMSO and DMAC, initial pH, reaction time, different concentrations of Fenton’s reagent, power of UV lamp, different concentrations of electrolytes, the distance between electrodes and current intensity, were investigated. The findings of the experiments revealed that a pH of 3 and a reaction time of 120 min were optimal. At 2000 mg L−1 of DMSO, maximum degradation and the final concentration of TOC were 98.64 % and 256.8 mg L−1, respectively, by the Electro-Fenton process under the optimal conditions. The Electro-Fenton process was successful in determining the maximum degradation of DMAC (96.31 %) and the final TOC concentration (10.03 mg L−1) at 250 mg L−1 of DMAC under optimal conditions. Finally, it can be concluded that the Electro-Fenton process was the best process for the efficient removal of DMSO and DMAC. The second step of the kinetic model follows a pseudo-first-order reaction for 250 and 500 mg L−1 of pollutants and obeyed a pseudo-second-order kinetic model for concentrations of 1000, 2000 mg L−1.
Keywords
DMSO wastewater
DMAC wastewater
Photo-Fenton
Electro-Fenton
Photo-Electro-Fenton processes
Advanced Oxidation Process (AOP)

1 Introduction
Water is the most crucial and fundamental factor of living organisms and plays a vital role in the survival of human existence. Therefore, water plays an important role in everyday life of humans and the development of countries. Increasing contamination of water resources by organic and inorganic contaminants causes one of the most important environmental concerns of our time.
Dimethyl Sulfoxide (DMSO) is a prevalent water contaminant since these effluents contain sulfur are discharged into the environment and pollute natural water sources (Park et al., 2001). Firstly, DMSO was synthesized in 1866 by the Russian chemist, Alexander Mikhaylovich Saytzeff, who produced DMSO by oxidation of dimethyl sulfide (Walker, 1992). Recently, the use of the DMSO as an organic solvent in the manufacture of electronic devices and devices, such as a glass double wall display with a liquid crystal solution (LCD) and thin-film transistors (TFT), is increasing widely (Lei et al., 2010; Matira et al., 2015; Kino et al., 2004). The concentration of DMSO in contaminated effluents of TFT-LCD is 500–800 mg/L, and less than 1000 mg/L of these effluents contain biodegradable non-DMSO organic compounds (He et al., 2011; Murakami-Nitta et al., 2003). Also, DMSO can be solved in most of the unsaturated organic compounds, aromatic and chlorine compounds, alcohols, and esters (Chen et al., 2016). As reported from theU.S. EPA,1 the maximal toxicity level for groundwater should not exceed 0.05 mg L−1 (Matira et al., 2015). Literature reported that the maximum concentration of DMSO for aquatic animals and plants include fish as well as other invertebrates should be 32,300, 24,600, and 400 mg L−1, respectively (Chen et al., 2016). Although DMSO is widely used as a solvent for organic and inorganic compounds in various industries, it can be harmful to human blood and the liver due to long contact time with the skin (Matira et al., 2015). Treatment of DMSO wastewater is an essential requirement for both human health and the environment. For the reduction of DMSO from industrial wastewater, different biological methods have been studied (Park et al., 2001; He et al., 2011; Li et al., 2009; Jabesa and Ghosh, 2021). Biological treatment methods are not sufficient for the efficient DMSO removal from wastewaters with both anaerobic and aerobic treatment processes. In the first type, hazardous materials such as methanethiol, dimethyl sulfide, and hydrogen sulfide were formed, and for the aerobic treatment method, incomplete decomposition of DMSO was reported (Colades et al., 2015; Wu et al., 2007; Deguchi et al., 2020). Among the studies conducted on DMSO-containing effluents, the following are notable: UV/H2O process or Fenton’s process as pre-treatment processes of biological treatment (Lei et al., 2010; Koito et al., 1998), the study of the degradation of DMSO by UV/H2O2 (Lee et al., 2004), Fenton-like oxidation at a pH of 7 (Wu et al., 2006), TiO2/UV photocatalytic process (Abellán et al., 2009), ozone-based (Wu et al., 2007).
On the other hand, N, N-dimethylacetamide (DMAC) is produced by the reaction of dimethylamine with ethanoic anhydride and acetic acid esters. Humans can be adversely affected by DMAC toxicity through vapor inhalation and contact with the skin in a long-term exposure (Ge et al., 2012). It is therefore imperative that DMAC is removed from the effluent. Several methods have been used to eliminate DMAC-containing effluents, such as the process with UV irradiation and photocatalyst titanium dioxide (Ge et al., 2012), simultaneous use of Fenton and aerobic biological processes (Li et al., 2011), implementing the Electro-Fenton process with a combination of gold, palladium, and carbon nanotubes nanocatalysts (Sun et al., 2015) and adsorption by activated charcoal (Qiu, 2017). Li et al. (Li et al., 2020) degraded high-concentration industrial wastewater containing DMAC from polymeric membrane manufacturer by Cu2O NPS/H2O2 Fenton process. It was found that the intensified radical yield, fast mass transfer, and nanoparticles high activity all contributed to improving pollutant degradation efficiency. The investigation of degrading behavior of DMAC in water-based solution by a combination of Fenton, Persulfate, and thermal processes was conducted by Yuan et al. (Yuan et al., 2019). To compare, they found that the system's DMAC and COD removal efficiency (96.5 % and 35.7 %, respectively) in the mode of using all three processes was much superior to other systems. Qiu et al. (Qiu, 2017) found that activated carbons can be used to remove DMAC from water-based solutions by conducting a batch sorption experiment.
In light of the limitations of biological treatments for toxic materials, advanced oxidation processes (AOPs) are being accepted as a promising method to treat organic substances with a high level of resistance to chemical, physical, and conventional treatment methods. As organic pollutants remain after biological treatment, AOPs are the best way to reduce these contaminants from wastewater (Alcalá-Delgado et al., 2018). Recent studies have concluded that wastewater with variations in the DMSO/DMAC concentrations in various industries can be treated with the Fenton process (Behrouzeh et al., 2020). Mika et al. (Sillanpää et al., 2018) concluded that various AOPs methods could be used to remove natural organic matter (NOM) from drinking water sources, as well as to treat drinking water by combining the proposed method with other available technologies. Babu et al. (Babu et al., 2019) found that by increasing the biodegradation and reducing the toxicity by AOPs, recalcitrant compounds can be destroyed.
Recent years have seen an increasing interest in treating DMSO and DMAC containing wastewater using Fenton processes, one of the most common and least expensive types of AOPs (Matira et al., 2015; Chen et al., 2016; Sun et al., 2015). Electricity (Electro-Fenton process), exposing the solution to ultraviolet light (Photo-Fenton process), and using ultrasonic waves (Sono-Fenton process) can all boost the Fenton process' oxidation capacity.
Following the previous study published on the treatment of DMSO and DMAC wastewaters at a wide range of concentrations by the Fenton process (Behrouzeh et al., 2020), and in order to improve the treatment efficiency, new processes such as Photo-Fenton, Electro-Fenton, and Photo-Electro-Fenton processes have been used in this research. Therefore, the novelty of this complete work is the treatment of wastewaters containing a low and high concentration of DMSO and DMAC that are produced in different industries such as pharmaceutical, electronics, and acrylic fiber manufacturing processes. In fact, the other researches in literature only have considered treatment of certain concentrations of DMSO and DMAC in wastewaters, but due to various industries that produce low and high dosages of DMAC and DMSO, the novelty of this research is a comprehensive examination for treatment of DMSO and DMAC wastewaters with wide ranges of DMSO and DMAC concentrations with hybrid AOP process such as Photo-Fenton, Electro-Fenton, and Photo-Electro-Fenton. In addition, the effects of different parameters such as a variety of initial concentrations of DMSO and DMAC, power of UV lamp, different concentrations of electrolytes, the distance between electrodes, and also current intensity are investigated. Process efficiency in terms of degradation of pollutants and removal of TOC was compared among different processes. The kinetic investigation was also carried out for various concentrations of pollutants in optimal circumstances, and the reaction order was determined based on the best fit.
2 Materials and methods
2.1 Chemicals and materials
Commercial analytical-grade reagents and chemicals were used in all of the experiments. The following chemicals were obtained from Merck Chemical Company in Germany: N, N-dimethylacetamide (C4H9NO, 99 percent purity), Dimethyl sulfoxide (C2H6SO, 99.5 percent purity), iron sulfate (FeSO4·7H2O, 99.5 %purity), hydrogen peroxide (H2O2, 30 % purity), sodium hydroxide (NaOH, 98 percent purity), sulfuric acid (H2SO4, 97 percent purity), and sodium sulfate (Na2SO4, 99.5 % purity), used in the experiment. Demineralized water was used to create synthetic wastewater containing DMSO and DMAC separately in quantities ranging from 250 to 2000 mg L−1.
2.2 Method of analysis
DMSO and DMAC concentrations were determined using a simple single beam UV/Vis spectrophotometer (UVILINE 9600-AQUALABO ANALYSE, France) operating in the 190–1100 nm wavelength range and a quartz cuvette of 1 cm path length. The TOCN-4100 Shimadzu analyzer was used for the determination of TOC (Total Organic Carbon). Electrical conductivity (Multi 9620 IDS, WTW) was measured at the optimum electrolyte concentration using an electrical conductivity meter. As part of the experiments, an AZ-86502 pH meter was employed to determine the acidity level of the synthetic wastewaters containing DMSO and DMAC at the start of the experiment. A power supply (MP-6003, MEGATEK) was utilized to supply electrical energy in Electro-Fenton and Photo-Electro-Fenton processes. Three UVC (254 nm, 4 W) lamps were used in Photo-Fenton and Photo-Electro-Fenton processes as light sources. In the blank tests, under the influence of UV radiation alone, individually, 16.22 % and 12.65 % of DMSO and DMAC were removed after 120 min, respectively. Water bath (RA8, LAUDA) was applied for gradual and uniform control of effluent temperature in Photo-Fenton, Electro-Fenton, and Photo-Electro-Fenton processes. The cathode and anode were made of iron that had a thickness of 2 mm, width of 20 mm, and length of 220 mm.
The removal efficiency of DMSO and DMAC were determined using the Eq. (1):
At the beginning and end of treatment, the concentrations of contaminants are Ci and Cf.
2.3 Establishment and operation of experimental setup
Removal of DMSO and DMAC from synthetic wastewaters was performed after determining the optimal concentration of Fenton reagent in the Photo-Fenton, Electro-Fenton and Photo-Electro-Fenton processes. Experimental design was performed to treat DMSO and DMAC synthetic wastewaters in four different concentrations of 250, 500, 1000, and 2000 mg L−1 using different concentrations of ferrous ion and hydrogen peroxide.
Pyrex glass cylinder of 19 cm height and 10 cm diameter was used as a reactor. In all experiments, the effluent volume considered to be 1000 mL for treatment of DMSO and DMAC. After preparing synthetic DMSO and DMAC wastewaters, the pH value of the wastewater was adjusted at 3 with 1.0 N H2SO4 solution. Then, a determined amount of iron sulfate heptahydrate, was added to the reactor, and Fenton reaction started by adding calculated volumes of H2O2 proportional with different concentrations of DMSO and similar for DMAC wastewaters. The solution was stirred continuously for 120 min by a magnetic stirrer. All experiments were carried out under constant conditions at 120 min reaction time, pH = 3 (except for the effect of initial pH), and temperature of 25 ℃. To reduce operating costs, the optimum reaction time was considered as 120 min, and all subsequent experiments were carried out at this time. For Photo-Fenton, the optimum Fenton reagent was added to the Pyrex glass reactor containing the effluent. The reaction starts with the UV lamps switching on that its electrical energy is supplied by a power supply, and the water bath was used to stabilize the reactor temperature. Also, to maintain safety, avoid the reflection and emission of UV–vis, the reactor was covered with black nylon and thick aluminum foil. The thickness of the aluminum foil is 20 µm. Eventually, this process acquired DMSO and DMAC in various concentrations.
For Electro-Fenton, after preparing synthetic DMSO and DMAC wastewaters and adjusting its pH = 3, sodium sulfate and then the optimum cconcentration of Fenton reagent was added to the solution. Moreover, to initiate the reaction, the electrodes fixed on the Teflon lid were connected to the digital power coupling device by the interface wires and applied to the desired currents (0.25, 0.5, 1, 2 A) under constant conditions at 120 min reaction time and finally, was sampled at certain times from the effluent. Then, for each sample, to stop the Fenton reaction and neutralization of the pH solution, with the gradual addition of the 1.0 sodium hydroxide solution, the pH of the sample was adjusted to 7. Finally, for the separation of irons hydroxide precipitations, the supernatant samples were filtered using filter papers (2.5 µm, Whatman, England) before the UV–vis analysis.
The last studied process, Photo-Electro-Fenton, which is a combination of Fenton, Photo-Fenton, and Electro-Fenton, was conducted after determining the optimum conditions of these processes (Table 1). The whole process of the experiment is like the Electro-Fenton process, while the reaction began when the UV lamps were illuminated.
Contaminant type
Initial concentration of contaminants (mg.L-1)
Optimal concentration of Fe2+ (mg.L-1)
Optimal concentration of H2O2 (mg.L-1)
DMSO
250
500
600
500
1500
2000
1000
3000
4000
2000
4000
8000
DMAC
250
125
200
500
500
1500
1000
1000
4000
2000
5000
2000
In the previous study (Behrouzeh et al., 2020), we comprehensively and completely examined the degradation of pollutants and the amount of carbon in the treated effluent (TOC) in different concentrations of hydrogen peroxide and ferrous ions, which were less and more than the concentrations of DMSO and DMAC. The results of Table 1 are based on the optimized values found in the previous paper. Therefore, in this paper, the optimal amounts of hydrogen peroxide and ferrous ions for the Fenton process at different concentrations of DMSO and DMAC are selected based on our previous work (Behrouzeh et al., 2020), and only hybrid process parameters such as UV lamp power, the impact of adding electrolytes, the distance between electrodes, and also current intensity have been investigated.
It should be noted that the selection of these optimal concentrations of H2O2 and Fe2+ in Table 1 is based on the detailed results of our previous work, where the degradation of pollutants in appropriate times has been done with considering economic aspects. In order to get more information and understand the effect of various parameters of hydrogen peroxide and ferrous ions in different concentrations of DMSO and DMAC and to view the diagrams and tables, refer to the previous work (Behrouzeh et al., 2020).
As a matter of fact, the addition of Fe2+ to a certain amount can increase the concentration of hydroxyl radicals, which is conducive to higher removal efficiency. Due to competitive and adverse reactions between Fe2+ and the hydroxyl radical in the reaction medium, the pollutant removal efficiency decreases as Fe2+ is further increased. Also, enhancing Fe/H2O2 may result in coagulation, according to literature (Matira et al., 2015; Chen et al., 2016). These brown were observed after the coagulation process and when NaOH added for this purpose that the pH of the sample was adjusted to 7. Finally, for the separation of irons hydroxide precipitations, the supernatant samples were filtered using filter papers (2.5 µm, Whatman, England) before the UV–vis analysis.
According to our previous paper (Behrouzeh et al., 2020), COD removal by coagulation increased as the ferrous content enhanced. The reduction of COD removal resulting from oxidation was compensated by the increase via coagulation. This improvement in efficiency can be attributed to increased hydroxyl radical production (Ting et al., 2009). But a large amount of the initial concentration of H2O2 lead to a reduction in the process efficiency because hydrogen peroxide plays a role in hydroxyl radical scavenging at this concentration.
3 Results and discussion
In this section, various factors, such as concentration and operating parameters, were investigated. In order to convert the values absorbed by the UV spectrometer to the final concentration in mg L−1, it is necessary to plot the calibration curve. Thus standard solutions at concentrations of 500, 100, 80,90, 70, 60, 50, 40, 30, 20, 10, 5 and 1 mg L−1 for DMSO and concentrations of 200, 20, 18, 14,16, 12, 11, 10, 9, 8, 7, 6, 5, 4, 3, 2 and 1 mg L−1 for DMAC were prepared. Fig. 1 depicts the DMSO and DMAC calibration curves at maximum wavelengths of 207 and 290 nm, respectively. The R-squared values for the DMSO and DMAC calibration curves were initially determined to be 0.998 and 0.997, respectively.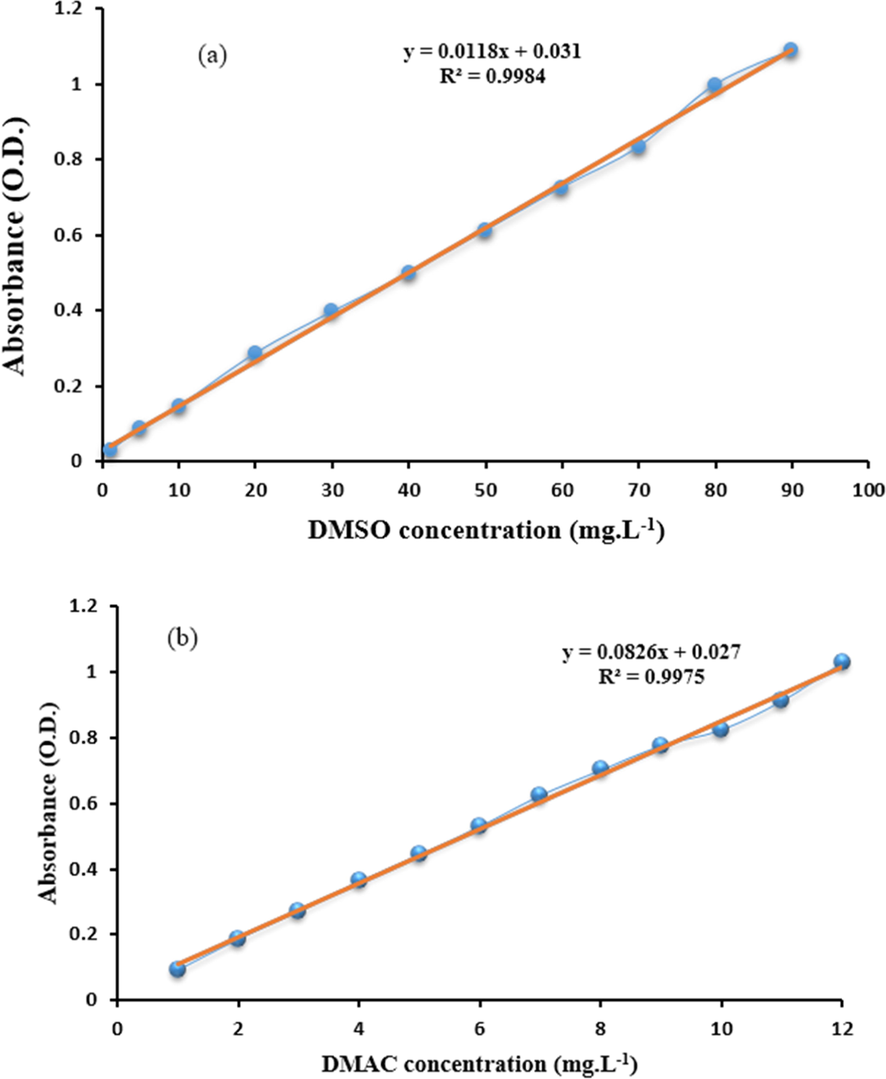
DMSO (a) and DMAC (b) calibration curves.
3.1 Photo-Fenton process
In this process, initially, the effect of changing the power of the UVC lamp from 0 to 24 W in the optimal concentration of Fe2+ and H2O2 at a concentration of 250 mg L−1 of DMSO and DMAC (Table 1) was studied. After obtaining the optimal power of UVC lamp, the effect of this process on the removal efficiency of DMSO and DMAC at optimal concentrations of 250, 500, 1000 and 2000 mg L−1 was investigated. Finally, for the optimal concentration of 250 mg L−1 of DMSO and DMAC, the effect of UV, UV/H2O2, and UV/H2O2/Fe2+ on removal efficiency was assessed.
3.1.1 The effect of the various UV lamp powers
In Photo-Fenton process, different powers such as 0, 8, 16, 24 W of UV were used. Therefore, this process takes place in optimal quantities of H2O2 and Fe2+ at a concentration of 250 mg L−1 of DMSO and DMAC randomly (Behrouzeh et al., 2020), as illustrated in Fig. 2. Results showed that by increasing the UV power from 8 W to 24 W caused the DMSO removal efficiency enhanced from 90.59 to 95.78 %. Highest removal rate occurred at 24 W of power because in high power UVs, hydrogen peroxide photolysis and optical reduction of the ferric ion increases. The Photo-Fenton process's improved efficacy in order to oxidize various organic contaminants can be attributed to the high production of hydroxyl radicals resulting from the photolysis of hydrogen peroxide and the reduction of ferrous ions in an acidic environment. According to Eq. (2–6), in the Photo-Fenton process, ferrous ions are continuously recovered by UV rays in the wavelength range of 250–400 nm, and their amount is not reduced during the oxidation reaction (de Luna et al., 2013).
![The effect of UV lamps power a: (pH = 3, [H2O2] = 600 mg L−1, [Fe2+] = 500 mg L−1, [DMSO] = 250 mg L−1) and b: (pH = 3, [H2O2] = 200 mg L−1, [Fe2+] = 125 mg L−1, [DMAC] = 250 mg L−1).](/content/184/2022/15/11/img/10.1016_j.arabjc.2022.104229-fig3.png)
The effect of UV lamps power a: (pH = 3, [H2O2] = 600 mg L−1, [Fe2+] = 500 mg L−1, [DMSO] = 250 mg L−1) and b: (pH = 3, [H2O2] = 200 mg L−1, [Fe2+] = 125 mg L−1, [DMAC] = 250 mg L−1).
Ferric ion complexes are the main components of light absorption in this system that regenerate excess ferrous ions by light. At pH = 3, the Fe (OH)2+ complex is formed due to the acidic environment (Eq. (4)). When complex Fe(OH)2+ is exposed to UV light, it decomposes more and produces ferric and hydroxyl radical ions (Eq. (3 and 5)). On the other hand, according to Eq. (6), hydrogen peroxide photolysis can also increase the production of hydroxyl radicals, which ultimately leads to further destruction of pollutants and usually occurs at wavelengths lower than 400 nm.
3.1.2 The effect of the Photo-Fenton process on the removal efficiency in the optimal power of UVC lamp
This part evaluated the effect of optimum UVC power (24 W) on different DMSO and DMAC concentrations (250, 500, 1000, and 2000 mg L−1). All experiments were performed under optimum conditions (optimal concentration of Fe2+ and H2O2) obtained by the Fenton process (Behrouzeh et al., 2020). As shown in Figs. 3-4, the turbidity of the iron in the effluent, which is brick-colored, is low due to the low concentrations of ferrous ions and hydrogen peroxide. As a result, the turbidity creates less inhibition for UV radiation absorption for photolysis. By increasing the target pollutant concentration (from 250 to 2000 mg L−1) and subsequently increasing the optimal concentrations of ferrous ions and hydrogen peroxide, the elimination efficiency of the Photo-Fenton processes on removal of DMSO and DMAC is almost enhanced.![The effect of Photo-Fenton process on the pollutant removal of DMSO. a: (pH = 3, [H2O2] = 600 mg L−1, [Fe2+] = 500 mg L−1, Three UVC lamps (24 W), and [DMSO] = 250 mg L−1). b: (pH = 3, [H2O2] = 2000 mg L−1, [Fe2+] = 1500 mg L−1, Three UVC lamps (24 W), and [DMSO] = 500 mg L−1). c: (pH = 3, [H2O2] = 4000 mg L−1, [Fe2+] = 3000 mg L−1, Three UVC lamps (24 W), and [DMSO] = 1000 mg L−1). d: (pH = 3, [H2O2] = 8000 mg L−1, [Fe2+] = 4000 mg L−1, Three UVC lamps (24 W), and [DMSO] = 2000 mg L−1).](/content/184/2022/15/11/img/10.1016_j.arabjc.2022.104229-fig4.png)
The effect of Photo-Fenton process on the pollutant removal of DMSO. a: (pH = 3, [H2O2] = 600 mg L−1, [Fe2+] = 500 mg L−1, Three UVC lamps (24 W), and [DMSO] = 250 mg L−1). b: (pH = 3, [H2O2] = 2000 mg L−1, [Fe2+] = 1500 mg L−1, Three UVC lamps (24 W), and [DMSO] = 500 mg L−1). c: (pH = 3, [H2O2] = 4000 mg L−1, [Fe2+] = 3000 mg L−1, Three UVC lamps (24 W), and [DMSO] = 1000 mg L−1). d: (pH = 3, [H2O2] = 8000 mg L−1, [Fe2+] = 4000 mg L−1, Three UVC lamps (24 W), and [DMSO] = 2000 mg L−1).
![The effect of Photo-Fenton process on the pollutant removal of DMAC. a: (pH = 3, [H2O2] = 200 mg L−1, [Fe2+] = 125 mg L−1, Three UVC lamps (24 W), and [DMAC] = 250 mg L−1). b: (pH = 3, [H2O2] = 1500 mg L−1, [Fe2+] = 500 mg L−1, Three UVC lamps (24 W), and [DMAC] = 500 mg L−1). c: (pH = 3, [H2O2] = 4000 mg L−1, [Fe2+] = 1000 mg L−1, Three UVC lamps (24 W), and [DMAC] = 1000 mg L−1). d: (pH = 3, [H2O2] = 2000 mg L−1, [Fe2+] = 5000 mg L−1, Three UVC lamps (24 W), and [DMAC] = 2000 mg L−1).](/content/184/2022/15/11/img/10.1016_j.arabjc.2022.104229-fig5.png)
The effect of Photo-Fenton process on the pollutant removal of DMAC. a: (pH = 3, [H2O2] = 200 mg L−1, [Fe2+] = 125 mg L−1, Three UVC lamps (24 W), and [DMAC] = 250 mg L−1). b: (pH = 3, [H2O2] = 1500 mg L−1, [Fe2+] = 500 mg L−1, Three UVC lamps (24 W), and [DMAC] = 500 mg L−1). c: (pH = 3, [H2O2] = 4000 mg L−1, [Fe2+] = 1000 mg L−1, Three UVC lamps (24 W), and [DMAC] = 1000 mg L−1). d: (pH = 3, [H2O2] = 2000 mg L−1, [Fe2+] = 5000 mg L−1, Three UVC lamps (24 W), and [DMAC] = 2000 mg L−1).
3.1.3 Kinetics study of photo-Fenton process under best conditions
Degradation of DMSO and DMAC wastewaters take place in two steps using the Fenton oxidation process. Therefore, this process is investigated according to the two kinetic equations in this section. The first step takes place within a short time of 0–3 min. During this step, no intermediates are produced and do not have any effect on the degradation of DMSO and DMAC. Due to the abundance of hydroxyl radicals, it can be assumed zero order. In the second step of the Fenton process, reaction intermediates are almost presented and involved in the reaction mechanism (Matira et al., 2015).
Therefore, in this research, the kinetic modeling of the second step oxidation of all concentrations of DMSO and DMAC by the photo-Fenton process to determine chemical kinetics (zero, first, and second order reaction) in ideal circumstances was explored using Eqs. (7) to (9) (Emami et al., 2010; Tunç et al., 2012). DMSO's and DMAC's concentrations in mg L−1 at the beginning and end of treatment are referred to as C0 and C, respectively. Also, k is the kinetic constant and t is the reaction time.
As shown in Table 2 and Table 3, given the linear variability of –Ln(C/C0) = kt in terms of time and the linear correlation of the top of the diagram with a change in time graph, it can be concluded that the equation of DMSO and DMAC degradation rate in the concentration of 250 and 500 mg L−1 follows the pseudo-first degree. But the DMSO and DMAC destruction rate equations in the 1000 and 2000 mg L−1 concentrations follow the pseudo-second degree because the linear changes (1/C) - (1/C0) = kt have a higher correlation coefficient over time. The reaction rate of the photo-Fenton process at all different concentrations of pollutants is approximately 1.5 times higher than the Fenton process.
The initial concentration of DMSO(mg.L-1)
pseudo-zero degree
pseudo-first degree
pseudo-second degree
250
k = 0.0075 mM.min-1
R2 = 0.9365k = 0.0169 min-1
R2 = 0.9979k = 0.0496 mM-1
min-1R2 = 0.9295
500
k = 0.0078 mM.min-1
R2 = 0.9711k = 0.0010 min-1
R2 = 0.9982k = 0.0141 mM-1
min-1R2 = 0.9812
1000
k = 0.0083 mM.min-1
R2 = 0.9446k = 0.0088 min-1
R2 = 0.9851k = 0.0101 mM-1
min-1R2 = 0.9943
2000
k = 0.0059 mM.min-1
R2 = 0.8862k = 0.0085 min-1
R2 = 0.9572k = 0.0131 mM-1
min-1R2 = 0.9829
The initial concentration of DMAC(mg.L-1)
pseudo-zero degree
pseudo-first degree
pseudo-second degree
250
k = 0.0051 mM.min-1
R2 = 0.9664k = 0.0089 min-1
R2 = 0.9950k = 0.0165 mM-1min-1
R2 = 0.9844
500
k = 0.0063 mM.min-1
R2 = 0.8976k = 0.0137 min-1
R2 = 0.9844k = 0.0363 mM-1min-1
R2 = 0.9528
1000
k = 0.0111 mM.min-1
R2 = 0.8702k = 0.0131 min-1
R2 = 0.9644k = 0.0180 mM-1min-1
R2 = 0.9954
2000
k = 0.0140 mM.min-1
R2 = 0.8375k = 0.0099 min-1
R2 = 0.9450k = 0.0077 mM-1min-1
R2 = 0.9878
3.1.4 The effect of individual operational parameters on the elimination of DMSO and DMAC during the Photo-Fenton process
In order to determine the synergistic effect of the participating components on the elimination of DMSO and DMAC, the effect of UV and UV/H2O2 alone was investigated in the best conditions obtained from the Photo-Fenton process. Under the influence of UV radiation alone, individually, 16.22 % and 12.65 % of DMSO and DMAC were removed after 120 min, respectively, which was done by direct photolysis. Therefore, using UV radiation alone can eliminate minor contaminants. This phenomenon is that UV independently cannot produce enough of the main factor that breaks down pollutants, a hydroxyl radical. When effluents containing DMSO and DMAC, along with hydrogen peroxide, are exposed to UV light, the removal rate increases significantly. As can be seen from Figs. 5-6, after 120 min, 75.2 % and 51.7 % of DMSO and DMAC were removed, respectively. The reason for this subject is related to the production of hydroxyl radicals by the hydrogen peroxide photosynthesis under UV light, according to Eq. (6). On the other hand, acidic environments, to some extent, stabilize hydrogen peroxide. In contrast, in the photo Fenton process, the hydroxyl radicals produced based on the reaction between the Fenton reagents and H2O2 photosynthesis by UV irradiation resulted in the elimination of 95.8 % and 88.8 % for DMSO and DMAC, respectively, according to Eq. (3) and Eq. (6).![Effectiveness of synergistic components in the Photo-Fenton process (pH = 3, [H2O2] = 600 mg L−1, [Fe2+] = 500 mg L−1, Three UVC lamps (24 W), and [DMSO] = 250 mg L−1).](/content/184/2022/15/11/img/10.1016_j.arabjc.2022.104229-fig6.png)
Effectiveness of synergistic components in the Photo-Fenton process (pH = 3, [H2O2] = 600 mg L−1, [Fe2+] = 500 mg L−1, Three UVC lamps (24 W), and [DMSO] = 250 mg L−1).
![Effectiveness of synergistic components in the Photo-Fenton process (pH = 3, [H2O2] = 200 mg L−1, [Fe2+] = 125 mg L−1, Three UVC lamps (24 W), and [DMAC] = 250 mg L−1).](/content/184/2022/15/11/img/10.1016_j.arabjc.2022.104229-fig7.png)
Effectiveness of synergistic components in the Photo-Fenton process (pH = 3, [H2O2] = 200 mg L−1, [Fe2+] = 125 mg L−1, Three UVC lamps (24 W), and [DMAC] = 250 mg L−1).
3.2 Electro-Fenton process for treatment of synthetic DMSO and DMAC wastewaters
In this section, the elimination of DMSO and DMAC contaminants is discussed with the effect of adding different electrolyte concentrations, the distance between electrodes, and changes in current intensity on the Electro-Fenton process's effectiveness.
3.2.1 The impact of adding electrolytes
Electrolytes improve the conductivity of the solution, and, as a result, increase the electron transfer, which enhances the efficiency of the Electro-Fenton process. In this work, iron electrodes with the dimensions of
mm were used. The effect of sodium sulfate addition as an electrolyte on the separation and electrical energy consumption of DMSO and DMAC pollutants was investigated in four different concentrations: 3.55, 7.10, 10.65, and 14.2 g L−1. The results obtained from the removal of pollutants and specific electric energy consumption due to the addition of sodium sulfate are shown in Fig. 7. As can be seen from Fig. 7, when the electrolyte is not present in the reaction medium, the removal efficiencies of 90.33 % and 81.98 % were obtained for DMSO and DMAC, respectively. However, when sodium sulfate was added to the system, the highest DMSO and DMAC elimination efficiencies were 98.06 % and 88.03 % at a concentration of 7.1 g L−1 sodium sulfate, respectively, and further adding sodium sulfate reduced the process efficiency. Therefore, it can be concluded that the addition of electrolyte has an efficient role in the efficacy on the elimination of DMSO and DMAC. The enhancement of the process efficiency is according to Eq. (10) with the oxidation of the electrolyte, SO42- near the anode is converted to S2O82-, then according to the Eq. (11) and Eq. (12) due to the production of sulfate radical (E0 = 2.6 V) and hydroxyl radical increase the degradation of pollutants. In quantities more than the optimal amount of sodium sulfate, according to Eq. (13–15), hydroxyl radical and hydrogen peroxide is consumed by excess amounts of sulfate and reduce the efficiency of the process (Moreira et al., 2017).
![Effect of different concentrations of sodium sulfate. (a): Removal of DMSO. (b): Special electrical energy consumption. (pH = 3, [H2O2] = 600 mg L−1, [Fe2+] = 500 mg L−1 and [DMSO] = 250 mg L−1, 0.5A and distance between the electrodes = 1 cm). (c): Removal of DMAC. (d): Special electrical energy consumption. (pH = 3, [H2O2] = 200 mg L−1, [Fe2+] = 125 mg L−1 and [DMAC] = 250 mg L−1, 0.5A and distance between the electrodes = 1 cm).](/content/184/2022/15/11/img/10.1016_j.arabjc.2022.104229-fig8.png)
Effect of different concentrations of sodium sulfate. (a): Removal of DMSO. (b): Special electrical energy consumption. (pH = 3, [H2O2] = 600 mg L−1, [Fe2+] = 500 mg L−1 and [DMSO] = 250 mg L−1, 0.5A and distance between the electrodes = 1 cm). (c): Removal of DMAC. (d): Special electrical energy consumption. (pH = 3, [H2O2] = 200 mg L−1, [Fe2+] = 125 mg L−1 and [DMAC] = 250 mg L−1, 0.5A and distance between the electrodes = 1 cm).
One of the most important parameters that play an essential role in the electrochemical treatment is the cost of electrical energy. Specific electric energy consumption (EC) refers to the amount of electrical energy consumed per unit mass of discharged organic waste (refined), which is used for the economic evaluation of the treatment process. The EC is calculated by using Eq. (16) (Ganiyu et al., 2018).
Where is the average measured voltage of all the cells (V), I is the current (A), t is the reaction time (h), is the treated solution's volume (L), and and C are the initial and final concentrations (kg/L) of the treatment. Fig. 7 shows that the electrical energy consumption decreases significantly when there is an increment in electrolyte concentration. Indeed, by increasing the conductivity at a constant current intensity, the cell voltage decreases. Because with boosting the conductivity of the solution, the resistance of the solution decreases. Finally, as the cell voltage drops, the electrical energy consumption decreases. For example, when electrolyte was not added to the wastewater, the electrical energy consumption for DMSO and DMAC was 19.92 and 50.74 kWh/kg at a constant current of 0.5 A, respectively. However, by increasing the electrolyte concentration to the optimum value, the electrical energy consumption for DMSO and DMAC decreased to 10.19 and 10.69 kWh/kg, respectively.
Electrical conductivity was measured at the optimum concentration of sodium sulfate to evaluate the conductivity of the wastewater. As shown in Fig. 8, with the addition of electrolyte to the solution, the conductivity of the solution was changed from 2.09 to 9.75 mS cm−1 for DMSO and from 0.997 to 9.5 mS cm−1 for DMAC. With the increase of ions dissolved in the effluent, the conductivity increases.![The effect of the presence and absence of sodium sulfate (a): Electrical guidance of effluent containing DMSO (pH = 3, [H2O2] = 600 mg L−1, [Fe2+] = 500 mg L−1 and [DMSO] = 250 mg L−1, 0.5A and distance between the electrodes = 1 cm). (b): Electrical guidance of effluent containing DMAC (pH = 3, [H2O2] = 200 mg L−1, [Fe2+] = 125 mg L−1 and [DMAC] = 250 mg L−1, 0.5A and distance between the electrodes = 1 cm).](/content/184/2022/15/11/img/10.1016_j.arabjc.2022.104229-fig9.png)
The effect of the presence and absence of sodium sulfate (a): Electrical guidance of effluent containing DMSO (pH = 3, [H2O2] = 600 mg L−1, [Fe2+] = 500 mg L−1 and [DMSO] = 250 mg L−1, 0.5A and distance between the electrodes = 1 cm). (b): Electrical guidance of effluent containing DMAC (pH = 3, [H2O2] = 200 mg L−1, [Fe2+] = 125 mg L−1 and [DMAC] = 250 mg L−1, 0.5A and distance between the electrodes = 1 cm).
3.2.2 The effect of the distance between electrodes
Distance between iron electrodes (
mm) is an important parameter in the electro-Fenton process. As shown in Fig. 9, the removal efficiency of DMSO and DMAC for constant current intensity of 0.5 A, time 120 min, initial concentration of 250 mg/L of the contaminant, and optimal amounts of ferrous ions and hydrogen peroxide at a distance of 1 cm between the electrode pairs, 98.06 and 88.03 % was achieved. While the removal efficiency in the same conditions for distances of 2 and 3 cm between the electrode pairs was 95.44 and 90.04 % for DMSO, 83.54, and 78.24 % for DMAC, respectively. In other words, DMSO and DMAC's elimination efficiency decreased with increasing distance between the electrodes. As can be seen from the results, the maximum removal efficiency occurs at a distance of 1 cm from the electrodes. The higher this distance, the lower the efficiency of removal. However, reducing the distance between the electrodes is not more common than this due to the increase in the input electrical power and the possibility of a short circuit in the electric current. On the other hand, at distances less than 1 cm between the electrodes, the ferrous ions produced by electrical reduction (Eq. (17)) are easily oxidized to ferric ions at the anode (Eq. (18)) and reduce the removal efficiency (He and Zhou, 2017). Therefore, a distance of 1 cm between the electrodes was selected as the optimal distance. The reason for the decrease in efficiency at distances greater than 1 cm is that longer distances limit the mass transfer of ferric ion to the cathode surface and reduce the regeneration of ferrous ions. On the other hand, a greater distance between the electrodes causes a significant increase in electrical energy consumption. Electrical energy consumption at a distance of 1 cm between the electrode pairs was 4.89 and 8.18 kWh/Kg of DMSO and DMAC, respectively. While in the same conditions, the special electrical energy consumption at distance of 2 and 3 cm between the electrode pairs was 12.15 and 18.21 kWh/kg of DMSO, 15.32 and 22.50 kWh/kg of DMAC, respectively. The results are shown in Fig. 9.
![The effect of the distance between the electrodes on (a): Removal of DMSO. (b): Special electrical energy consumption. (pH = 3, [H2O2] = 600 mg L−1, [Fe2+] = 500 mg L−1 and [DMSO] = 250 mg L−1, [Na2SO4] = 7.1 g L−1, 0.5A). (c): Removal of DMAC. (d): Special electrical energy consumption. (pH = 3, [H2O2] = 200 mg L−1, [Fe2+] = 125 mg L−1 and [DMAC] = 250 mg L−1, [Na2SO4] = 7.1 g L−1, 0.5A).](/content/184/2022/15/11/img/10.1016_j.arabjc.2022.104229-fig10.png)
The effect of the distance between the electrodes on (a): Removal of DMSO. (b): Special electrical energy consumption. (pH = 3, [H2O2] = 600 mg L−1, [Fe2+] = 500 mg L−1 and [DMSO] = 250 mg L−1, [Na2SO4] = 7.1 g L−1, 0.5A). (c): Removal of DMAC. (d): Special electrical energy consumption. (pH = 3, [H2O2] = 200 mg L−1, [Fe2+] = 125 mg L−1 and [DMAC] = 250 mg L−1, [Na2SO4] = 7.1 g L−1, 0.5A).
3.2.3 The effect of current intensity on the removal of different concentrations of DMSO and DMAC
When conducting Electro-Fenton processes, the current intensity is one of the most critical variables to consider. This factor affects the speed of Electro-Fenton reactions by affecting the number of metal ions that separate from the electrode surface. In this study, the effect of current intensity changes was applied from 0.25 to 2 A on the removal of different concentrations of DMSO and DMAC. Results are shown in Figs. 10-11. The results illustrate that with the increment of current intensity to a certain extent, the reaction rate rises and consequently the amount of contaminant removal. Increasing the current flowing through the solution leads to a further decomposition of the iron electrodes and the production of hydroxyl radical, which increases the current intensity and ultimately enhances the efficiency of the process. According to Eq. (20), by creating an electric current, the anode electrode releases the ferrous ions. Moreover, continuous reduction of ferric ions at the cathode surface causes regeneration of ferrous ions. It is stated in Eq. (3) that the creation of Fe2+ boosts the production of hydroxyl radical. On the other hand, according to Eq. (21), there is a possibility of hydrogen peroxide formation and acceleration of hydroxyl radical production. In this study, the only source of iron ions produced in the reactor to react is not iron electrodes because the optimal amounts of ferrous ions are present in the reaction. Therefore, an excessive increment in electric current rises the occurrence of adverse and interfering reactions in the reactor. As a result, these reactions will reduce the efficiency of the process. Because the rate of ferrous ion regeneration rises through continuous reduction of ferric ions at the surface on the cathode in the reactor based on Eq. (17) and, then its excess amounts according to Eq. (24) cause the scavenging of hydroxyl radicals. On the other hand, boosting the current intensity also rises interfering reactions, such as the release of oxygen and hydrogen gases from the anode and cathode surfaces according to Eqs. (19) and (22), respectively. Hydrogen peroxide added to the electrochemical reactor is also decomposed into the water at high voltages, which in turn reduces efficiency (Eq. (23)) (Chen et al., 2017; Guivarch et al., 2003).
![The effect of different current intensities on the removal of DMSO. a: (pH = 3, [H2O2] = 600 mg L−1, [Fe2+] = 500 mg L−1 and [DMSO] = 250 mg L−1 and [Na2SO4] = 7.1 g L−1). b: (pH = 3, [H2O2] = 2000 mg L−1, [Fe2+] = 1500 mg L−1 and [DMSO] = 500 mg L−1 and [Na2SO4] = 7.1 g L−1). c: (pH = 3, [H2O2] = 4000 mg L−1, [Fe2+] = 3000 mg L−1 and [DMSO] = 1000 mg L−1 and [Na2SO4] = 7.1 g L−1). d: (pH = 3, [H2O2] = 8000 mg L−1, [Fe2+] = 4000 mg L−1 and [DMSO] = 2000 mg L−1 and [Na2SO4] = 7.1 g L−1).](/content/184/2022/15/11/img/10.1016_j.arabjc.2022.104229-fig11.png)
The effect of different current intensities on the removal of DMSO. a: (pH = 3, [H2O2] = 600 mg L−1, [Fe2+] = 500 mg L−1 and [DMSO] = 250 mg L−1 and [Na2SO4] = 7.1 g L−1). b: (pH = 3, [H2O2] = 2000 mg L−1, [Fe2+] = 1500 mg L−1 and [DMSO] = 500 mg L−1 and [Na2SO4] = 7.1 g L−1). c: (pH = 3, [H2O2] = 4000 mg L−1, [Fe2+] = 3000 mg L−1 and [DMSO] = 1000 mg L−1 and [Na2SO4] = 7.1 g L−1). d: (pH = 3, [H2O2] = 8000 mg L−1, [Fe2+] = 4000 mg L−1 and [DMSO] = 2000 mg L−1 and [Na2SO4] = 7.1 g L−1).
![The effect of different current intensities on the removal of DMAC. a: (pH = 3, [H2O2] = 200 mg L−1, [Fe2+] = 125 mg L−1 and [DMAC] = 250 mg L−1 and [Na2SO4] = 7.1 g L−1). b: (pH = 3, [H2O2] = 1500 mg L−1, [Fe2+] = 500 mg L−1 and [DMAC] = 500 mg L−1 and [Na2SO4] = 7.1 g L−1). c: (pH = 3, [H2O2] = 4000 mg L−1, [Fe2+] = 1000 mg L−1 and [DMAC] = 1000 mg L−1 and [Na2SO4] = 7.1 g L−1). d: (pH = 3, [H2O2] = 2000 mg L−1, [Fe2+] = 5000 mg L−1 and [DMAC] = 2000 mg L−1 and [Na2SO4] = 7.1 g L−1).](/content/184/2022/15/11/img/10.1016_j.arabjc.2022.104229-fig12.png)
The effect of different current intensities on the removal of DMAC. a: (pH = 3, [H2O2] = 200 mg L−1, [Fe2+] = 125 mg L−1 and [DMAC] = 250 mg L−1 and [Na2SO4] = 7.1 g L−1). b: (pH = 3, [H2O2] = 1500 mg L−1, [Fe2+] = 500 mg L−1 and [DMAC] = 500 mg L−1 and [Na2SO4] = 7.1 g L−1). c: (pH = 3, [H2O2] = 4000 mg L−1, [Fe2+] = 1000 mg L−1 and [DMAC] = 1000 mg L−1 and [Na2SO4] = 7.1 g L−1). d: (pH = 3, [H2O2] = 2000 mg L−1, [Fe2+] = 5000 mg L−1 and [DMAC] = 2000 mg L−1 and [Na2SO4] = 7.1 g L−1).
The amount of iron cation production in the consumable electrode and also the efficiency of the anode electrode in this reactor can be calculated according to Faraday's law from Eq. (25) (Martínez-Huitle and Brillas, 2009):
In this equation, m is the amount of iron metal cation produced (g), M is the molecular weight of metals (g.mol−1), I the intensity of current (A), t the time of process (s), z the number of electrons transfer on the oxidation–reduction reaction (for ferrous ion:2), and F = 96487C.mol−1 is the Faraday constant. In this study, because the current intensity range was 0.25-2A, so the amount of iron cation produced is in the range of 0.52235–4.1788 g. Therefore, the amount of iron produced is seldom, and the electrode can be used for a long time.
3.2.4 Kinetics study of Electro-Fenton process under optimal conditions
As can be seen from the results of Table 4 and Table 5, according to the linear variations of kt = Ln (C/C0) in terms of time, it can be concluded that the kinetic equation of DMSO and DMAC wastewaters degradation in the first measured concentrations of 250 and 500 mg L−1 follows the pseudo-first-order. However, the DMSO and DMAC degradation equation is followed the pseudo-second-order at initial concentrations of 1000 and 2000 mg L−1, since the linear variations t= (1/C) - (1/C0) in time has a higher correlation coefficient. The reaction rate of the Electro-Fenton process at all different concentrations of pollutants is approximately-two to three times higher than the Fenton process.
The initial concentration of DMSO(mg.L-1)
pseudo-zero degree
pseudo-first degree
pseudo-second degree
250
k = 0.0078 mM.min-1
R2 = 0.9132k = 0.0222 min-1
R2 = 0.9879k = 0.1065 mM-1min-1
R2 = 0.8152
500
k = 0.0085 mM.min-1
R2 = 0.9471k = 0.0114 min-1
R2 = 0.9904mM-1min-1 k = 0.0173
R2 = 0.9554
1000
k = 0.0095 mM.min-1
R2 = 0.9257k = 0.0114 min-
R2 = 0.9858k = 0.0156 mM-1min-1
R2 = 0.9908
2000
k = 0.0073 mM.min-1
R2 = 0.9012k = 0.0107 min-1
R2 = 0.9722k = 0.0175 mM-1min-1
R2 = 0.9983
The initial concentration of DMAC(mg.L-1)
pseudo-zero degree
pseudo-first degree
pseudo-second degree
250
k = 0.0066 mM.min-1
R2 = 0.8489k = 0.0181 min-1
R2 = 0.9831k = 0.0678 mM-1min-1
R2 = 0.9695
500
k = 0.0057 mM.min-1
R2 = 0.8854k = 0.0138 min-1
R2 = 0.9795k = 0.0418 mM-1min-1
R2 = 0.9576
1000
k = 0.0132 mM.min-1
R2 = 0.8415k = 0.0195 min-1
R2 = 0.9636k = 0.0394 mM-1min-1
R2 = 0.9895
2000
k = 0.0159 mM.min-1
R2 = 0.8120k = 0.0154 min-1
R2 = 0.9493k = 0.0185 mM-1min-1
R2 = 0.9992
3.2.5 The effect of individual operational parameters on the elimination of DMSO and DMAC during the Electro-Fenton process
To determine the operational characteristics for DMSO and DMAC elimination on their own, the presence of electrodes and electrolyte alone (electrocoagulation process), Electro-Fenton without ferrous ion, and Electro-Fenton with ferrous ion was investigated. Figs. (12–13) depict the impact of operational characteristics on their own, as well as a synopsis of the outcomes of removing DMSO and DMAC of each operational variable. Iron cathodes are only involved in the reduction of ferric iron ions and the regeneration of ferrous iron ions, so the electrocoagulation process will take place when the amount of hydrogen peroxide in this reaction is zero. Electrocoagulation is one of the most widely used electrochemical methods and removes the contaminant in three consecutive steps without adding the coagulant to the aquatic environment, Step 1: Production of coagulant by oxidation of the sacrificial anode (usually aluminum or iron), Step 2: Instability of pollutants, and Step 3: Compression of unstable phase and clot production (Gomes et al., 2007). In this process, bubbles are also produced in both electrodes, which cause the contaminants to float, thus increasing the removal of contaminants (Yavuz et al., 2010). Eqs. (26–29) shows the reactions involved in the electrocoagulation process.![Effectiveness of synergistic components in the Electro-Fenton process (pH = 3, [H2O2] = 600 mg L−1, [Fe2+] = 500 mg L−1 and [DMSO] = 250 mg L−1, 0.5A, [Na2SO4] = 7.1 g L−1).](/content/184/2022/15/11/img/10.1016_j.arabjc.2022.104229-fig13.png)
Effectiveness of synergistic components in the Electro-Fenton process (pH = 3, [H2O2] = 600 mg L−1, [Fe2+] = 500 mg L−1 and [DMSO] = 250 mg L−1, 0.5A, [Na2SO4] = 7.1 g L−1).
![Effectiveness of synergistic components in the Electro-Fenton process (pH = 3, [H2O2] = 200 mg L−1, [Fe2+] = 125 mg L−1 and [DMAC] = 250 mg L−1, 0.5A, [Na2SO4] = 7.1 g L−1).](/content/184/2022/15/11/img/10.1016_j.arabjc.2022.104229-fig14.png)
Effectiveness of synergistic components in the Electro-Fenton process (pH = 3, [H2O2] = 200 mg L−1, [Fe2+] = 125 mg L−1 and [DMAC] = 250 mg L−1, 0.5A, [Na2SO4] = 7.1 g L−1).
To compare the processes of Electrocoagulation and Electro-Fenton, both processes took place under the same conditions. The Electro-Fenton approach combines the electrocoagulation process and the Fenton process to increase the process's ability to remove resistant organic compounds through oxidation and mineralization. By adding hydrogen peroxide to the electrocoagulation reactor and then the Fenton reagent, the efficiency of the process in the decomposition of organic compounds can be enhanced. Because in Electrocoagulation, the predominant elimination process involves coagulation and complex formation of coagulants with toxic organic compounds, but in the Electro-Fenton process, the predominant elimination process is oxidation with production radicals such as hydroxyl radical. Therefore, this process can break down organic compounds into minerals and, ultimately, water and carbon dioxide.
For example, as shown in Fig. 12, the electrocoagulation process at pH = 3 removes 10.69 % and 21.36 % of DMSO and DMAC, respectively, while adding hydrogen peroxide and then the Fenton reagent to the reactor, DMSO removal efficiency rises to 95.19 % and 98.06 % respectively. The Electro-Fenton process without ferrous ion can be a suitable alternative for the Electro-Fenton process with ferrous ion and is more cost-effective. This can be due to according to Eq. (26) that in the Electrocoagulation process with iron electrodes, large amounts of iron as a coagulant are produced at pH = 6.5–7. Subsequently, large numbers of Fe (OH)3 hydroxides are produced regarding Eq. (27), and by eliminating complexion and electrostatic attraction, the pollutant is removed. Actually, Fe (OH)3 is in its insoluble forms and can act as coagulant in the solution. However, in this study, to compare between processes, the Electrocoagulation process occurred at a pH = 3. In this pH, soluble Fe is the dominant species in the solution and Fe (OH)3 flocs are poorly produced, hence; cannot be used for Electrocoagulation.. On the other hand, OH– ions produced at the cathode electrode are neutralized by the H+ ions produced at the anode electrode and sufficient amount of Fe (OH)3 did not generated (Khataee et al., 2009). Therefore, the efficiency of the Electrocoagulation process decreased.
3.3 Photo-Electro-Fenton process
The photo-Electro-Fenton process is one of the advanced oxidation processes that has the advantages of both Photo-Fenton and Electro-Fenton processes for the purpose of eliminating organic chemicals permanently. In this method, the solution in Electro-Fenton conditions is simultaneously exposed to UV light to increase the rate of degradation of organic pollutants. Photo-Electro-Fenton processes are usually performed for two purposes: (1) Photolysis of ferric ion hydroxy complexes such as Fe(OH)2+ according to Eqs (4) and (5), (2) Improving ferrous ion recovery by photo reduction of ferric ions (Moreira et al., 2017). Therefore, in this process where UV light is present, pollutants are usually degraded by the photo reduction of Fe(OH)2+ complexes at pH = 3 according to Eq. (5). As a result, the regeneration of ferrous ion and hydroxyl radical increases according to Eqs. (3) and (5). The main reactions in the Photo-Electro-Fenton process are shown in Fig. 14. In this study, due to the use of sodium sulfate electrolyte, SO42- is converted to S2O8 2- near the anode, and according to Eq. (30), in the presence of UV light, it produces sulfate radical and improves the efficiency of elimination (Moreira et al., 2017).
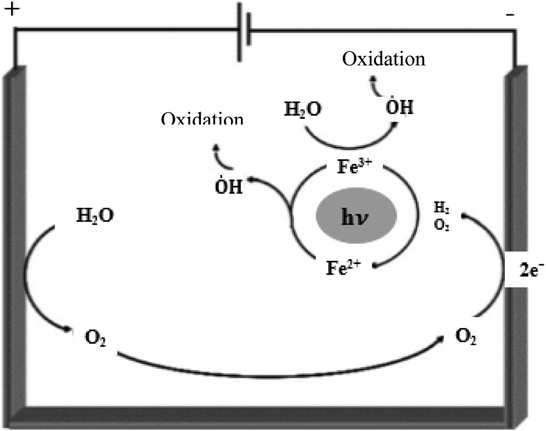
Production of hydroxyl radical by Electro-Fenton and Photo-Electro-Fenton processes (Peralta-Hernández et al., 2009).
The results of the Photo-Electro-Fenton process are shown in Figs. 15-16 and Table 6 for different DMSO and DMAC concentrations. The Photo-Electro-Fenton process had the highest yield only at a concentration of 1000 mg L−1 of DMSO contaminants and 500 mg L−1 of DMAC pollutants compared to other methods. In different concentrations, a decrease in efficiency was seen in the process due to the turbidity of the iron electrodes and the high amount of ferrous ions and hydrogen peroxide in the reaction medium.![The effect of Photo-Electro-Fenton process on the removal of DMSO. a: (pH = 3, [H2O2] = 600 mg L−1, [Fe2+] = 500 mg L−1, [DMSO] = 250 mg L−1, Three UVC lamps (24 W) and [Na2SO4] = 7.1 g L−1). b: (pH = 3, [H2O2] = 2000 mg L−1, [Fe2+] = 1500 mg L−1, [DMSO] = 500 mg L−1, Three UVC lamps (24 W) and [Na2SO4] = 7.1 g L−1). c: (pH = 3, [H2O2] = 4000 mg L−1, [Fe2+] = 3000 mg L−1, [DMSO] = 1000 mg L−1, Three UVC lamps (24 W) and [Na2SO4] = 7.1 g L−1). d: (pH = 3, [H2O2] = 8000 mg L−1, [Fe2+] = 4000 mg L−1, [DMSO] = 2000 mg L−1, Three UVC lamps (24 W) and [Na2SO4] = 7.1 g L−1).](/content/184/2022/15/11/img/10.1016_j.arabjc.2022.104229-fig16.png)
The effect of Photo-Electro-Fenton process on the removal of DMSO. a: (pH = 3, [H2O2] = 600 mg L−1, [Fe2+] = 500 mg L−1, [DMSO] = 250 mg L−1, Three UVC lamps (24 W) and [Na2SO4] = 7.1 g L−1). b: (pH = 3, [H2O2] = 2000 mg L−1, [Fe2+] = 1500 mg L−1, [DMSO] = 500 mg L−1, Three UVC lamps (24 W) and [Na2SO4] = 7.1 g L−1). c: (pH = 3, [H2O2] = 4000 mg L−1, [Fe2+] = 3000 mg L−1, [DMSO] = 1000 mg L−1, Three UVC lamps (24 W) and [Na2SO4] = 7.1 g L−1). d: (pH = 3, [H2O2] = 8000 mg L−1, [Fe2+] = 4000 mg L−1, [DMSO] = 2000 mg L−1, Three UVC lamps (24 W) and [Na2SO4] = 7.1 g L−1).
![The effect of Photo-Electro-Fenton process on the removal of DMAC. a: (pH = 3, [H2O2] = 200 mg L−1, [Fe2+] = 125 mg L−1, [DMAC] = 250 mg L−1, Three UVC lamps (24 W), and [Na2SO4] = 7.1 g L−1). b: (pH = 3, [H2O2] = 1500 mg L−1, [Fe2+] = 500 mg L−1, [DMAC] = 500 mg L−1, Three UVC lamps (24 W), and [Na2SO4] = 7.1 g L−1). c: (pH = 3, [H2O2] = 4000 mg L−1, [Fe2+] = 1000 mg L−1, [DMAC] = 1000 mg L−1, Three UVC lamps (24 W), and [Na2SO4] = 7.1 g L−1). d: (pH = 3, [H2O2] = 2000 mg L−1, [Fe2+] = 5000 mg L−1, [DMAC] = 2000 mg L−1, Three UVC lamps (24 W), and [Na2SO4] = 7.1 g L−1).](/content/184/2022/15/11/img/10.1016_j.arabjc.2022.104229-fig17.png)
The effect of Photo-Electro-Fenton process on the removal of DMAC. a: (pH = 3, [H2O2] = 200 mg L−1, [Fe2+] = 125 mg L−1, [DMAC] = 250 mg L−1, Three UVC lamps (24 W), and [Na2SO4] = 7.1 g L−1). b: (pH = 3, [H2O2] = 1500 mg L−1, [Fe2+] = 500 mg L−1, [DMAC] = 500 mg L−1, Three UVC lamps (24 W), and [Na2SO4] = 7.1 g L−1). c: (pH = 3, [H2O2] = 4000 mg L−1, [Fe2+] = 1000 mg L−1, [DMAC] = 1000 mg L−1, Three UVC lamps (24 W), and [Na2SO4] = 7.1 g L−1). d: (pH = 3, [H2O2] = 2000 mg L−1, [Fe2+] = 5000 mg L−1, [DMAC] = 2000 mg L−1, Three UVC lamps (24 W), and [Na2SO4] = 7.1 g L−1).
pollutants
Initial concentration of pollutant (mg.L-1)
Optimal concentration of Fe2+ (mg.L-1)
Optimal concentration of H2O2 (mg.L-1)
Optimal current intensity (A)
Removal of pollutant (%)
DMSO
250
500
600
0.5
92.59
500
1500
2000
0.5
92.18
1000
3000
4000
1
97.21
2000
4000
8000
0.5
97.67
DMAC
250
125
200
1
85.66
500
500
1500
0.5
98.99
1000
1000
4000
1
95.72
2000
5000
2000
1
97.56
3.3.1 Investigating the kinetics of Photo-Electro-Fenton process under best conditions
As shown in Table 7 and Table 8, given the linear variability of –Ln(C/C0) = kt in terms of time and the high linear correlation of the diagram with respect to the graph of changes in terms of time, it can be concluded that the equation of DMSO and DMAC degradation rate in the concentration of 250 and 500 mg L−1 follows the pseudo-first degree. But the DMSO and DMAC degradation rate equations in the 1000 and 2000 mg L−1 concentrations follow the pseudo-second degree because the linear changes (1/C) - (1/C0) = kt have a higher correlation coefficient over time. The reaction rate of the Photo-Electro-Fenton process at all different concentrations of pollutants is approximately-one to two times higher than the Fenton process.
The initial concentration of DMSO(mg.L-1)
pseudo-zero degree
pseudo-first degree
pseudo-second degree
250
k = 0.0065 mM.min-1
R2 = 0.9232k = 0.0121 min-1
R2 = 0.9876k = 0.0259 mM-1min-1
R2 = 0.9716
500
k = 0.0056 mM.min-1R2 = 0.9810
k = 0.0071 min-1R2 = 0.9923
k = 0.0094 mM-1min-1
R2 = 0.9818
1000
k = 0.0070 mM.min-1R2 = 0.9331
k = 0.0104 min-1R2 = 0.9794
k = 0.0170 mM-1min-1
R2 = 0.9950
2000
k = 0.0050 mM.min-1R2 = 0.9505
k = 0.0059 min-1R2 = 0.9767
k = 0.0071 mM-1min-1
R2 = 0.9916
The initial concentration of DMAC(mg.L-1)
pseudo-zero degree
pseudo-first degree
pseudo-second degree
250
k = 0.0040 mM.min-1
R2 = 0.9888k = 0.0065 min-1
R2 = 0.9991
k = 0.0112 mM-1min-1
R2 = 0.9859
500
k = 0.0064 mM.min-1
R2 = 0.8261k = 0.0217 min-1
R2 = 0.9829
k = 0.1176 mM-1min-1
R2 = 0.8850
1000
k = 0.0100 mM.min-1
R2 = 0.9282k = 0.0105 min-1
R2 = 0.9842
k = 0.0121 mM-1min-1
R2 = 0.9947
2000
k = 0.0148 mM.min-1
R2 = 0.8239k = 0.0120 min-1
R2 = 0.9483
k = 0.0110 mM-1min-1
R2 = 0.9883
3.4 Comparison between Fenton-based AOPs for treatment of DMSO and DMAC wastewaters
The intention of this section is to compare the mentioned hybrid Fenton processes (Photo-Fenton, Electro-Fento, Photo-Electro-Fenton) with our previous work for the treatment of DMSO and DMAC wastewaters with Fenton process (Behrouzeh et al., 2020). Figs. 17-18 depict a comparison between the efficiency of removal and mineralization of various hybrid Fenton processes for contaminants containing DMSO and DMAC. The lowest efficiency of removal and mineralization was observed in the Fenton process and the highest in the Electro-Fenton or Photo-Electro-Fenton processes according to the initial concentration of pollutants. These laboratory results showed that electricity and UV radiation improved the ability of the Fenton process to degrade and mineralize DMSO and DMAC pollutants. They also boost the rate of Fenton's reaction. The Photo-Electro-Fenton process was best known only at a concentration of 1000 mg L−1 of DMSO and 500 mg L−1 of DMAC. In other concentrations, the Electro-Fenton process was considered a better method.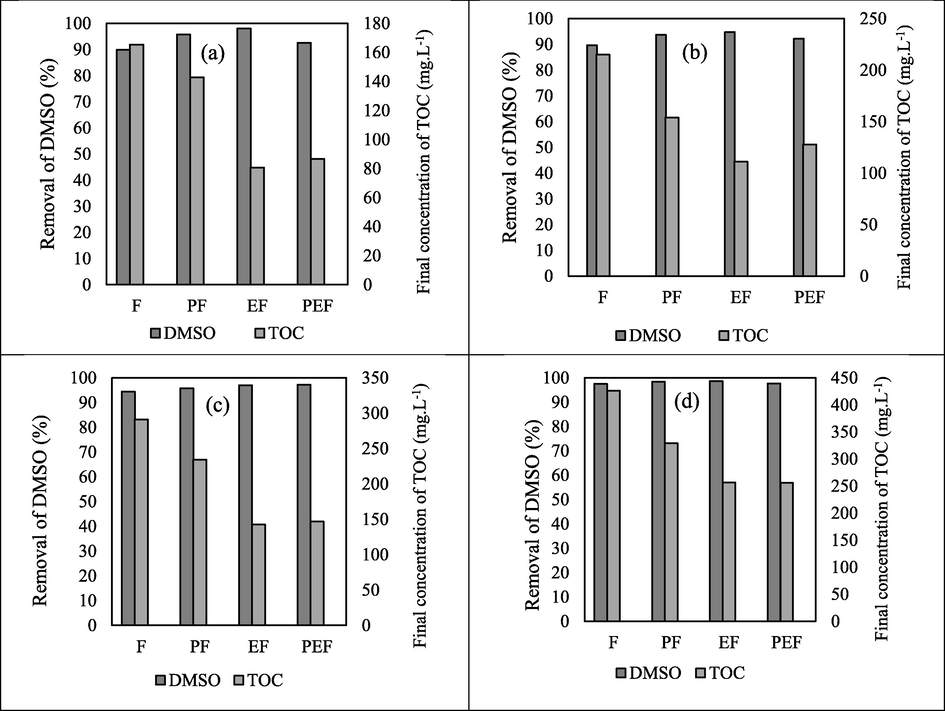
Comparison between Fenton hybrid processes (Photo-Fenton (PF), Electro-Fenton (EF), Photo-Electro-Fenton (PEF) and Fenton (F)) for DMSO pollutant treatment in best conditions. (a): 250 mg L−1. (b): 500 mg L−1. (c): 1000 mg L−1. (d): 2000 mg L−1.
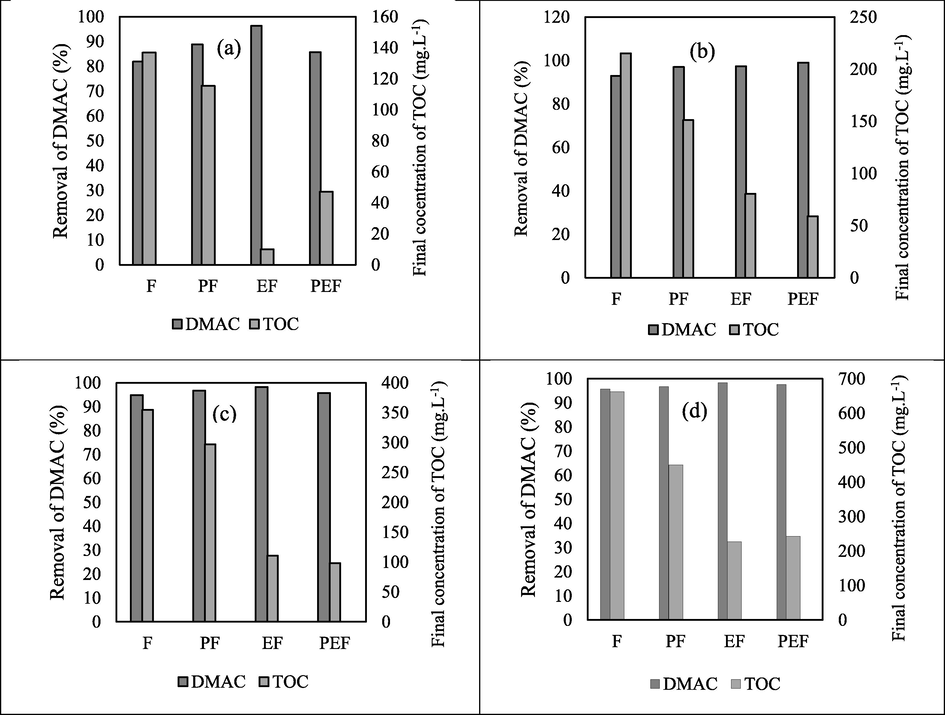
Comparison between Fenton hybrid processes ((Photo-Fenton (PF), Electro-Fenton (EF), Photo-Electro-Fenton (PEF) and Fenton (F)) for DMAC pollutant treatment in best conditions. (a): 250 mg L−1. (b): 500 mg L−1. (c): 1000 mg L−1. (d): 2000 mg L−1.
In fact, advanced oxidation hybrid processes reduce contaminant degradation to some extent, but some carbon compounds (TOC) remain in the water, which can be removed by complementary methods such as adsorption process. Clearly, advanced oxidation processes can perform the purification process well at low concentrations. We all know that a combination of hybrid treatment processes such as advanced oxidation, adsorption or membrane processes are required for complete treatment of effluents containing DMSO and DMAC to meet general standards for discharge of environmental pollutants. In future work, we will follow these hybrid processes with low concentrations of 10 mg/L. The reason for choosing 250 mg/L as the minimum concentration was based on our previous paper (Behrouzeh et al., 2020), and the minimum concentration of effluents of DMSO and DMAC industries was chosen based on scientific sources. In fact, with considering the problems of biological processes in the treatment of DMSO and DMAC effluents, the huge volume of these contaminants is treated using advanced oxidation processes, and the remaining contamination is eliminated through complementary processes such as adsorption process, membrane process, etc. However, it is a valuable proposition that the enormous volume of pollution was treated by a cost-effective process in the future, and advanced oxidation processes can be used as the final complementary process for the treatment of DMSO and DMAC with concentration less than 10 mg/L that also reduce the cost of the process.
4 Conclusion
In this research, wastewater containing DMSO and DMAC was treated using Fenton-based AOPs, including Photo-Fenton, Electro-Fenton, and Photo-Electro-Fenton processes. The effects of various parameters like initial DMSO and DMAC concentrations, initial pH, reaction time, different concentrations of Fenton’s reagent, power of UV lamp, concentrations of electrolytes, the distance between electrodes, and also current intensity were investigated. Process efficiency in terms of degradation of pollutants and removal of TOC was compared among different processes. As part of the study, the kinetics of reaction were also examined for various concentrations at optimal conditions, and the reaction order was determined based on the best fit. Experiments indicated that the ideal reaction time was 120 min, with a pH of 3. At 2000 mg L−1 of DMSO, maximum degradation (98.64 %) and ultimate concentration of TOC (256.8 mg L−1) were obtained by Electro-Fenton process when optimum conditions were 4000 mg L−1 of Fe2+, 8000 mg L−1 of H2O2, and 0.5 A of current. At 250 mg L−1 of DMAC, maximum degradation (96.31 %) and the TOC's final concentration (10.03 mg L−1) were obtained by the Electro-Fenton process when best conditions were 125 mg L−1 of Fe2+, 200 mg L−1 of H2O2, 1 A of current. Finally, it can be concluded that the Electro-Fenton process is the best process for the efficient removal of DMSO and DMAC. The second step of the kinetic model followed a pseudo-first-order reaction for 250, 500 mg L−1 of pollutants and was fitted with a pseudo-second-order kinetics for concentrations of 1000, 2000 mg L−1.
CRediT authorship contribution statement
Maryam Behrouzeh: Investigation, Visualization, Formal analysis. Mohammad Mehdi Parivazh: Conceptualization, Formal analysis, Methodology, Validation, Writing - review & editing. Elnaz Danesh: Writing – review & editing. Mohammad Javad Dianat: Resources. Mohsen Abbasi: Conceptualization, Writing – review & editing, Project administration. Shahriar Osfouri: Methodology, Writing – review & editing. Amir Rostami: Conceptualization, Methodology, Validation, Writing – review & editing. Mika Sillanpää: Writing – review & editing. Mahdieh Dibaj: Writing – review & editing. Mohammad Akrami: Conceptualization, Writing – review & editing.
Acknowledgment
The authors acknowledge the water and wastewater of Bushehr province company, Iran for their financial support.
Declaration of Competing Interest
The authors declare that they have no known competing financial interests or personal relationships that could have appeared to influence the work reported in this paper.
References
- Evaluation of two types of TiO2-based catalysts by photodegradation of DMSO in aqueous suspension. J. Photochem. Photobiol. A: Chem.. 2009;202:164-171.
- [Google Scholar]
- Industrial wastewater treated by galvanic, galvanic Fenton, and hydrogen peroxide systems. J. Water Process Eng.. 2018;22:1-12.
- [Google Scholar]
- Detoxification of water and wastewater by advanced oxidation processes. Sci. Total Environ.. 2019;696:133961
- [Google Scholar]
- Treatment of DMSO and DMAC wastewaters of various industries by employing Fenton process: Process performance and kinetics study. J. Environ. Chem. Eng.. 2020;8:103597
- [Google Scholar]
- Degradation of dimethyl sulfoxide through fluidized-bed Fenton process: kinetic analysis. Int. J. Environ. Sci. Technol.. 2016;13:1017-1028.
- [Google Scholar]
- Removal of COD from TFT-LCD wastewater by electro-Fenton technology using a tubular reactor. J. Environ. Eng.. 2017;143:04017018.
- [Google Scholar]
- Treatment of thin film transistor-liquid crystal display (TFT-LCD) wastewater by the electro-Fenton process. Sep. Purif. Technol.. 2015;145:104-112.
- [Google Scholar]
- Comparison of dimethyl sulfoxide degradation by different Fenton processes. Chem. Eng. J.. 2013;232:418-424.
- [Google Scholar]
- Study on Autocatalytic Decomposition of Dimethyl Sulfoxide (DMSO) Org. Process Res. Dev.. 2020;24:1614-1620.
- [Google Scholar]
- Kinetic study of the factors controlling Fenton-promoted destruction of a non-biodegradable dye. Desalination. 2010;257:124-128.
- [Google Scholar]
- Electrochemical advanced oxidation processes (EAOPs) as alternative treatment techniques for carwash wastewater reclamation. Chemosphere. 2018;211:998-1006.
- [Google Scholar]
- Study on degradation behavior of N, N-dimethylacetamide by photocatalytic oxidation in aqueous TiO2 suspensions. Desalin. Water Treat.. 2012;42:274-278.
- [Google Scholar]
- Arsenic removal by electrocoagulation using combined Al–Fe electrode system and characterization of products. J. Hazard. Mater.. 2007;139:220-231.
- [Google Scholar]
- Removal of organophosphorus pesticides from water by electrogenerated Fenton's reagent. Environ. Chem. Lett.. 2003;1:165-168.
- [Google Scholar]
- Degradation of dimethyl-sulfoxide-containing wastewater using airlift bioreactor by polyvinyl-alcohol-immobilized cell beads. Bioresour. Technol.. 2011;102:5609-5616.
- [Google Scholar]
- Electro-Fenton process for water and wastewater treatment. Crit. Rev. Environ. Sci. Technol.. 2017;47:2100-2131.
- [Google Scholar]
- A comparative study on the removal of dimethyl sulfoxide from water using microbubbles and millibubbles of ozone. J. Water Process Eng.. 2021;40:101937
- [Google Scholar]
- Decolorization of CI Acid Blue 9 solution by UV/Nano-TiO2, Fenton, Fenton-like, electro-Fenton and electrocoagulation processes: a comparative study. J. Hazard. Mater.. 2009;161:1225-1233.
- [Google Scholar]
- Isolation of dimethyl sulfone-degrading microorganisms and application to odorless degradation of dimethyl sulfoxide. J. Biosci. Bioeng.. 2004;97:82-84.
- [Google Scholar]
- A novel treatment technique for DMSO wastewater. IEEE Trans. Semicond. Manuf.. 1998;11:3-8.
- [Google Scholar]
- Kinetics and mechanisms of DMSO (dimethylsulfoxide) degradation by UV/H2O2 process. Water Res.. 2004;38:2579-2588.
- [Google Scholar]
- Biological treatment of thin-film transistor liquid crystal display (TFT-LCD) wastewater using aerobic and anoxic/oxic sequencing batch reactors. Chemosphere. 2010;81:57-64.
- [Google Scholar]
- Hydroxyl radical intensified Cu 2 O NPs/H 2 O 2 process in ceramic membrane reactor for degradation on DMAc wastewater from polymeric membrane manufacturer. Front. Environ. Sci. Eng.. 2020;14:1-12.
- [Google Scholar]
- Organics, sulfates and ammonia removal from acrylic fiber manufacturing wastewater using a combined Fenton-UASB (2 phase)-SBR system. Bioresour. Technol.. 2011;102:10319-10326.
- [Google Scholar]
- Oxidation of dimethyl sulfoxide in aqueous solution using microbubbles. Ind. Eng. Chem. Res.. 2009;48:8048-8053.
- [Google Scholar]
- Decontamination of wastewaters containing synthetic organic dyes by electrochemical methods: a general review. Appl. Catal. B: Environ.. 2009;87:105-145.
- [Google Scholar]
- Degradation of dimethyl sulfoxide through fluidized-bed Fenton process. J. Hazard. Mater.. 2015;300:218-226.
- [Google Scholar]
- Electrochemical advanced oxidation processes: a review on their application to synthetic and real wastewaters. Appl. Catal. B: Environ.. 2017;202:217-261.
- [Google Scholar]
- Degradation of dimethyl sulfoxide by the immobilized cells of Hyphomicrobium denitrificans WU-K217. Biochem. Eng. J.. 2003;15:199-204.
- [Google Scholar]
- Biological treatment of wastewater containing dimethyl sulphoxide from the semi-conductor industry. Process Biochem.. 2001;36:579-589.
- [Google Scholar]
- Recent advances in the application of electro-Fenton and photoelectro-Fenton process for removal of synthetic dyes in wastewater treatment. J. Environ. Eng. Manage.. 2009;19:257-265.
- [Google Scholar]
- B. Qiu, “Removal of N, N-dimethylacetamide from Water by Adsorption,” University of Waterloo, 2017.
- Advanced oxidation processes for the removal of natural organic matter from drinking water sources: a comprehensive review. J. Environ. Manage.. 2018;208 pp. 5c6-76
- [Google Scholar]
- “Highly efficient AuPd/carbon nanotube nanocatalysts for the electro-Fenton process”. Chem.–Eur. J.. 2015;21:7611-7620.
- [Google Scholar]
- Kinetics of 2, 6-dimethylaniline degradation by electro-Fenton process. J. Hazard. Mater.. 2009;161:1484-1490.
- [Google Scholar]
- On-line spectrophotometric method for the determination of optimum operation parameters on the decolorization of Acid Red 66 and Direct Blue 71 from aqueous solution by Fenton process. Chem. Eng. J.. 2012;181:431-442.
- [Google Scholar]
- M. Walker, DMSO: nature's healer: Penguin, 1992.
- Oxidation of DMSO on goethite catalyst in the presence of H2O2 at neutral pH. Catal. Commun.. 2006;7:901-906.
- [Google Scholar]
- Degradation of DMSO by ozone-based advanced oxidation processes. J. Hazard. Mater.. 2007;149:218-225.
- [Google Scholar]
- Treatment of petroleum refinery wastewater by electrochemical methods. Desalination. 2010;258:201-205.
- [Google Scholar]
- Simultaneous thermal activation of persulfate/fenton system for high-concentration N, N-dimethylacetamide degradation: parameter optimization and degradation mechanism. Environ. Eng. Sci.. 2019;36:12-22.
- [Google Scholar]


