

Translate this page into:
Appraisal of wild fig fruits for nutra-pharmaceutical and biological attributes
⁎Corresponding author. mnavedahmad@yahoo.com (Naveed Ahmad)
-
Received: ,
Accepted: ,
This article was originally published by Elsevier and was migrated to Scientific Scholar after the change of Publisher.
Peer review under responsibility of King Saud University.
Abstract
The fruits of wild fig, native to Soon valley of Pakistan, were appraised for phenolic compounds and high-value nutrients. These fruits were shade-dried and extracted with different solvents of varying polarity to recover a wide range of antioxidant components, where hydroxyethanol exhibited highest extraction yield of antioxidant compounds. Among others, hydroxyethanol-derived crude concentration extracts (CCEs) and phenolic rich fractions (PRFs) showed greater amount of total phenolic, flavonoids and superior biological properties. The fruits of tested fruits were found to possess potassium (11.34 g/kg) and calcium (4.19 g/kg) as major elements, glucose (5.63g/100g DW) as dominant natural sugar and acetic acid (2.40 mg/100 g of dry matter) as principal organic acid. There was a considerable (p < 0.05) variation in phenolic content and biological properties of various extracts recovered with different solvents. Furthermore, the biological properties of tested fruits were found to be significantly correlated with their intrinsic total phenolic content (TPC) and total flavonoid content (TFC). Based upon the findings of present study, the fruits of wild fig could be treated as promising source of beneficial nutrients and potent phenolic components for their applications in the development of nutrapharmaceuticals.
Keywords
Wild fig
Phenolic bioactive profiling
Biological attributes
Nutra-pharmaceuticals

1 Introduction
Reactive oxygen species (ROS) and free radicals can initiate oxidation in lipid molecules which is associated with the loss of organoleptic and nutritive properties of various food stuffs (Manian et al., 2008). The prevalence of different disorders including aging, metabolic syndromes, inflammations and cardiovascular disorders is directly linked to these radicals (Anwar et al., 2013). Antioxidant molecules have been documented to control the process of lipid oxidation. Due to the perceived toxic effects of synthetic antioxidants, scientists have been searching for safer plant-based-natural antioxidants with multiple medicinal properties.
Different plants and plant-derived foods are propitious source of folk medicine in different civilizations due to availability of potent secondary metabolites including phenolic and flavonoid compounds (Irfan et al., 2021). These plant bioactives are used to regulate and maintain different bodily functions (Manzoor et al., 2013) by representing their antagonistic effect against different ailments including aging, metabolic disorders, and inflammations (Noori et al., 2022). The issues of food security and public health with rapidly expanding population of the world, prompt us to explore vast resources of under-utilized parts (leaves, bark, fruits, roots and stem) of wild plants for important phytonutrients and bioactives which are essential to maintain the physiological functions in living organisms (Shahidi, 2009).
Pakistan has a variety of plant species for biological prospecting. Various types of medicinal flora have been found to be wildly grown in different areas of Pakistan which are extensively employed in traditional folk medicine due to their intrinsic phytonutrients and potent medicinal compounds (Ramadan et al., 2012). In this context, the fruits of wild fig are potential candidates for the exploration of valuable phytonutrients and bioactives with multiple therapeutic applications. Fig (Ficus carica L.), member of Moraceae family, is native to Syria and Iran. This fruit crop spread to other regions by humans. It grows in dry and warm climates. Its fruits can be used in fresh and dried form; however, its dried form is very popular in the world as the process of drying can enhance its stability by preserving its nutrients. Fig fruits have widely been utilized as food and medicine due to its nutrients including organic acids, individual sugars, different vitamins, important minerals and amino acids. There is no fat and cholesterol in the fruits of fig tree (Lazreg Aref et al., 2011). The natural potent antioxidants in figs have been believed to offer shielding effect to plasma proteins against oxidative stress and consequently the antioxidant attributes of plasma is enhanced (Vinson et al., 2005). The diet containing fig fruits has been published as one the healthiest food which is directly linked with longevity (Trichopoulou et al., 2006).
Due to the medicinal value of phenolic components and existing gap of scientific information motivated us to evaluate wild fruits for phytonutrients and phenolic compounds. The main objective of this project was to study the fruits of wild fig for beneficial nutrients, phenolic compounds and their biological characteristics.
2 Material and methods
2.1 Pretreatment, extraction and fractionation
The ripened fruits of wild fig were collected from Soon valley, district Khushab, Punjab, Pakistan (geographical coordinates: 32o58/N 72o15/E, lowest temperature: 1 °C, highest temperature: 36 °C and annual rainfall: 50 cm). Prior to experimental procedure, collected fruit samples were authenticated by a taxonomist, then washed with tap water and shade-dried. These dried fruits (10.0 g) were milled and immersed in different solvents (100 mL) of varying polarity including absolute methanol, aqueous methanol (80:20, methanol:water), absolute ethanol, aqueous ethanol (80:20, ethanol:water), absolute acetone and aqueous acetone (80:20, acetone:water) for five days to extract bioactives (Ahmad et al., 2011).
After separating insoluble residual biomass through filtration (Whatman, 8µ), recovered extracts were freed from solvents under vacuum using rotovap (EYELA, Tokyo, Japan) to have CCEs which were further fractioned to produce PRFs (Maheshwari et al., 2011). Briefly, each CCE (5 g) was reconstituted in distilled water (100 mL) and processed for sequential extraction with n-hexane (100 mL) to eliminate non-polar components while ethyl acetate (100 mL) was used to purify phenolic bioactives. The additional solvent from each ethyl acetate extract was detached under vacuum using rotavapor to yield phenolic rich fraction (PRF). The recovered CCEs/PRFs were stored at −20 °C.
2.2 Total phenolic content (TPC)
The CCEs/PRFs of tested fruits were analyzed for TPC using Folin reagent method (Singleton and Rossi, 1965). TPC in different CCEs/PRFs were presented as gallic acid equivalents (GAE g per 100 g dry matter). Standards and samples were run in triplicate under same experimental protocols.
2.3 Total flavonoids content (TFC)
The CCEs/PRFs of tested fruits were analyzed for presence of TFC (Zhishen et al., 1999, Zhuang et al., 1992). TFC was given as catechin equivalents (CE g/100 g of dry matter). Standards and samples were run in triplicate under same experimental protocols.
2.4 Antioxidant properties
Antioxidant properties of different CCEs/PRFs, derived from the tested fruits, were assessed by employing various in-vitro antioxidant assays such as radical scavenging ability, reducing capacity and inhibition of peroxidation in lipid. Tepe et al. (2005) was used for DPPH radical scavenging activity (as IC50 value). Reducing capacity was calculated using a protocol described by Yen et al. (2000). Tested extracts were appraised to retard the formation of peroxide in lipids following a method described by Ahmad et al. (2011). This inhibition potential directly correlated with antioxidant capacity of various CCEs/PRFs. All treatments and positive control were run under same experimental protocols.
2.5 Antimicrobial activity
Antimicrobial attributes of tested CCEs/PRFs were performed out against different infective microbes (Bacillus cereus, Escerichia coli, Staphylococcus aureus, Aspergilus niger, Aspergilus flavus and Fusarium oxysporum) using micro dilution broth and disc diffusion methods (NCCLS, 1999, 1997). Bacterial and fungal strains were cultured on nutrient agar (37 °C) and potato dextrose agar (29 °C), respectively. Standard drugs and negative control were also run under same experimental protocols. The growth inhibition zones (mm) of each tested microbe was measured.
Microbial (fungus and bacteria) cultures were grown on nutrient broth (37 °C) and sabouraud dextrose broth (29 °C), respectively, to assess minimal inhibitory concentration (MIC). Sterility control (CCE/PRF + NB + Tween 80), positive control (microbial culture only) and growth control (NB + Tween 80) were also executed under same experimental protocols. MIC value of CCE/PRF can be calculated by finding its lowest concentration that inhibited microbial growth completely.
2.6 Quantification of minerals
The evaluation of valuable minerals in tested fruits was done using inductively coupled plasma-optical emission spectroscopy (ICP-OES) (Link et al., 1998). USEPA method (3051A) was employed for the digestion of sample with a digestion mixture (concentrated HCl: concentrated HNO3, 1:3) in microwave oven at 182 °C for 9.5 mins followed by cooling, filtration, centrifugation and dilution of final reaction mixture with water to required volume for ICP-OES analysis. High-purity water (18 MΩ cm) was used to prepare standard and sample’s solutions.
2.7 Analysis of organic acids and individual sugars
According to Mahmood et al. (2012), tested fruits were appraised for the presence of organic acid and individual sugars. Briefly, the fruit juice was obtained by blending fresh aliquot (10 g) of fruits with distilled water (20 mL) in electrical blender (Deuron, GL-109) which was spun (3000 g) and then filtered (0.25 µm) to remove the suspended debris. Organic acid profiling of tested fruits juice was carried out by analyzing on HPLC (Varian Pro star, USA) equipped with UV–vis detector and RP-C18 column (250 × 2.0 mm × 1/4″) while individual sugars were estimated by analyzing on HPLC (Shimadzu, Japan) where amino packing column and refractive index detector (10A) were employed. Water was used as diluent in sugar analysis.
2.8 Other biological activities
The tested CCEs/PRFs were evaluated for inhibition of biofilm produced by different bacterial strains (S. aureus and E. coli) (Stepanović et al., 2000). Haemolytic and antithrombotic capacity of tested extracts/fractions were estimated by spectrophotometer method (Yang et al., 2005) and Prasad et al., (2006), respectively.
2.9 Statistical analysis
All the treatments were conducted in three replicates unless stated otherwise and data thus produced was statistically analyzed by analysis of variance (ANOVA) using STATISTICA 5.5 (Stat SoftInc, Tulsa, Oklahoma, USA) software. P ≥ 0.05 was taken as probability value to indicate statistically significant difference.
3 Results and discussion
3.1 Extraction yield
Fruits of wild fig were extracted with a range of extracting solvents to recover extractable bioactives of varying polarity. The yield of CCEs (g/100 g) were determined to vary considerably in the range of 3.88–53.25 %. Hydroxyethanol recovered the highest yield (53.25 %) and the lowest yield (3.88 %) was extracted with absolute acetone. The tested fruit’s CCE are in crude form and thus contain some moieties of interfering components that offer resistance to detect and consequently alter their antioxidant properties. Therefore, these interfering impurities were removed from CCEs by sequential liquid–liquid extraction (LLE) to get PRFs whose yield was found to range from 2.70 g/100 g to 19.00 g/100 g of CCE. The maximum yield (19.00 %) was recovered from ethanolic CCE while hydroxymethanolic CCE produced the lowest yield (2.70 %) of PRF (Table 1). Values (mean ± SD) are average of three replicates, analyzed individually. Different superscripts in a column denotes significant differences (p < 0.05) of mean among various solvents.
Solvents
Yield (g/100 g)
TPC (GAE g/100 g)
TFC (CE g/100 g)
CCE
PRF
CCE
PRF
CCE
PRF
Methanol
36.10 ± 1.16 d
7.40 ± 0.67b
1.33 ± 0.10b
2.49 ± 0.28b
0.13 ± 0.02a
0.35 ± 0.03b
Hydroxymethanol
53.25 ± 2.14a
2.70 ± 0.35c
1.22 ± 0.07ab
2.24 ± 0.19b
0.11 ± 0.04ab
0.36 ± 0.07b
Ethanol
39.12 ± 1.03c
19.00 ± 1.36a
1.34 ± 0.08b
2.74 ± 0.21b
0.07 ± 0.03b
0.40 ± 0.11ab
Hydroxyethanol
49.63 ± 2.13b
8.90 ± 0.86b
1.87 ± 0.07a
3.80 ± 0.35a
0.13 ± 0.06a
0.53 ± 0.04a
Acetone
3.88 ± 0.41f
---
0.07 ± 0.01d
---
0.01 ± 0.01c
---
Hydroxyacetone
7.63 ± 0.52e
---
0.12 ± 0.03c
---
0.02 ± 0.01c
---
Hydroxyethanol recovered higher amount of bioactives from tested fruits exhibiting its superior efficacy as compared to other extracting solvents. The yield of bioactives using different solvents was varied significantly (p < 0.05). Manzoor et al., (2013) and Shabir et al., (2011) showed higher efficiency of hydroxymethanol and hydroxyethanol to extract bioactives from different plant matrices. In this analysis, the efficiency of hydroxymethanol and hydroxyethanol was found to be better than other extracting solvents for optimum recovery of antioxidant molecule from tested fruits.
Soni et al. (2014) recovered the yield (11.47 %) of crude extract from the fruits of fig using methanol which is in lesser quantity compared to methanolic extract of current analysis. This difference in extraction yield has been attributed to various factors including agroclimatic conditions, type of soil and content of bioactive components (Mahmood et al., 2012).
3.2 Total phenolic content (TPC) and total flavonoids content (TFC)
The antioxidant activity of various plants is attributed to the natural occurrence of physiologically active components including flavonoid and phenolic components in them (Katalinic et al., 2006). Due to antioxidant activity, plants have extensive application in food industry. TPC and TFC in tested CCEs/PRFs were calculated to be varied from 0.07 to 1.87 % GAE and 0.01 to 0.13 % CE, respectively. Hydroxyethanol-derived CCE exhibited maximum TPC (1.87 % GAE) and TFC (0.13 % CE) and acetone-derived CCE displayed the lowest of TPC (0.07 % GAE) and TFC (0.01 % CE). (Table 1).
As a result of fractionation of tested fruit’ crude extracts, impurities were removed to produce PRFs in which TPC and TFC varied in the range of 2.24–3.80 GAE (%) and 0.35–0.53 CE (%), respectively. The maximum TPC (3.80 % GAE) and TFC (0.53 % CE) was exhibited by PRF derived from hydroxyethanolic CCE, while the lowest TPC (2.24 % GAE) and TFC (0.35 % CE) was displayed by PRF derive from hydroxymethanolic CCE, respectively. TPC was considerably (p < 0.05) varied in CCEs/PRFs, extracted with different solvents from tested fruits. In this analysis, phenolic components in PRFs were found to be significantly enhanced (3–4 times) than their corresponding CCEs which is ascribed to the successful fractionation CCEs through LLE.
The determination of TPC and TFC from tested fruits was scarce. The results of TPC of wild fig fruit was higher when compared to those of various cultivars of fig fruits by, (Nakilcioğlu and Hışıl, 2013), (Çalişkan and Aytekin Polat, 2011), (Bey et al., 2013) and (Soni et al., 2014), nevertheless, lesser to results of Pourghayoumi et al. (2012). TFC in fig fruits was in lesser quantity than the results reported by (Nakilcioğlu and Hışıl, 2013). These differences in concentration of TPC and TFC in various plant matrices can be associated to different factors including genetics, harvesting season, maturity stage and agro-climatic regions.
3.3 Reducing capacity
The CCEs/PRFs, recovered with different extracting solvents from fig fruits, were explored for their ability to reduce iron (III) into iron (II) by phenolic compounds in them which have been documented to behave like reducing agents to convert ferric into ferrous (Joshi et al., 2010). Therefore, reducing ability (antioxidant attributes) of plant matrices might be correlated to phenolic identities in them (Zou et al., 2004). By enhancing the concentration of CCEs/PRFs, a regular increase in its reducing capacity was recorded (Table 2). There was a notable (p < 0.05) difference in the reducing capacities of tested CCEs/PRFs. Similar trends of enhanced reducing capacity with increasing concentration of extracts was also recorded by Ahmad et al., (2011). Explanations as given in Table 1.
Solvents
Reducing Power (λ = 700 nm)
IC50 value (mg/mL)
Inhibition of peroxidation (%)
5 mg
10 mg
15 mg
20 mg
Methanol
CCE
0.25 ± 0.04
0.77 ± 0.06
0.95 ± 0.02
1.10 ± 0.07
0.51 ± 0.07b
59.16 ± 3.81b
PRF
0.55 ± 0.04
0.64 ± 0.07
0.71 ± 0.02
0.93 ± 0.04
0.23 ± 0.04a
72.20 ± 2.39ab
Hydroxymethanol
CCE
0.22 ± 0.03
0.39 ± 0.04
0.52 ± 0.04
0.64 ± 0.05
0.34 ± 0.04c
63.35 ± 3.57a
PRF
0.55 ± 0.07
0.59 ± 0.02
0.86 ± 0.05
0.93 ± 0.07
0.16 ± 0.03b
74.11 ± 2.58ab
Ethanol
CCE
0.21 ± 0.01
0.36 ± 0.05
0.51 ± 0.03
0.64 ± 0.04
0.28 ± 0.05c
58.37 ± 2.72b
PRF
0.70 ± 0.03
0.84 ± 0.04
0.86 ± 0.07
0.89 ± 0.03
0.08 ± 0.03c
70.46 ± 2.16b
Hydroxyethanol
CCE
0.20 ± 0.05
0.43 ± 0.02
0.53 ± 0.04
0.70 ± 0.02
0.15 ± 0.03d
65.88 ± 3.37a
PRF
0.54 ± 0.05
0.58 ± 0.06
0.82 ± 0.06
0.95 ± 0.02
0.04 ± 0.01d
82.22 ± 1.96a
Acetone
CCE
0.09 ± 0.02
0.21 ± 0.01
0.31 ± 0.02
0.40 ± 0.01
1.96 ± 1.41 a
37.05 ± 1.87d
PRF
–
–
–
–
–
–
Hydroxyacetone
CCE
0.09 ± 0.01
0.14 ± 0.02
0.21 ± 0.01
0.27 ± 0.03
0.61 ± 0.09b
43.63 ± 2.49c
PRF
–
–
–
–
–
–
3.4 Free radical scavenging ability
DPPH is stable free radical whose λmax falls in visible region (515–528 nm) that turns to yellow by accepting hydrogen from phenolic component present in plant extract. Therefore, free radical scavenging capacity has been documented to be enhanced with the increase of bioactives in the extract (Larrauri et al., 1999). Wild fig’s CCEs/PRFs were explored for their ability to scavenge free radical and the results thus obtained were presented as IC50 values that ranged from 0.15 to 1.96 mg/mL and 0.04 to 0.23 mg/mL, respectively (Table 2).
The hydroxyethanol-derived CCE/PRF showed lowest IC50 value (0.15 mg/mL, 0.04 mg/mL) representing their maximum radical scavenging capacity compared to other extracts/fractions. BHT was also run along with other treatments and its radical scavenging ability was found to be higher than those of investigated CCEs/PRFs. PRFs of tested fruits exhibited higher (p < 0.05) free radical capacity (0.04–0.23 mg/mL) compared to CCEs (0.15–1.96 mg/mL) showing their higher antioxidant attributes which is ascribed to greater amount of phenolics in them as a result of successful fractionation of CCEs. The capacity of plant extract to scavenge free radicals has been found to be directly associated with their phenolic content (Siddhuraju et al., 2002).
Wild fig fruit’s CCEs/PRFs were evaluated for the first timeevaluated to scavenge free radical. The antioxidant properties (IC50 value) of tested fruit was lower compared to the results of Uddin, (2013), Faleh et al. (2012), Nakilcioğlu and Hışıl. (2013) and Pourghayoumi et al. (2012). These differences in DPPH radical scavenging ability of various plant matrices can be associated to different factors including genetics, harvesting season, maturity stage and agro-climatic regions.
3.5 Inhibition of lipid peroxidation
The oxidation of lipids produces peroxides which combine with thiocyanate to give a complex (λmax = 500 nm). The tested CCEs/PRFs were appraised to hinder the formation of peroxide in lipids which were found to vary over the range of 37.05–65.88 % and 70.46–82.22 %, respectively. Hydroxyethanol-derived CCE/PRF inhibited the formation of peroxides to the highest levels 65.88 % and 82.22 %, respectively, while the minimum potential was observed for acetone-derived CCE (37.05 %) and ethanolic PRF (70.46 %). Hydroxyethanolic CCE/PRF of tested fruits were found to hinder the formation of peroxides in linoleic acid representing their higher antioxidant properties which is positively correlated with occurrence of higher amount of phenolics in them. Positive control (BHT) was also processed with other treatments to retard the formation of peroxides in linoleic acid which was found to be higher (92.01 %) than other tested CCEs/PRFs of tested fruits. PRFs exhibited superior inhibition potential than those of CCEs, which is an indication of successful fractionation of CCEs to purify phenolic identities. The findings of this study could not be compared with others due to unavailability of reports in the literature.
3.6 Antimicrobial attributes
The occurrence of potent antimicrobial compounds in plants makes them applicable in folk medicinal system to cure different ailments (Ahmad et al., 2011; Hussain et al., 2011, 2008). In order to detect these potential medicinal compounds, antimicrobial properties of CCEs/PRFs were determined by performing disc diffusion plate assay and measurement of MIC values (Table 3). The lowest concentration of bioactive component with minimum microbial growth is referred as MIC (Walsh et al., 2003). Explanations as given in Table 1.
Solvents
Zone of inhibition (mm)
MIC (µg/mL)
CCE
PRF
CCE
PRF
S. aureus
E.coli
B. cereus
S. aureus
E.coli
B. cereus
S. aureus
E.coli
B. cereus
S. aureus
E.coli
B. cereus
Methanol
12.0 ± 0.4abc
10.0 ± 0.6 cd
9.0 ± 0.4ad
15.0 ± 0.9bc
11.0 ± 0.8be
10.0 ± 0.5ad
217 ± 9b c
241 ± 9aa
225 ± 7cb
193 ± 12aba
214 ± 9a a
229 ± 11aa
Hydroxymehanol
15.0 ± 0.3bbc
14.0 ± 0.7bbc
11.0 ± 0.6bc
16.0 ± 0.8bcd
16.0 ± 0.7ac
12.0 ± 0.7bc
182 ± 10bd
211 ± 9abc
264 ± 9aa
172 ± 8ab
184 ± 7ab
210 ± 9abab
Ethanol
15.0 ± 0.4a bc
13.0 ± 0.8bc
9.0 ± 0.5ad
17.0 ± 0.6abcd
14.0 ± 0.6ad
10.0 ± 0.8bd
195 ± 10abcd
207 ± 9ac
231 ± 7cb
177 ± 5abb
197 ± 9aab
225 ± 8ba
Hydroxyethanol
17.0 ± 0.7ab
16.0 ± 0.9bb
13.0 ± 0.7ab
18.0 ± 0.9abb
20.0 ± 1.1ab
14.0 ± 0.6ab
190 ± 8bcd
194 ± 8bd
211 ± 5bc
168 ± 8bb
152 ± 6abc
194 ± 9c b
Acetone
7.0 ± 0.2bd
9.0 ± 0.5ad
6.0 ± 0.3be
–
–
–
247 ± 9aba
223 ± 8cb
258 ± 8ba
–
–
–
Hydroxyacetone
7.0 ± 0.3b d
10.0 ± 0.4abd
7.0 ± 0.3be
–
–
–
231 ± 9abb
216 ± 9bbc
237 ± 7bb
–
–
–
Rifamycin
24a
26a
18a
24a
26a
18a
124e
96e
146e
124c
96d
146c
The tested CCEs/PRFs were assessed to be most effective against S. aureus with bigger inhibition zone (7–17 mm and 15–18 mm) and crossponding lower MIC values (182–247 µg/mL and 168–193 µg/mL), respectively. Among others, hydroxymethanolic CCE/PRF showed lowest MIC value (182 µg/mL and 172 µg/mL) representing their maximum antibacterial properties against S. aureus, while acetone derived extracts showed minimum antibacterial attributes with higher MIC value (223–258 µg/mL). Positive control was also processed under similar set of experimental conditions of treatments and exhibited higher (p < 0.05) antibacterial potential compared to tested CCEs/PRFs.
The tested CCEs/PRFs were most effective against F. oxysporum with bigger zone of inhibition (6–17 mm and 11–18 mm) and corresponding lower MIC values (187–273 µg/mL and 169–209 µg/mL), respectively. CCEs/PRFs showed lowest antifungal properties against A. flavus with smaller zone of inhibition (6–12 mm; 11–14 mm) with greater MIC (206–280 µg/mL; 201–245 µg/mL), respectively (Table 4). In comparison to others, hydroxyethanolic CCE/PRF exhibited maximum antifungal attributes indicating higher concentration of intrinsic bioactive compounds. Various biological properties including antioxidant and antimicrobial potential of different plants have been linked with the natural occurrence of bioactives in them (Ahmad et al., 2011). Explanations as given in Table 1.
Solvents
Zone of inhibition (mm)
MIC(µg/mL)
CCE
PRF
CCE
PRF
A. niger
A. flavus
F. oxysporum
A. niger
A. flavus
F. oxysporum
A. niger
A. flavus
F. oxysporum
A. niger
A. flavus
F. oxysporum
Methanol
8.0 ± 0.6bde
10.0 ± 0.8ac
10.0 ± 0.8ae
10.0 ± 0.8bd
11.0 ± 0.8bc
11.0 ± 0.6ae
268 ± 8ab
257 ± 10a b
243 ± 10bb
229 ± 8ab
218 ± 9ab
209 ± 8ca
Hydoxymethanol
14.0 ± 0.8b c
11.0 ± 0.8bbc
15.0 ± 0.9ac
11.0 ± 0.7bd
14.0 ± 0.9bb
16.0 ± 0.9ac
217 ± 11ac
229 ± 8ac
209 ± 8bc
256 ± 10aa
201 ± 7ac
188 ± 6bb
Ethanol
9.0 ± 0.7 cd
9.0 ± 0.7bc
12.0 ± 0.9ad
13.0 ± 0.6bc
10.0 ± 0.8bc
14.0 ± 0.5ad
251 ± 12abc
234 ± 11ac
205 ± 9bc
208 ± 11ac
245 ± 6aa
194 ± 5bab
Hydroxyethanol
16.0 ± 0.8ab
12.0 ± 0.9bb
17.0 ± 1.1ab
17.0 ± 0.8a b
13.0 ± 0.8ab
18.0 ± 0.7ab
198 ± 7abd
206 ± 13b d
187 ± 6bd
183 ± 7bd
221 ± 8abb
169 ± 5 cc
Acetone
3.0 ± 0.4cf
9.0 ± 0.5a c
6.0 ± 0.4ag
–
–
–
327 ± 11aa
251 ± 9bb
273 ± 8ca
–
–
–
Hydroxyacetone
7.0 ± 0.8be
6.0 ± 0.3bd
8.0 ± 0.5af
–
–
–
269 ± 9a b
280 ± 10aa
248 ± 9cb
–
–
–
Fluconazole
23a
24a
20a
23a
24a
20a
134e
126f
160e
134d
126d
160c
3.7 Inhibition of biofilm formation
Different bacterial strains have been known to exhibit biofilm formation for their improved resistance against a variety of antibiotics which is serious environmental and health concerns. Isolation of different medicines from plant matrices have gained the attention of scientists to control various infectious diseases caused by multiple-drug resistant bacterial strains (Prabu et al., 2006).
In this experiment, tested CCEs/PRFs were applied against E. coli and S. aureus to retard biofilm formation and their efficacy was found to vary from 26.15 to 78.34 % and 63.29 to 80.71 %, respectively (Table 5). The maximum biofilm inhibition potential (76.16–78.34 % and 72.67–80.71 %) was expressed by CCE/PRF, recovered with hydroxyethanol, and acetone-derived CCE (26.15–45.93 %)/methanolic PRF (63.29–66.13 %) showed the lowest potential to inhibit biofilm formation compared to other extracts/fractions. Hydroxyethanolic CCE/PRF showed better biofilm inhibition potential which might be associated with the occurrence of higher phenolic contents. Due to the pre-concentration, PRFs exhibited superior biofilm inhibition potential than CCEs. The rifamycin (reference drug) showed higher inhibition potential (87.91–89.43 %) compared to tested CCEs/PRFs. The findings of this study could not be compared with others due to unavailability of reports in the literature. Explanations as given in Table 1.
Solvents
Biofilm inhibition (%)
Hemolytic potential (%)
Thrombolytic capacity (%)
CCEs
PRFs
CCEs
PRFs
CCEs
PRFs
S.aureus
E.coli
S.aureus
E.coli
Methanol
64.13 ± 1.45acd
61.09 ± 1.73bd
66.13 ± 1.74bd
63.29 ± 1.56bd
2.83 ± 0.10b
2.51 ± 0.08b
40.31 ± 1.75 cd
43.51 ± 1.51c
Hydroxymethanol
68.71 ± 1.88bc
70.31 ± 1.91abc
72.10 ± 1.92bc
71.32 ± 1.70bb
2.22 ± 0.13 cd
2.72 ± 0.03a
42.51 ± 1.01c
51.81 ± 1.61b
Ethanol
74.16 ± 1.52abc
67.31 ± 1.95abcd
80.43 ± 2.02a b
68.52 ± 1.56ac
2.39 ± 0.12c
2.56 ± 0.05b
47.32 ± 1.40b
49.32 ± 1.57b
Hydroxyethanol
78.34 ± 1.60ab
76.16 ± 2.25ab
80.71 ± 1.88ab
72.67 ± 1.21abb
2.17 ± 0.10d
2.56 ± 0.06b
55.21 ± 1.65a
66.52 ± 1.72a
Acetone
26.15 ± 1.19ce
45.93 ± 2.04be
–
–
3.32 ± 0.11a
–
38.74 ± 0.79d
–
Hydroxyacetone
41.09 ± 1.70bd
62.45 ± 1.69ad
–
–
2.94 ± 0.15b
–
39.09 ± 1.05d
–
Control (Rifamycin)
87.91 ± 4.12a
89.43 ± 3.94a
87.91 ± 4.12a
89.43 ± 3.94a
–
–
–
–
PBS
–
–
–
–
1.54
–
Triton X-100
–
–
–
–
100
–
Water
–
–
–
–
–
3.84
Streptokinase
–
–
–
–
–
92.34
3.8 Thrombolytic efficiency
The use of synthetics drugs to cure the problem of thrombus in living organisms has some severe health concerns. Therefore, a variety of medicinal plants have been explored to exhibit their potential to treat thrombus which might be associated to the occurrence of potent biological active components (Mclaughlin et al., 1998, Maheshwari et al., 2011).
Tested CCEs/PRFs were evaluated for thrombolytic potential which ranged from 38.74 to 55.21 % and 43.51 to 66.52 %, respectively (Table 5), where hydroxyethanolic CCE (55.21 %) and PRF (66.52 %) showed highest thrombolytic efficiency and the lowest thrombolytic activity was exhibited by acetone-derived CCE (38.74 %) and methanolic PRF (43.51 %). Due to its enhanced phenolic contents, the thrombolytic ability of hydroxyethanolic CCE/PRF was also higher when compared to other extracts/fractions. Furthermore, thrombolytic activity of PRFs has been noted to be higher in comparison to their crossponding CCEs which might be attributed to purification/fractionation of CCEs. Standard drug (streptokinase) was also processed along with other treatments and its thrombolytic potential (87.91–89.43 %) was higher than tested CCEs/PRFs of wild fig fruits. The findings of this study could not be compared as there is no report available on thrombolytic activity of wild fig fruits.
3.9 Haemolytic capacity
Erythrocytes are one of the most important types of blood cell which are used to deliver oxygen and drug molecules to different body tissues (Hamidi and Tajerzadeh, 2003). Oxidative stress has been found to produce hemolysis by damaging the erythrocyte (Ko et al., 1997). Tested CCEs/PRFs were examined for hemolysis which was found to be in the range of 2.17 to 3.32 % and 2.51to 2.72 %, respectively, where lowest hemolysis (2.17 %) was exhibited by ethanolic CCE and the highest (3.32 %) was displayed by acetone-derived CCE, compared to other tested CCEs. Among other PRFs, the minimum hemolysis (2.51 %) was recorded for methanolic PRF and highest hemolysis (2.72 %) was showed by hydroxymethanolic PRF (Table 5).
The damaging effect of tested PRFs on erythrocytes was found to be 1–2.50 times lower when compared to those of CCEs which might be linked with improved phenolic content. The hemolytic potential of PBS (1.54 %) was observed to be lower than CCEs/PRFs of tested fruits.
3.10 Individual sugars and organic acid profiling
Organoleptic characteristics of different plant-derived food is attributed to its individual sugars and organic acids. The concentration of organic acids and individual sugars were found to fluctuate in different phases of maturation (Zhang et al., 2021).
The fruits of wild fig were evaluated for individual sugars and organic acids. Glucose (5.63 %) was detected as the most dominant individual sugar followed by fructose (0.98 %) (Fig. 1). According to the results of present analysis, acetic acid was recorded as major organic acid (2.40 mg/100 g DW) with relatively lower concentration of citric, malic, gluconic and oxalic acids (Tables 6). The varying concentration of organic acids has been documented in different plant based foods due to varietal and difference in weather conditions of experimental sites (Poyrazoğlu et al., 2002). The findings of current assay recommended the consumption of tested fruits as a excellent source of organic acids and natural sugars. Explanations as given in Table 1. ND: not determined.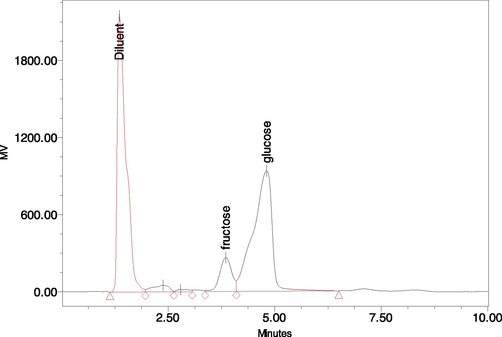
Estimation of individual sugars in Fig fruit.
Sugar content (g/100 g DW)
Organic acid (mg/100 g)
Glucose
Sucrose
Galactose
Fructose
Succinic acid
Gluconic acid
Malic acid
Oxalic acid
Citric acid
Acetic acid
5.63 ± 0.32
ND
ND
0.98 ± 0.19
ND
0.12 ± 0.02
0.02 ± 0.01
0.02 ± 0.01
0.05 ± 0.02
2.40 ± 0.07
Slatnar et al. (2011) analyzed fruits of fig cultivars from Slovenia to contain malic (0.52–9.07 g/kg) and citric acids (1.36–10.54 g/kg), respectively. Malic acid (9.89–32.64 %), oxalic acid (1.11–8.54 %) and citric acid (53.06–84.97 %) were found to be present as principal organic acids in Japanese fig cultivars fruit’s juice (Shiraishi et al., 1996).
3.11 Estimation of minerals
The tested fruits were appraised for the presence of useful minerals. Potassium (11339.22 mg/kg) and calcium (4193.69 mg/kg) were detected as major minerals and substantial concentration of other high-value minerals including sodium, magnesium, phosphorus and iron were also present in tested fruits (Tables 7). Sodium and potassium have been reported to be present in the body at suitable concentration for optimum blood pressure (NRC, 1989). The findings of this analysis support the optimum use of tested fruits as a potential source of nutrients for smooth functioning of different physiological processes. Valvi and Rathod, (2011) reported the occurrence of potassium (1922 mg/100 g) as principal mineral along with significant amount of other important minerals including calcium, sodium, iron and magnesium in Indian fig fruit cultivars. Explanations as given in Table 1. ND: Not Detected.
Elements
Concentration (mg/kg)
Elements
Concentration (mg/kg)
Al
109.50 ± 6.54
Se
2.47 ± 0.04
Ca
4193.69 ± 64.02
Cu
6.52 ± 0.07
Ba
5.44 ± 0.09
Cr
1.11 ± 0.02
Mg
2084.74 ± 24.15
Na
217.72 ± 11.25
La
0.31 ± 0.02
Fe
115.43 ± 9.85
Mn
10.76 ± 1.12
B
20.52 ± 5.64
Ni
1.75 ± 0.03
Be
ND
Sr
42.78 ± 4.6
Co
0.05 ± 0.01
Zn
11.53 ± 2.21
P
655.17 ± 19.64
K
11339.22 ± 129
Sb
0.77 ± 0.02
Ti
ND
Si
133.10 ± 7.98
Cd
0.06 ± 0.01
V
ND
Pb
2.57 ± 0.02
3.12 Correlation analysis
According to Pearson method (P = 0.001), a strong positive correlation was observed between bioactive components (TPC and TFC) and its biological potential including antimicrobial, inhibition capacity, thrombolytic and biofilm activities (P = 0.614–0.867, 0.804, 0.785 and 0.324–0.787), (P = 0.586–0.891, 0.710, 0.782, 0.245–0.685), however, strong negative correlation was also recorded for haemolysis and IC50 value (P = -0.523, −0.762), (P = -0.386, −0.674), respectively (Tables 8, 9). Our research group (Ahmad et al., 2016) reported the presence of eight phenolic acid and flavonoids in tested fruits, therefore the tested biological attributes are directly associated with its TPC and TFC. **Correlation is significant at the 0.01 level. *Correlation is significant at the 0.05 level. **Correlation is significant at the 0.01 level. *Correlation is significant at the 0.05 level.
TPC
IC50 Value
Inhibition Potential
Antibacterial activity
Antifungal activity
Biofilm inhibition
Hemolytic activity
Thrombolytic activity
S.aureus
E.coli
B. cereus
A. niger
A. flavus
F. oxysporum
S. aureus
E.coli
TPC
1
IC50 Value
-0.762**
1
Inhibition Potential
0.804**
-0.807**
1
Antibacterial (S.aureus)
0.890**
-0.829**
0.841**
1
Antibacterial (E.coli)
0.759**
-0.816**
0.852**
0.792**
1
Antibacterial (B. cereus)
0.702**
-0.717**
0.547**
0.703**
0.621**
1
Antifungal (A. niger)
0.816**
-0.813**
0.864**
0.859**
0.845**
0.749**
1
Antifungal (A. flavus)
0.526*
-0.641**
0.810**
0.614**
0.695**
0.618**
0.719**
1
Antifungal (F. oxysporum)
0.754**
-0.841**
0.787**
0.802**
0.826**
0.749**
0.867**
0.687**
1
Biofilm inhibition (S. aureus)
0.787**
-0.749**
0.820**
0.817**
0.896**
0.658**
0.895**
0.644**
0.814**
1
Biofilm inhibition (E.coli)
0.324
-0.201
0.182
0.112
0.144
0.178
0.060
-0.145
0.215
0.167
1
Hemolytic activity
-0.523*
0.758**
-0.689**
-0.582**
-0.781**
-0.458
-0.695**
-0.632**
-0.687**
-0.682**
-0.198
1
Thrombolytic activity
0.785**
-0.751**
0.627**
0.773**
0.657**
0.805**
0.689**
0.690**
0.759**
0.652**
0.120
-0.436*
1
TFC
IC50 Value
Inhibition Potential
Antibacterial activity
Antifungal activity
Biofilm inhibition
Hemolytic activity
Thrombolytic activity
S.aureus
E.coli
B. cereus
A. niger
A. flavus
F. oxysporum
S. aureus
E.coli
TFC
1
IC50 Value
-0.674**
1
Inhibition Potential
0.710**
-0.741**
1
Antibacterial (S.aureus)
0.769**
-0.765**
0.877**
1
Antibacterial (E.coli)
0.701**
-0.875**
0.891**
0.815**
1
Antibacterial (B. cereus)
0.725**
-0.715**
0.586**
0.670**
0.667**
1
Antifungal (A. niger)
0.733**
-0.870**
0.890**
0.878**
0.879**
0.718**
1
Antifungal (A. flavus)
0.409*
-0.659**
0.776**
0.649**
0.732**
0.597**
0.715**
1
Antifungal (F. oxysporum)
0.697**
-0.875**
0.795**
0.781**
0.847**
0.791**
0.887**
0.782**
1
Biofilm inhibition (S. aureus)
0.685**
-0.897**
0.864**
0.851**
0.879**
0.686**
0.901**
0.680**
0.879**
1
Biofilm inhibition (E.coli)
0.245
-0.141
0.124
0.101
0.131
0.158
0.081
-0.214
0.218
0.179
1
Hemolytic activity
-0.386
0.782**
-0.685**
-0.589**
-0.752**
-0.478
-0.643**
-0.587**
-0.694**
-0.740**
-0.180
1
Thrombolytic activity
0.782**
-0.659**
0.594**
0.761**
0.684**
0.847**
0.708**
0.688**
0.747**
0.718**
0.124
-0.454*
1
4 Conclusions
The fruits of wild fig have been evaluated for high-value nutrients and potent bioactives that contributed significantly to their biological potential (determined rarely before). Potassium and calcium along with considerable amount of other essential nutrients, gluconic acid and glucose were also detected as major organic acid and individual sugar in tested fruits. Among other extracting solvents, aqueous-ethanolic CCEs/PRFs showed higher TPC, TFC and biological attributes. These biological properties of tested fruits are significantly correlated with their TPC and TFC. The findings of this study suggest the consumption of the fruits of wild fig as a potential source of valuable phytonutrients and potent bioactives in the development of nutrapharmaceuticals.
Funding
This research was funded by Princess Nourah bint Abdulrahman University Researchers Supporting Project number (PNURSP2023R158), Princess Nourah bint Abdulrahman University, Riyadh, Saudi Arabia.
Acknowledgement
The authors express their gratitude to Princess Nourah bint Abdulrahman University Researchers Supporting Project number (PNURSP2023R158), Princess Nourah bint Abdulrahman University, Riyadh, Saudi Arabia.
Declaration of Competing Interest
The authors declare that they have no known competing financial interests or personal relationships that could have appeared to influence the work reported in this paper.
References
- Antioxidant and antimicrobial attributes of different solvent extracts from leaves and flowers of akk [Calotropis procera (Ait.) Ait. F.)] J. Med. Plant Res.. 2011;5:4879-4887.
- [Google Scholar]
- Characterization of free and conjugated phenolic compounds in fruits of selected wild plants. Food Chem.. 2016;190:80-89.
- [CrossRef] [Google Scholar]
- Enzyme-aided cold pressing of flaxseed (Linum usitatissimum L.): Enhancement in yield, quality and phenolics of the oil. Grasas y Aceites. 2013;64:463-471.
- [CrossRef] [Google Scholar]
- Optimization of phenolic compound recovery and antioxidant activity of light and dark dried fig (Ficus carica L.) varieties. Food Sci. Biotechnol.. 2013;22:1613-1619.
- [CrossRef] [Google Scholar]
- Phytochemical and antioxidant properties of selected fig (Ficus carica L.) accessions from the eastern Mediterranean region of Turkey. Sci. Hortic. (Amsterdam). 2011;128:473-478.
- [CrossRef] [Google Scholar]
- Influence of Tunisian Ficus carica fruit variability in phenolic profiles and in vitro radical scavenging potential. Rev. Bras. Farmacogn.. 2012;22:1282-1289.
- [CrossRef] [Google Scholar]
- Carrier erythrocytes: An overview. Drug Deliv. J. Deliv. Target. Ther. Agents. 2003;10:9-20.
- [CrossRef] [Google Scholar]
- Chemical composition, antioxidant and antimicrobial activities of basil (Ocimum basilicum) essential oils depends on seasonal variations. Food Chem.. 2008;108:986-995.
- [CrossRef] [Google Scholar]
- Antioxidant attributes of four Lamiaceae essential oils. Pakistan J. Bot.. 2011;43:1315-1321.
- [Google Scholar]
- Phenolic and flavonoid contents in Malva sylvestris and exploration of active drugs as antioxidant and anti-COVID19 by quantum chemical and molecular docking studies. J. Saudi Chem. Soc.. 2021;25:101277
- [CrossRef] [Google Scholar]
- Antioxidant and antibacterial activities of the leaf essential oils of Himalayan Lauraceae species. Food Chem. Toxicol.. 2010;48:37-40.
- [CrossRef] [Google Scholar]
- Screening of 70 medicinal plant extracts for antioxidant capacity and total phenols. Food Chem.. 2006;94:550-557.
- [CrossRef] [Google Scholar]
- Protection of oxidative hemolysis by demethyldiisoeugenol in normal and β-thalassemic red blood cells. Free Radic. Biol. Med.. 1997;22:215-222.
- [CrossRef] [Google Scholar]
- Free radical scavenging capacity in the aging of selected red spanish wines. J. Agric. Food Chem.. 1999;47:1603-1606.
- [CrossRef] [Google Scholar]
- In vitro cytotoxic and antiviral activities of Ficus carica latex extracts. Nat. Prod. Res.. 2011;25:310-319.
- [CrossRef] [Google Scholar]
- Development and validation of the new EPA microwave-assisted leach method 3051A. Environ. Sci. Technol.. 1998;32:3628-3632.
- [CrossRef] [Google Scholar]
- Antioxidant and hepatoprotective activities of phenolic rich fraction of Seabuckthorn (Hippophae rhamnoides L.) leaves. Food Chem. Toxicol.. 2011;49:2422-2428.
- [CrossRef] [Google Scholar]
- Effect of maturity on phenolics (Phenolic acids and flavonoids) profile of strawberry cultivars and mulberry species from Pakistan. Int. J. Mol. Sci.. 2012;13:4591-4607.
- [CrossRef] [Google Scholar]
- The antioxidant activity and free radical scavenging potential of two different solvent extracts of Camellia sinensis (L.) O. Kuntz, Ficus bengalensis L. and Ficus racemosa L. Food Chem.. 2008;107:1000-1007.
- [CrossRef] [Google Scholar]
- Variation of phenolics and antioxidant activity between peel and pulp parts of pear (Pyrus communis L.) fruit. Pakistan J. Bot.. 2013;45:1521-1525.
- [Google Scholar]
- The use of biological assays to evaluate botanicals. Ther. Innov. Regul. Sci.. 1998;32:513-524.
- [CrossRef] [Google Scholar]
- Research on the Phenolic Compounds in Sarilop (Ficus Carica L.) Fig Variety (in English) Gida. 2013;38:267-274.
- [CrossRef] [Google Scholar]
- NCCLS, 1997. National Committee for Clinical Laboratory Standards (NCCLS). Approved Standard M2 A6, 1997, fifth ed. NCCLS: Wayne, PA.
- NCCLS, 1999. National Committee for Clinical Laboratory Standards (NCCLS). M100-S9., 1999, NCCLS: Wayne, PA.
- Determination of secondary metabolites including curcumin in Rheum ribes L. and surveying of its antioxidant and anticancer activity. J. Saudi Chem. Soc.. 2022;26:101479
- [CrossRef] [Google Scholar]
- NRC, 1989. National Research Council. Recommended dietary allowances., 1989, (10th ed.). Washington: National Academy Press. 1989.
- Effect of pollen source on quantitative and qualitative characteristics of dried figs (Ficus carica L.) cvs “Payves” and “Sabz” in Kazerun - Iran. Sci. Hortic. (Amsterdam). 2012;147:98-104.
- [CrossRef] [Google Scholar]
- Organic Acids and Phenolic Compounds in Pomegranates (Punica granatum L.) Grown in Turkey. J. Food Compos. Anal.. 2002;15:567-575.
- [CrossRef] [Google Scholar]
- Guaijaverin - A plant flavonoid as potential antiplaque agent against Streptococcus mutans. J. Appl. Microbiol.. 2006;101:487-495.
- [CrossRef] [Google Scholar]
- Development of an in vitro model to study clot lysis activity of thrombolytic drugs. Thromb. J.. 2006;4:9-12.
- [CrossRef] [Google Scholar]
- Evaluation of the safety and antioxidant activities of Crocus sativus and Propolis ethanolic extracts. J. Saudi Chem. Soc.. 2012;16:13-21.
- [CrossRef] [Google Scholar]
- Antioxidant and antimicrobial attributes and phenolics of different solvent extracts from leaves, flowers and bark of gold mohar [Delonix regia (Bojer ex Hook.) Raf.] Molecules. 2011;16:7302-7319.
- [CrossRef] [Google Scholar]
- Nutraceuticals and functional foods: Whole versus processed foods. Trends Food Sci. Technol.. 2009;20:376-387.
- [CrossRef] [Google Scholar]
- Shiraishi, S., Kawakami, K., Widodo, S.E., Shiraishi, M., Kitazaki, M., John, S., 1996. Organic Acid Profiles in the Juice of Fig Fruits Literature of fig (83 ∼∼ s carica L .) has been voluminously documented since a long time ago (Condit and Enderud, 1956), and almost all well-known fig varieties have been well described (Condit, 1955 40, 29–33.
- Studies on the antioxidant activity of Indian Laburnum (Cassia fistula L.): A preliminary assessment of crude extracts from stem bark, leaves, flowers and fruit pulp. Food Chem.. 2002;79:61-67.
- [CrossRef] [Google Scholar]
- Colorimetry of total phenolics with phosphomolybdic-phosphotungstic acid reagents. Am J Enol Vitic. 1965;16:144-158.
- [Google Scholar]
- Effect of Drying of Figs (Ficus carica L.) on the Contents of Sugars, Organic Acids, and Phenolic Compounds. J. Agric. Food Chem.. 2011;59:11696-11702.
- [Google Scholar]
- “Estimation of nutritional, phytochemical, antioxidant and antibacterial activity of dried fig (Ficus carica)”. ∼ 158 ∼. J. Pharmacogn. Phytochem.. 2014;3:158-165.
- [Google Scholar]
- A modified microtiter-plate test for quantification of staphylococcal biofilm formation. J. Microbiol. Methods. 2000;40:175-179.
- [CrossRef] [Google Scholar]
- Antimicrobial and antioxidant activities of the essential oil and various extracts of Salvia tomentosa Miller (Lamiaceae) Food Chem.. 2005;90:333-340.
- [CrossRef] [Google Scholar]
- Traditional foods: Why and how to sustain them. Trends Food Sci. Technol.. 2006;17:498-504.
- [CrossRef] [Google Scholar]
- DPPH Scavenging Assay of Eighty Four Bangladeshi Medicinal Plants. IOSR J. Pharm. Biol. Sci.. 2013;6:66-73.
- [CrossRef] [Google Scholar]
- Mineral composition of some wild edible fruits MINERAL COMPOSITION OF SOME WILD EDIBLE FRUITS FROM. Biol, J Appl Tech, Phar. 2011;2:392-396.
- [Google Scholar]
- Dried Fruits: Excellent in Vitro and in Vivo Antioxidants. J. Am. Coll. Nutr.. 2005;24:44-50.
- [CrossRef] [Google Scholar]
- Activity and mechanisms of action of selected biocidal agents on Gram-positive and -negative bacteria. J. Appl. Microbiol.. 2003;94:240-247.
- [CrossRef] [Google Scholar]
- Haemolytic activities and adjuvant effect of Astragalus membranaceus saponins (AMS) on the immune responses to ovalbumin in mice. Vaccine. 2005;23:5196-5203.
- [CrossRef] [Google Scholar]
- Antioxidant activity of anthraquinones and anthrone. Food Chem.. 2000;70:437-441.
- [CrossRef] [Google Scholar]
- Changes in the content of organic acids and expression analysis of citric acid accumulation-related genes during fruit development of yellow (Passiflora edulis f. flavicarpa) and purple (passiflora edulis f. edulis) passion fruits. Int. J. Mol. Sci.. 2021;22
- [CrossRef] [Google Scholar]
- The determination of ûavonoid contents in mulberry and their scavenging effects on superoxide radicals. Food Chemistry. 1999;64:555-559.
- [Google Scholar]
- Extraction and determination of flavonoid in ginkgo. Chinese Herbal Medicine. 1992;23:122-124.
- [Google Scholar]
- Antioxidant activity of a flavonoid-rich extract of Hypericum perforatum L. in vitro. J. Agric. Food Chem.. 2004;52:5032-5039.
- [CrossRef] [Google Scholar]


