

Translate this page into:
Atenolol sequestration using activated carbon derived from gasified Glyricidia sepium
⁎Corresponding author. chazmier@usm.my (Mohd Azmier Ahmad)
-
Received: ,
Accepted: ,
This article was originally published by Elsevier and was migrated to Scientific Scholar after the change of Publisher.
Peer review under responsibility of King Saud University.
Abstract
Activated carbon (AC) derived from gasified Glyricidia sepium woodchip (GGSWAC) was prepared using KOH and CO2 activation via microwave radiation technique to remove atenolol (ATN) from aqueous solution. The surface area (SBET) and total pore volume (TPV) of GGSWAC were 483.07 m2/g and 0.255 cm3, respectively. The n-BET model fits well with the isothermal data indicating a multilayer adsorption with the saturation capacity of 121, 143 and 163 mg/g at 30, 45 and 60 °C, respectively. The kinetic study showed that ATN adsorption followed Avrami model equation (R2 ≅ 0.99). Based on the thermodynamic parameters, the adsorption of ATN onto GGSWAC was endothermic (ΔHS = 234.17 kJ/mol) in the first layer of adsorption and exothermic in the subsequent layer (ΔHL = −165.62 kJ/mol). The ATN adsorption was controlled by both diffusion and chemisorption. In continuous operation, the Thomas (R2 = 0.9822) and Yoon–Nelson (R2 = 0.9817) models successfully predicted the ATN adsorption.
Keywords
Adsorption
Activated carbon
Atenolol
Multilayer adsorption
Glyricidia sepium

1 Introduction
Atenolol (ATN) has been broadly used to treat hypertension, chest pain, cardiovascular diseases, as well as heart rhythm problem (arrhythmias) (Dehdashti et al., 2019). Approximately 50% of the administered dose is excreted through urine, with 90% still in the form of active compound (Haro et al., 2017). The widespread consumption of ATN and its limited metabolic function in the human body resulted in a large presence of this drug in the wastewater and surface waters. The existence of these drugs in the aquatic environment can affect heart rate, reproduction and growth of some aquatic species (Massarsky et al., 2011). To reduce the potential risk caused by ATN to aquatic environment, its removal is significantly important. Compared to other processes, adsorption has several advantages including high removal performance, simple operation, low operation cost, and no intermediates and by-products generation which makes it more attractive means of wastewater treatment (Jang and Kan, 2018). Few reported studies on ATN adsorption include the application of corncob (Fu et al., 2020), clay (Chang et al., 2019), nanoparticles (Hayasi and Saadatjoo, 2018), palm kernel shell (To et al., 2017), graphene oxide (Kyzas et al., 2015), kaolinite (Hu et al., 2014), apple tree branches (Marques et al., 2018) and commercial AC (Sotelo et al., 2012).
To date, there have been no reported studies on ATN removal using carbon residues from biomass gasification plants (GC). The growth of gasification industry, which was anticipated to increase up to US $126 Billion by 2023 will create a substantial increase in solid waste management problem. Hence, it is beneficial to develop the GC as a precursor for activated carbon (AC). The research on GC application in adsorption is very rare, despite its high potential as an adsorbent in water and wastewater treatment applications (Jung et al., 2019). Several reported literatures regarding its application in adsorption includes phosphate and nitrate removal (Kilpimaa et al., 2014, 2015), nickel, iron and copper removal (Runtti et al., 2014), rhodamine B removal (Maneerung et al., 2016); congo red and crystal violet removal (Jung et al., 2019), toluene removal (Bhandari et al., 2014), malachite green removal (Ahmad et al., 2020), and acetaminophen and caffeine removal (Galhetas et al., 2014a, 2014b).
This study aimed to synthesize AC using the less explored material (GC residue from biomass gasification plant) and examine its characteristic and ATN removal efficiency. The study was conducted both in batch and continuous operation to investigate the equilibrium and kinetic behaviour of ATN adsorption. Due to several limitations of Langmuir and Freundlich models (i.e: Langmuir model only valid for homogeneous system and ignore the adsorbate-adsorbate interactions, while Freundlich model is only empirical without a theoretical basis and fails at high pressure), other model such as n-BET equation, which was rarely applied will be used to predict the adsorption performance of ATN.
2 Materials and methods
2.1 Materials
2.1.1 Precursor preparation and physicochemical activation
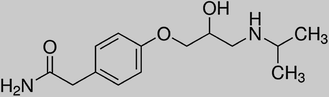
Gasification waste from Glyricidia sepium woodchips (GGSW) were obtained from a commercial gasification plant in Sri Lanka. All chemicals used in this study were of analytical grade supplied by Sigma Aldrich. Details on ATN are given in Table 1.
Molecular formula
Molecular weight (g/mol)
Molecular dimension (nm)
Chemical Structure
C14H22N2O3
266.34
1.19 × 1.03 × 0.44 (L × W × D)
The sample of GGSW was washed, dried at 105 °C for 24 h and treated with potassium hydroxide (KOH) (impregnation ratios = 1.55). Deionized water was then added to dissolve all the KOH pellets. The sample was dried in the oven overnight at 105 °C for 24 h. A modified 2.45 GHz microwave oven (Electrolux EMM2001W) was used for activation at 445 W for 1 min with CO2 gas flow rate of 150 cm3/min. This was the optimum condition for ATN adsorption based on the preliminary study using response surface methodology (Karami, 2017; Salari et al., 2019). Fig. 1 illustrates the schematic diagram of the microwave activation unit. The microwave heating technique (Cheng, 2018) was opted in this work rather than conventional heating to ensure a uniform heating, short activation time and excellent porosity distribution. The activated product was then cooled to room temperature under nitrogen flow. The sample was then rinsed with deionised water and HCl (0.1 M) to reach pH 7 and finally dried at 110 °C for 24 h.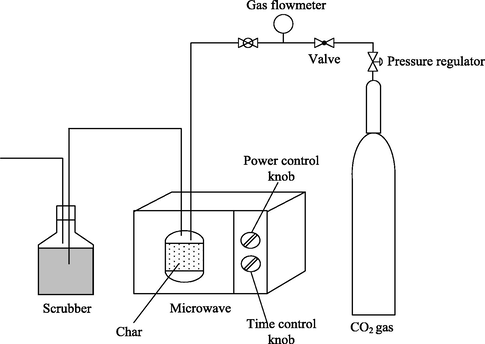
Microwave Activation Unit.
2.2 Characterization methods
Nitrogen adsorption–desorption measurements (Model: Micromeritics ASAP 2020, USA) were performed to determine the Brunauer–Emmett–Teller (BET) surface area, Barrett-Joyner-Halenda (BJH) pore size distribution, total pore volume (TPV), and average pore diameter (APD) of the sample. Prior to the analysis, the sample was degassed for 2 h under vacuum at 300 °C. The surface morphology of the samples was examined via scanning electron microscopy (Model: LEO SUPRA 55VP, Germany). The proximate analysis was analyzed using TGA equipment (Model: Perkin Elmer STA 6000, USA), while elemental analysis was conducted using a CHONS analyzer (Model: Perkin Elmer Series II 2400, USA). Fourier-transform infrared (Model: Shimadzu Prestige 21, Japan) spectroscopy was used to evaluate the chemical structural properties. Before analysis, the sample was crushed into powder form and dried at 150 °C for 24 h. The fine sample with 0.1 wt% potassium bromide (KBr) were pressed to form a disc. The spectra were recorded from 4000 to 400 cm−1, 40 scans were taken at a resolution of 4 cm−1.
2.3 Equilibrium study
The adsorption of ATN was conducted at natural pH (around 7.4) by varying the initial ATN concentrations (50–300 mg/L) and temperatures (30, 45 and 60 °C) using a water bath shaker for 24 h. In each test, GGSWAC with a mass of 0.05 g was mixed with 50 mL ATN solution. The experimental points were examined using the non-linear form of Langmuir, Freundlich, Dubinin-Radushkevish, Temkin, Sips and n-layer BET isotherm models (Ahmad et al., 2020). These equations were solved using a curve fitting tool provided in MATLAB R2019b.
2.4 Kinetic study
Similar steps in equilibrium study were applied for the contact time ranging from 15 to 1440 min. The non-linear form of pseudo-first order, pseudo-second order, Elovich and Avrami kinetic models (Ahmad et al., 2020) were used to evaluate the effect of contact time on ATN adsorption. A curve fitting tool provided in MATLAB R2019b was used to solve the non-linear equations.
2.5 Thermodynamic study
Thermodynamic parameters of ATN adsorption were studied by applying the van’t Hoff equation (Saha and Chowdhury, 2011):
The standard free energy change was calculated as:
The thermodynamic equilibrium constant was approximated by the equilibrium constant of monolayer (KS) and multilayer (KL) (provided in the BET equation) (Ebadi et al., 2009; Qu et al., 2018).
The calculation of the thermodynamic equilibrium constant was based on following equation:
It is assumed that the solution is sufficiently diluted to consider that the activity coefficient (which is a function of the ionic strength of the solute at adsorption equilibrium and the charge carried by solute) is unitary (Kasperiski, 2018).
2.6 Continuous adsorption study
The continuous adsorption of ATN was assessed using a 14 mm inner diameter glass tube with a length of 160 mm. ATN solution (100 mg/L) was pumped upward through the column at a desired flow rate (0.5, 1 and 2 mL/min) by a peristaltic pump without any pH modification (natural pH). Samples were collected at the column exit, and the operation was stopped when Ct/C0 reached unity. The ATN concentration in the effluent was determined using a double-beam UV–Visible spectrophotometer (Model: Agilent Cary 60, USA) at 285 nm. Thomas Eq. (5) (Jain and Gogate, 2018) Yoon–Nelson Eq. (6) (Lonappan et al., 2019) and Bohart–Adam Eq. (7) (Jang and Lee, 2019) models were employed for the analysis of column breakthrough curves.
3 Results & discussion
3.1 Characteristic of GGSWAC
3.1.1 N2 Adsorption isotherms and physical properties
The N2 adsorption–desorption isotherm for GGSWAC is indicated in Fig. 2(a). GGSWAC illustrated a combination of Type I and II sorption isotherms (Du, 2016; Yang and Hong, 2018) indicating the presence of micropores and mesopores. The pore size distribution in Fig. 2(b) shows that the pore size of GGSWAC was concentrated in the range of 1.63–1.81 nm. Similar trends were reported by Pallarés et al. (2018), Jang and Kan (2018), and Haryati et al. (2018), where each studied the characterization of AC and biochar. According to Song et al. (2013), ATN has a molecular size of 1.19 nm × 1.03 nm × 0.44 nm (L × W × D), which indicated that ATN molecules can agglomerate on the surface of GGSWAC with an APD of 2.11 nm. Table 2 shows the porous structure parameters of GGSWAC.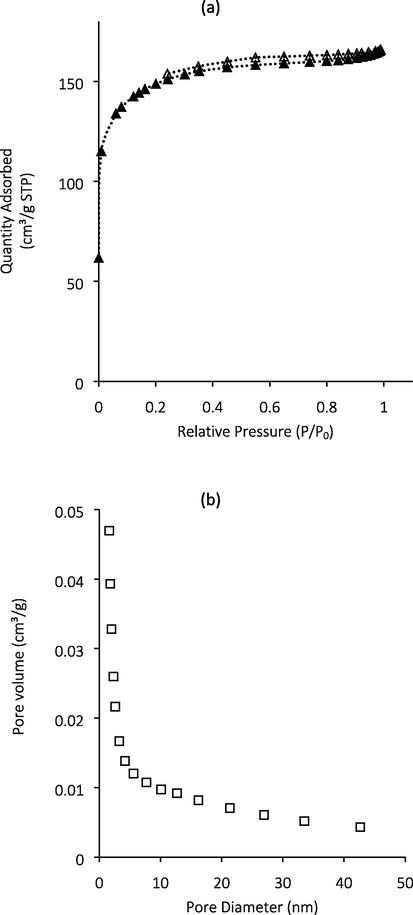
(a) N2 adsorption-desorption isotherms of GGSWAC (b) PSD of GGSWAC.
SBET (m2/g)
TPV (cm3/g)
Vmicro (cm3/g)
APD (nm)
%Vmicro
Smicro/SBET
483.07
0.255
0.147
2.11
57.56
60.84
3.1.2 Sample morphology
The surface morphology of GGSWAC which is illustrated in Fig. 3 indicates that GGSWAC possessed a porous structure in cylindrical shape which is ideal for excellent adsorption of ATN. Similar structures were reported by Mondal and Majumder (2019), who characterized AC derived from natural resources.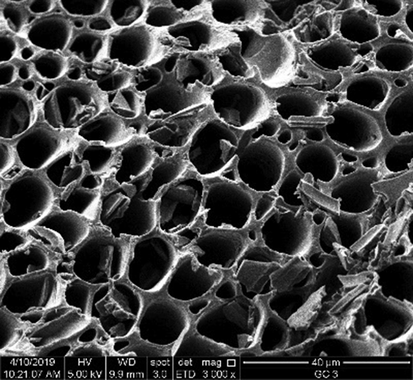
SEM images of GGSWAC.
3.1.3 Proximate and elemental analysis
Table 3 summarizes the proximate and ultimate composition of GGSWAC. In general, the synthesized GGSWAC closely follows the AC standard in SNI-06-3730-1995 (Pandia et al., 2018). The lower H/C molar ratio of 0.4 shows the high aromatic structure of GGWAC which contributed to π- π interactions for ATN adsorption.
Proximate Analysis (%)
Elemental Analysis (%)
Volatile matter
Fixed Carbon
Moisture
Ash
C
H
N
O
S
17.10
66.84
15.23
0.83
72.99
2.46
0.14
24.33
0.08
3.1.4 Sample functional groups
The surface chemistry of GGSWAC in Fig. 4 illustrates peak at 3435 cm−1 which associated to the existence of hydroxyl O—H group (Gao et al., 2018). The peak at 1548 cm−1 indicates the C⚌C stretching vibrations in the aromatic ring (Koyuncu et al., 2018). The small peaks at 1396 and 1238 correspond to C—O stretching vibrations in alcohols, phenols and ethers (Korus et al., 2018). These functional groups are responsible for ATN adsorption by interaction via hydrogen bond and π-π interaction. Similar findings were reported by Wang et al. (2018) and Yang (2014).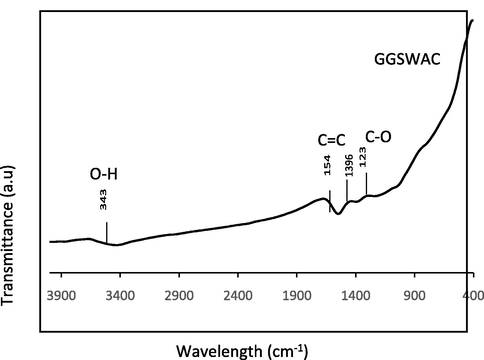
FTIR Spectra of GGSWAC.
3.2 Adsorption performance
3.2.1 Effect of initial concentration
Fig. 5 shows that as the initial ATN concentration increased from 50 to 300 mg/L, the adsorption uptakes of ATN molecules increased from 25.65 to 120.94 mg/g. This was due to larger mass transfer driving force at higher initial concentration to overcome the mass transfer resistance of ATN between the liquid and solid phase. At higher initial concentrations, the number of ions competing for the available sites on the surface of adsorbent is high, thus causing higher ATN adsorption capacity (Azari et al., 2020). The trend was consistent with adsorption study reported by To et al. (2017) and Fu et al. (2020).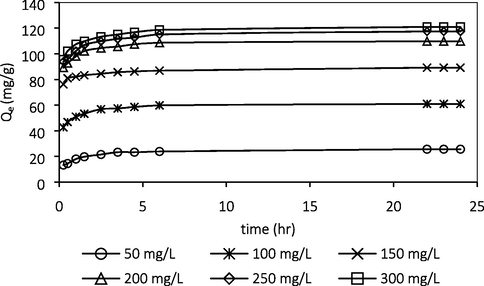
Effect of initial concentration.
3.2.2 Effect of temperature
The influence of temperature on ATN adsorption is given in Fig. 6. An increasing trend in ATN adsorption capacity was observed as the solution temperature increased from 30 to 60 °C indicating the endothermic nature of the ATN adsorption reaction. The adsorption capacity increased from 120.94 to 164.47 mg/g when the temperature was raised from 30 to 60 °C. This was due to more ATN molecules gained adequate energy to interact with the active sites of AC at higher temperature. Increasing the temperature also resulted in an increase of rate of ATN diffusion across the liquid film and in the interior pores of the GGSWAC due to the reduction in the solution viscosity (Ahmad et al., 2015). Similar finding was reported by Dehdashti et al. (2019) who studied the effect of temperature on ATN adsorption at temperature between 20 and 50 °C using carbon nanotubes.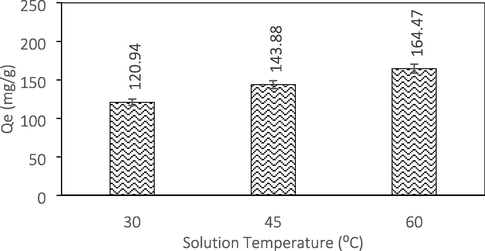
Effect of temperature.
3.2.3 Effect of pH
The influence of solution pH on adsorption capacity is illustrated in Fig. 7. The adsorption of ATN depends on the pKa of the amines (which is 9.6) and the pH of the solution. The ATN solution is mainly in positively charged manner below its pKa (Kyzas et al., 2015). The pHPZC for GGSWAC was found at pH 4.8. At pH < pHPZC, the GGSWAC surface was positively charged while at pH > pHPZC, the surface became negatively charged. Therefore, when the pH is above pHpzc the GGSWAC surface possessed the net negative charge and promoted the electrostatic attraction with positively charged ATN solution. Hence the adsorption uptake increased from 67.65 to 74.71 mg/g at pH 4 and pH 8. However, at pH above the pKa value, ATN molecules were deprotonated and became neutral, thus causing a declining trend in ATN uptake at pH 10 to 12. The best pH for ATN adsorption was found at 8, similar to the study conducted by Haro et al. (2017), Fu et al. (2020), and Chang et al. (2019).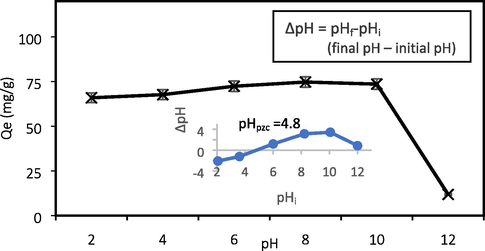
Effect of pH and determination of pHPZC.
3.2.4 Adsorption isotherm
Fig. 8 illustrates the plots of Langmuir, Freundlich, Dubinin-Radushkevich, Sips, Temkin, and n-BET isotherm models and Table 4 indicates the values of each model parameter. It was observed that the four-parameter n-BET model shows good agreement to the experimental data, with the highest values of R2 and the lowest values of
at all studied temperatures. The n-BET isotherm assumes that there are a maximum n layers that can be adsorbed onto the internal surface of AC. Based on
values of higher than 2, it was concluded that the ATN adsorption onto GGSWAC took place in a multilayer adsorption manner with maximum number of layers equal to 2.5, 2.1 and 2.7 at 30, 45 and 60 °C. This was further proven by the values of
predicted by Sips which were far from unity, suggesting heterogenous distribution of adsorption sites. The saturation capacity predicted by n-BET model (from the plot) was 121, 143 and 163 mg/g at 30, 45 and 60 °C, respectively. Sips model combines the Freundlich and Langmuir isotherms, which provide a finite limit in the number of adsorbed molecules at high concentration. The maximum capacity predicted by Sips was 124, 151 and 239 mg/g at 30, 45 and 60 °C, respectively with reasonably high values of R2 and low values of
. *LM = Langmuir, FR = Freundlich, TK = Temkin, DR = Dubinin-Radushkevich. *unit: Qm = mg/g, KL = L/mg, KF = mg/g (L/mg)1/n, bT = J/mol, KT = L/mg, QDR = mg/g, E = kJ/mol, QS = mg/g), KSips = (L/mg)ns, QM,BET = mg/g, KL,BET = L/mg, KS = L/mg.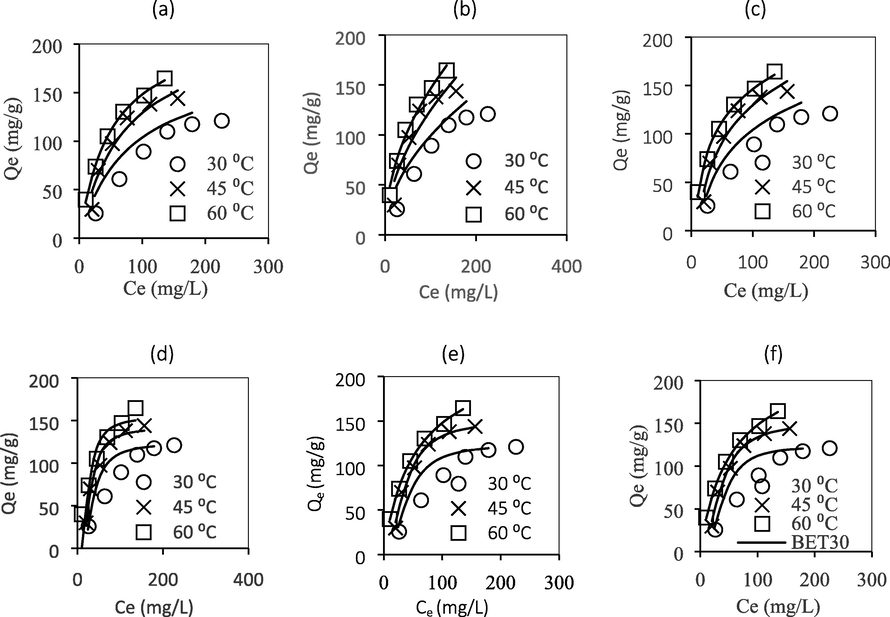
Fitting of various isotherm models to experimental data: (a) Langmuir (b) Freundlich (c) Temkin (d) Dubinin-Radushkevich (e) Sips (f) n-BET models.
Model
Parameter
30 °C
45 °C
60 °C
LM
Qm
187.40
223.10
223.80
KL
0.0124
0.0137
0.0196
R2
0.9180
0.9430
0.9979
χ2
9.9438
9.0470
0.2877
FR
KF
9.30
11.11
15.44
nF
1.946
1.905
2.049
R2
0.8479
0.8843
0.9818
χ2
16.3163
15.5106
2.5339
TK
bT
0.0521
0.0475
0.0567
KT
0.0862
0.1025
0.1993
R2
0.9385
0.9610
0.9919
χ2
6.1295
5.2994
1.4012
DR
QDR
123.70
142.20
154.70
E
18.35
14.38
12.16
R2
0.9950
0.9761
0.8242
χ2
0.8794
2.4413
1337.6569
Sips
QS
124.00
151.40
239.30
KSips
0.0003
0.0008
0.0223
nS
2.1950
1.9670
0.9310
R2
0.9930
0.9870
0.9983
χ2
1.0738
2.3662
0.1718
n-BET
QM,BET
48.98
72.03
78.00
KL
3.8350
0.6442
0.0128
KS
1.15 × 10⁻⁵
0.0009
0.0670
nBET
2.52
2.09
2.71
R2
0.9987
0.9871
0.9983
χ2
0.1650
2.2053
0.1564
The Dubinin-Radushkevich model was used to evaluate the pore characteristic and the energy of adsorption. The energy of adsorption, E, given by Dubinin-Radushkevich was applied to evaluate the type of adsorption; when 1 < E < 8 kJ/mol, the adsorption is categorized as physical process, when 8 < E < 16 kJ/mol, the adsorption involves ion exchange, and when E > 16 kJ/mol, the chemical adsorption is involved. In this study, the adsorption energy, E was greater than 16 kJ/mol indicating the chemical adsorption may play an important role in the first layer of adsorption. However, the Temkin constant, bT which correspond to the heat of adsorption was lower than 20 kJ/mol, manifesting the physisorption process. Thus, the adsorption thermodynamics data were used to validate the results.
Langmuir assumes a monolayer adsorption, homogeneous surface and uniform adsorption energy. At higher temperature (T = 60 °C), this model showed greater correlation with the isotherm data (R2 = 0.9979) owing to higher monolayer affinity towards GGSWAC and ATN interaction in the first layer compared to ATN-ATN interaction in the subsequent layer. The maximum monolayer adsorption capacity predicted by Langmuir model was 187.4, 223.1 and 223.8 mg/g at 30, 45 and 60 °C, respectively.
Freundlich isotherm model assumes that the surface of the adsorbent is heterogeneous and active sites and the adsorption energies distribute exponentially. The values of 1/nF revealed the adsorption intensity of adsorbate or surface heterogeneity; favourable adsorption is obtained in the range of 0 to 1. The adsorbent surface becomes more heterogeneous as this value approaches zero. The values of 1/nF in this study were in the range of 0.49–0.52 indicating a favourable adsorption.
The following show the ranking of the isotherm models in descending order (best to poorest fitting), with respect to the R2 and values: n-BET > Sips > Dubinin– Radushkevich > Temkin > Langmuir > Freundlich. The results demonstrated the suitability of n-BET model to describe the multilayer adsorption of ATN.
3.2.5 Adsorption kinetic
Table 5 summarizes the kinetic parameter values of the PFO, PSO, Elovich and Avrami models. It was found that the adsorption of ATN onto GGSWAC followed the Avrami model, which recorded the highest values of R2. Besides, the qe,exp values agreed satisfactorily with the qe,cal values which resulted in low values of
q (0.362 to 2.704%). The qe.cal values were 25.94, 61.51, 91.20, 110.90, 120.00 and 122.60 mg/g while the qe,exp values were 25.65, 60.94, 89.18, 109.76, 117.41 and 120.94 mg/g. The PSO model also reasonably fitted the ATN adsorption with most of the R2 values were greater than 0.900. In addition, some of the kinetic data correlated well with Elovich model, suggesting the possibility of chemisorption involved. In contrast, the experimental data poorly fitted the PFO model equation. Similar findings have been reported by Chang et al. (2019) and To et al. (2017) who also studied the adsorption of ATN onto AC. Fig. 9 illustrates the fitting of these models using the experimental data at various initial ATN concentrations. *PFO = Pseudo-first order, PSO = Pseudo-second order.
Model
Parameter
Initial Concentration (mg/L)
50
100
150
200
250
300
PFO
k1 × 10−1 (1/min)
0.323
0.742
1.393
1.109
1.067
1.060
qe (mg/g)
23.73
57.67
85.93
105.50
111.50
115.40
R2
0.767
0.662
0.566
0.558
0.478
0.590
q (%)
12.652
7.033
3.122
4.860
5.970
4.886
PSO
k2 × 10−2 (g/mg min)
0.198
0.221
0.460
0.230
0.193
0.195
qe (mg/g)
25.34
60.12
87.51
108.50
115.00
118.80
R2
0.946
0.936
0.864
0.904
0.850
0.906
q (%)
6.711
3.183
1.739
2.312
3.249
2.355
α × 104 (mg/g min)
0.003
4
245
424
336
397
Elovich
β (g/mg)
0.364
0.263
0.219
0.183
0.170
0.166
R2
0.931
0.899
0.328
0.836
0.919
0.907
q (%)
5.954
3.702
3.907
2.711
2.164
2.194
qe (mg/g)
25.94
61.51
91.20
110.90
120.00
122.60
nAV
0.430
0.325
0.157
0.253
0.223
0.236
Avrami
kAV (1/min)
0.026
0.105
3.451
0.408
0.358
0.383
R2
0.991
0.995
0.986
0.988
0.981
0.998
q (%)
2.704
0.817
0.595
0.815
1.185
0.362
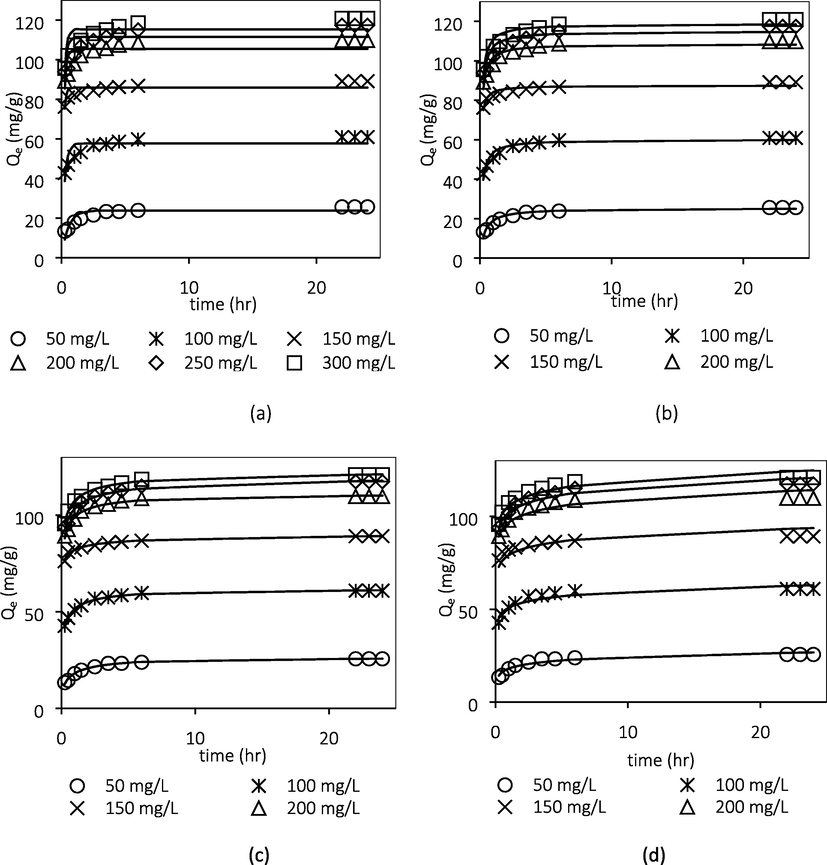
Fitting of experimental data to the (a) PFO (b) PSO (c) Avrami and (d) Elovich models.
3.2.6 Rate limiting step of adsorption
Fig. 10 shows the Weber Moris intraparticle diffusion plot for ATN adsorption onto GGSWAC at various initial concentrations. According to this model, the adsorption is solely intra-particle diffusion (IPD) controlled if the plot of qt versus t0.5 gives a straight line and crosses the origin. However, if the plot exhibit multi-linearity, more than one steps are involved in the process (Choudhary et al., 2020). The results demonstrated a multilinearity and do not pass through the origin, hence IPD was not the only step in controlling the adsorption process. In order to confirm whether film diffusion or IPD was the rate-limiting step, the kinetic result was further analyzed using the Boyd model. The rate of mass transfer was controlled by IPD if the plots of Bt versus t at different ATN concentrations linearly pass via the origin. In contrast, if the plots are linear or nonlinear but do not pass through the origin, the adsorption process may be limited either by film diffusion or chemical reaction (Sartape et al., 2017). From Fig. 11, the adsorption rate was not limited by IPD as the plot does not passed through the origin and therefore film diffusion or chemical interaction limits the rate of ATN adsorption.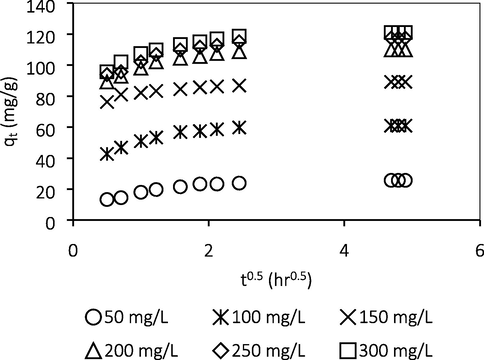
Weber Moris intraparticle diffusion plot.
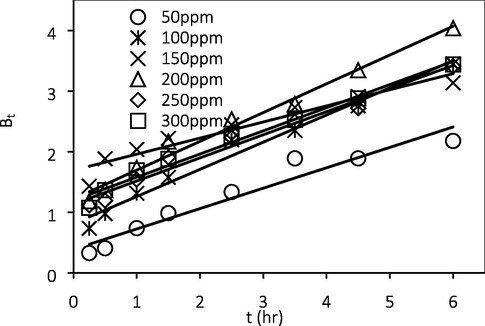
Boyd’s plot.
To confirm whether both diffusion and chemisorption control the ATN adsorption process, the data were fitted to diffusion-chemisorption model (Pholosi et al., 2019; Tavlieva et al., 2013). Fig. 12 indicates the plot of diffusion-chemisorption model for ATN adsorption. It was observed that the data were excellently fitted with sufficiently high correlation coefficient R2, thus confirming that the overall mechanism of ATN adsorption were ruled by both film diffusion and chemisorption.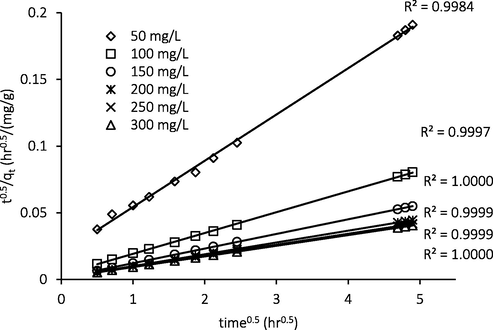
Diffusion-chemisorption plot.
3.2.7 Adsorption mechanism
Fig. 13a shows the proposed GGSWAC-ATN interaction on the first layer of ATN adsorption. The possible interactions include electrostatic interactions between the negatively charged hydroxyl group (when pH > pHPZC) and the protonated ATN (when pH < pKa); H-bonding between the H-bond donor in ATN and the hydroxyl group (H-bond acceptor) of the GGSWAC, H-bonding between the hydroxyl group of GGSWAC and the amide group (H-bond acceptor) in ATN; and π- π interaction between the aromatic groups in GGSWAC surface and the ATN molecules.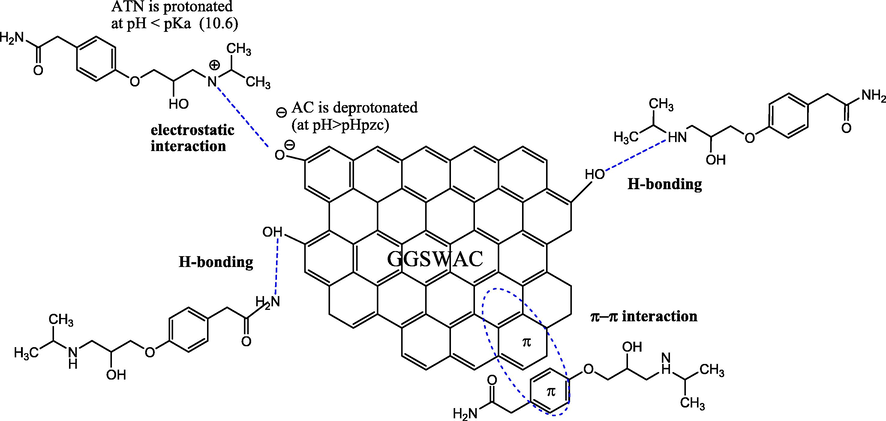
ATN-GGSWAC interaction.
Fig. 13b shows the ATN-ATN interactions in the subsequent layer of ATN adsorption. The possible interactions include π-π interactions between the ATN-ATN aromatic rings; H-bonding between the H-bond donor and the H-bond acceptor in amide group of ATN-ATN molecules; and London dispersion forces between the alkyl chains in ATN molecules.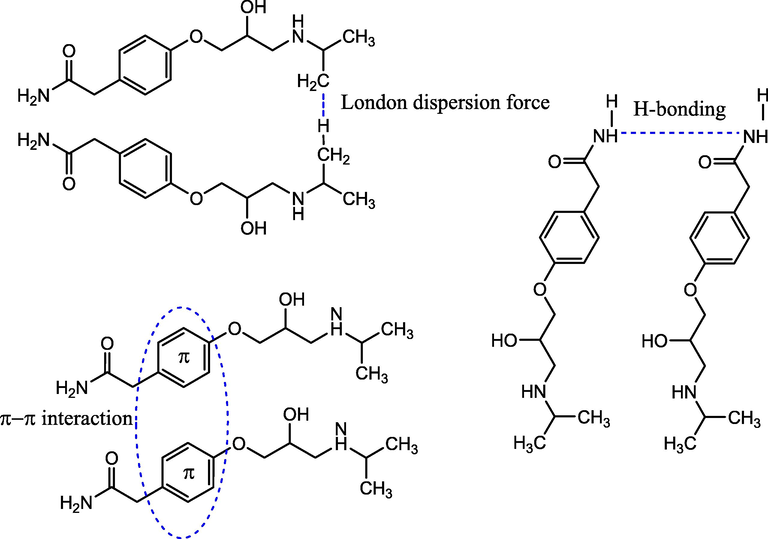
ATN-ATN interaction.
3.2.8 Adsorption thermodynamic
The thermodynamic parameters, which were determined separately for both monolayer and multilayer steps (Scheufele, 2016) are summarized in Table 6. ΔG values were all negatives, indicating that the adsorption of ATN by GGSWAC was thermodynamically spontaneous. The multilayer
GL were greater than monolayer
GS at 30 and 45 °C indicating a greater multilayer affinity towards ATN-ATN interaction rather than ATN-AC interaction. The absolute values of ΔGs increased as the temperature of the adsorption increased, indicating that the adsorption process was thermodynamically favorable at higher temperature on the first layer. In contrast, the magnitude of ΔGL declined with temperature, indicating that the adsorption process was thermodynamically favorable at lower temperature on the subsequent layer of GGSWAC surface. The negative value of multilayer
HL revealed the exothermic process, while the monolayer adsorption has shown a positive value of
HS indicating an endothermic process. The monolayer adsorption enthalpy value
HS was greater than 80 kJ/mol indicating a chemisorption process (Bello et al., 2015). This result shows a good agreement with the values of heat of adsorption provided by Dubinin-Radushkevich, EDR, which were in the range of chemisorption (8–16 kJ/mol). The high adsorption energy might be due to polar interactions of aromatic π-donor and π-acceptor compounds with estimated adsorption energy in the range of 4–167 kJ/mol (Delgado et al., 2015) and H-bonding with estimated adsorption energy in the range of 2–40 kJ/mol (Afonin et al., 2018; Ghaly et al., 2016). The positive value of the monolayer adsorption entropy ΔSS indicates an increase in randomness at the adsorbent-solution interface (Zaidi et al., 2019) and poor reversibility of adsorption (Bello and Ahmad, 2011). On contrary, the negative value of ΔSL at the multilayer adsorption step indicates a decrease in disorder of system’s interface (Scheufele, 2016). The van’t Hoff plot is depicted in Fig. 14 with high values of R2 indicating a reliable estimation of thermodynamic parameters.
Temperature (K)
Monolayer
Multilayer
ΔGS (kJ/mol)
ΔHS (kJ/mol)
ΔSS (J/K mol)
ΔGL (kJ/mol)
ΔHL (kJ/mol)
ΔSL (J/K mol)
303.15
−2.82
234.17
781.69
−34.87
318.15
−14.48
−31.88
−165.62
−427.78
333.15
−26.28
−22.53
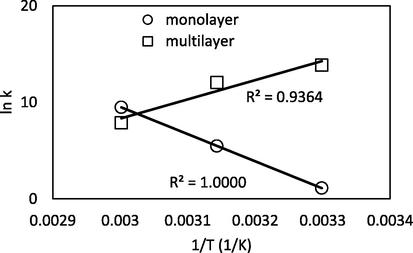
Van’t Hoff plot.
3.3 Fixed-bed column study
3.3.1 Effect of fixed-bed column parameters
Table 7 indicates the effect of fixed bed column parameters for ATN adsorption by GGSWAC at 30 °C. The exhaustion time (te) was found to decline from 53.3 to 7.5 h as the influent flow rate was increased from 0.5 to 2.0 mL/min. This was due to insufficient residence time between the surface of adsorbate and adsorbent at higher flow rate, and thus limiting the diffusion of the solute into the pores of the adsorbent. It was also noticed that an increase in the ATN initial concentration resulted in a decrease in the breakthrough time (tb) and exhaustion time. Higher influent concentration increased the driving force for mass transfer across the liquid film and accelerated the adsorption rate, leading to an earlier exhaustion of the fixed-bed column. Finally, increasing the bed height from 1 to 3 cm led to an increase in tb, te and bed capacity of ATN adsorption. This was due to more active sites available for the sorption of ATN at higher bed depths and adsorbent dosages. The results were in agreement with Nithya et al. (2020), Kumari and Dey (2019) and Ang et al. (2020) who also studied adsorption in continuous fixed-bed column.
Q (mL/min)
Co (mg/L)
H (cm)
Breakthrough time (hr)
Exhaustion time (hr)
qbed (mg/g)
1
200
2
3.1
12.8
72.58
1
150
2
6.2
14.5
69.60
1
100
2
8.2
20.5
58.41
2
100
2
2.2
7.5
37.51
0.5
100
2
24.7
53.3
89.71
0.5
100
1
7.0
20.2
33.43
0.5
100
3
45.8
87.0
125.21
3.3.2 Dynamic modelling of breakthrough curves
The experimental data for adsorption of ATN onto GGSWAC were fitted to three models, namely Thomas, Yoon-Nelson and Bohart-Adam models at constant flow rate, initial concentration and bed height of 0.5 mL/min, 100 mg/L and 2 cm, respectively. The fit between experimental and calculated data were compared based on the correlation coefficient, R2 and the results are shown in Table 8 and Fig. 15. Thomas model shows very good correlations for breakthrough data with R2 value of 0.9822. The maximum bed capacity, q0, calculated by Thomas model was reasonably close to the experimental adsorption capacity presented in Table 7, confirming the applicability of Thomas model to column design and analysis. Thomas model is applicable in system with a constant flow rate and no axial dispersion. With the given flow rate of 0.5 mL/min, it could be assumed that axial dispersion does not take place. Hence, it is reasonable to conclude that Thomas model fits well with the experimental data. Yoon-Nelson model also predicted the breakthrough curve very well, with R2 value of 0.9817 and time required to achieve 50% breakthrough obtained experimentally (t0.5) was significantly close to that estimated by Yoon- Nelson model. These findings confirmed that both Thomas and Yoon-Nelson models fitted well to the obtained breakthrough data.
Z (cm)
Q (ml/min)
Thomas model
Yoon–Nelson model
Bohart–Adam model
2.0
0.5
2.25
87.45
0.9822
30.7
0.219
32.1
0.9817
4.84
50.24
0.8565
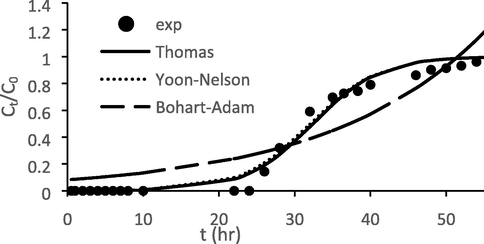
Theoretical and actual breakthrough curves for ATN adsorption onto GGSWAC at flow rates of 0.5 mL/min.
3.4 Comparison with other adsorbents
Comparisons of different adsorbents found in the literature were done based on maximum adsorption capacity as shown in Table 9. It was concluded that GGSWAC can be considered as a valuable alternative for ATN removal from aqueous solution due to its high adsorption capacity.
Adsorbent
ATN adsorption capacity (mg/g)
Ref
Commercial AC
18.8
Haro et al. (2017)
Activated palm kernel shell
183.8
To et al. (2017)
Corncob biochar
86.9
Fu et al. (2020)
Graphene oxide
116.0
Kyzas et al. (2015)
Magnetic nanoparticles
47.8
Hayasi and Saadatjoo (2018)
Commercial granular AC
80.4
Sotelo et al. (2012)
Kaolinite
86.0
Hu et al. (2014)
Carbon nanotubes
16.8
Amin et al. (2018)
Filtrasorb 400 AC
65.0
Delgado et al. (2015)
Picabiol AC
49.1
Nirmali Seeds
32.1
Archana Rao et al. (2020)
GGSWAC
163.0
This study
4 Conclusion
The prepared GGSWAC possessed excellent characteristic for ATN adsorption owing to high SBET (483.07 m2/g) and TPV (0.255 cm3/g), as well as high ATN removal capability of 121, 143 and 163 mg/g at 30, 45 and 60 °C, respectively. The n-BET isotherm (R2 = 0.9871–0.9987) and Avrami kinetic (R2 = 0.981–0.998) models were the best models to describe the behavior of ATN adsorption onto GGSWAC in batch operation while the Thomas (R2 = 0.9822) and Yoon–Nelson (R2 = 0.9817) equations were the best correlations to predict the ATN adsorption in continuous mode. The ATN adsorption was governed by diffusion and chemisorption as the data fitted well to diffusion-chemisorption model equation (R2 ≥ 0.9999). The future research will emphasis on the surface modification for enhancing the ATN removal performance, as well as the other characterization methods and regeneration capabilities of the GGSWAC.
Acknowledgments
The authors thankfully acknowledge the support obtained from the National Hydraulic Research Institute of Malaysia (NAHRIM), Universiti Sains Malaysia (304/PJKIMIA/6050434/I136), and Universiti Malaysia Perlis (UniMAP) in the form of sponsorship and facilities.
Declaration of Competing Interest
The authors declare that they have no known competing financial interests or personal relationships that could have appeared to influence the work reported in this paper.
References
- Estimating the energy of intramolecular bifurcated (three-centered) hydrogen bond by X-ray, IR and 1H NMR spectroscopy, and QTAIM calculations. J. Mol. Struct.. 2018;1163:185-196.
- [Google Scholar]
- Adsorption kinetic studies for the removal of synthetic dye using durian seed activated carbon. J. Disper. Sci. Technol.. 2015;36(5):670-684.
- [CrossRef] [Google Scholar]
- Adsorption of basic green 4 onto gasified glyricidia sepium woodchip based activated carbon: optimization, characterization, batch and column study. Arab. J. Chem.. 2020;13:6887-6903.
- [Google Scholar]
- Removal of atenolol from aqueous solutions by multiwalled carbon nanotubes: Isotherm study. Desalin. Water Treat.. 2018;133:212-219.
- [Google Scholar]
- Breakthrough analysis of continuous fixed-bed adsorption of sevoflurane using activated carbons. Chemosphere. 2020;239:124839
- [Google Scholar]
- Kinetics and equilibrium for adsorption of atenolol from water using moringa oleifera and nirmali seeds. Int. J. Recent Technol. Eng.. 2020;9(1):1654-1660.
- [Google Scholar]
- Comprehensive systematic review and meta-analysis of dyes adsorption by carbon-based adsorbent materials: classification and analysis of last decade studies. Chemosphere. 2020;250(5):126238
- [Google Scholar]
- Adsorptive removal of a synthetic textile dye using cocoa pod husks. Toxicol. Environ. Chem.. 2011;93(7):1298-1308.
- [CrossRef] [Google Scholar]
- Scavenging malachite green dye from aqueous solutions using pomelo (Citrus grandis) peels: kinetic, equilibrium and thermodynamic studies. Desalin. Water Treat.. 2015;56(2):521-535.
- [CrossRef] [Google Scholar]
- Synthesis and evaluation of biochar-derived catalysts for removal of toluene (model tar) from biomass-generated producer gas. Renew. Energy. 2014;66:346-353.
- [Google Scholar]
- The triple mechanisms of atenolol adsorption on Ca-montmorillonite: implication in pharmaceutical wastewater treatment. Materials (Basel). 2019;12(18)
- [Google Scholar]
- Microwave one-pot production of ZnO/Fe3O4/activated carbon composite for organic dye removal and the pyrolysis exhaust recycle. J. Clean. Prod.. 2018;188:900-910.
- [Google Scholar]
- Activated biochar derived from Opuntia ficus-indica for the efficient adsorption of malachite green dye, Cu+2 and Ni+2 from water. J. Hazard. Mater. (February)
- [Google Scholar]
- Atenolol adsorption onto multi-walled carbon nanotubes modified by NaOCl and ultrasonic treatment; kinetic, isotherm, thermodynamic, and artificial neural network modeling. J. Environ. Heal. Sci. Eng.. 2019;17:117.
- [Google Scholar]
- Adsorption of ibuprofen and atenolol at trace concentration on activated carbon. Sep. Sci. Technol.. 2015;50(10):1487-1496.
- [Google Scholar]
- Microwave-assisted preparation of almond shell-based activated carbon for methylene blue adsorption. Green Process. Synth.. 2016;5(4):395-406.
- [Google Scholar]
- What is the correct form of BET isotherm for modeling liquid phase adsorption? Adsorption. 2009;15(1):65-73.
- [Google Scholar]
- The single co-adsorption characteristics and microscopic adsorption mechanism of biochar-montmorillonite composite adsorbent for pharmaceutical emerging organic contaminant atenolol and lead ions. Ecotoxicol. Environ. Saf.. 2020;187:109763
- [Google Scholar]
- Carbon-based materials prepared from pine gasification residues for acetaminophen adsorption. Chem. Eng. J.. 2014;240:344-351.
- [Google Scholar]
- Chars from gasification of coal and pine activated with K2CO3: Acetaminophen and caffeine adsorption from aqueous solutions. J. Colloid Interface Sci.. 2014;433:94-103.
- [Google Scholar]
- Novel magnetic graphene oxide decorated with persimmon tannins for efficient adsorption of malachite green from aqueous solutions. Colloids Surfaces A Physicochem. Eng. Asp.. 2019;566(December 2018):48-57.
- [Google Scholar]
- Evaluation of synthetic Birnessite utilization as a sorbent for cobalt and strontium removal from aqueous solution. Chem. Eng. J.. 2016;284:1373-1385.
- [Google Scholar]
- Removal of atenolol by adsorption – study of kinetics and equilibrium. J. Clean. Prod.. 2017;154:214-219.
- [Google Scholar]
- Pilot scale biochar production from Palm Kernel Shell (PKS) in a fixed bed allothermal reactor. J. Oil Palm Res. 2018
- [Google Scholar]
- Preparation of magnetic nanoparticles functionalized with novel adsorbents for removal of pharmaceuticals from aqueous solutions. Adv Polym Technol. 2018;37:1941-1953.
- [Google Scholar]
- Efficient removal of Acid Green 25 dye from wastewater using activated Prunus Dulcis as biosorbent: batch and column studies. J. Environ. Manage.. 2018;210:226-238.
- [Google Scholar]
- A novel hay-derived biochar for removal of tetracyclines in water. Bioresour. Technol.. 2019;274(October 2018):162-172.
- [Google Scholar]
- Effective phosphorus removal using chitosan/Ca-organically modified montmorillonite beads in batch and fixed-bed column studies. J. Hazard. Mater.. 2019;375(April):9-18.
- [Google Scholar]
- Characterization and adsorption performance evaluation of waste char by-product from industrial gasification of solid refuse fuel from municipal solid waste. Waste Manag.. 2019;91:33-41.
- [Google Scholar]
- Application of response surface methodology for statistical analysis, modeling, and optimization of malachite green removal from aqueous solutions by manganese-modified pumice adsorbent. Desalin. Water Treat.. 2017;89(January):150-161.
- [Google Scholar]
- Production of porous activated carbons from Caesalpinia ferrea seed pod wastes: Highly efficient removal of captopril from aqueous solutions. J. Clean. Prod.. 2018;197:919-929.
- [Google Scholar]
- Removal of phosphate and nitrate over a modified carbon residue from biomass gasification. Chem. Eng. Res. Des.. 2014;92(10):1923-1933.
- [Google Scholar]
- Physical activation of carbon residue from biomass gasification: Novel sorbent for the removal of phosphates and nitrates from aqueous solution. J. Ind. Eng. Chem.. 2015;21:1354-1364.
- [Google Scholar]
- Physicochemical properties of biochars prepared from raw and acetone-extracted pine wood. Fuel Process. Technol.. 2019;185(November 2018):106-116.
- [Google Scholar]
- Role of optimization parameters in the production of nanoporous carbon from mandarin shells by microwave-assisted chemical activation and utilization as dye adsorbent. Adv. Powder Technol.. 2018;29:2108-2118.
- [Google Scholar]
- A breakthrough column study for removal of malachite green using coco-peat. Int. J. Phytoremediation. 2019;21(12):1263-1271.
- [Google Scholar]
- Removal of beta-blockers from aqueous media by adsorption onto graphene oxide. Sci. Total Environ.. 2015;537:411-420.
- [Google Scholar]
- A critical review of the estimation of the thermodynamic parameters on adsorption equilibria. Wrong use of equilibrium constant in the Van’t Hoof equation for calculation of thermodynamic parameters of adsorption. J. Mol. Liq.. 2019;273:425-434.
- [Google Scholar]
- Removal of diclofenac using microbiochar fixed-bed column bioreactor. J. Environ. Chem. Eng.. 2019;7(1):102894
- [Google Scholar]
- Activated carbon derived from carbon residue from biomass gasification and its application for dye adsorption: kinetics, isotherms and thermodynamic studies. Bioresour. Technol.. 2016;200:350-359.
- [Google Scholar]
- Apple tree branches derived activated carbons for the removal of β-blocker atenolol. Chem. Eng. J.. 2018;345(February):669-678.
- [Google Scholar]
- β-blockers as endocrine disruptors: the potential effects of human β-blockers on aquatic organisms. J. Exp. Zool. Part A Ecol. Genet. Physiol.. 2011;315(5):251-265.
- [Google Scholar]
- Honeycomb-like porous activated carbon for efficient copper (II) adsorption synthesized from natural source : Kinetic study and equilibrium isotherm analysis. J. Environ. Chem. Eng.. 2019;7(4):103236
- [Google Scholar]
- Packed bed column optimization and modeling studies for removal of chromium ions using chemically modified Lantana camara adsorbent. J. Water Process Eng.. 2020;33(November 2019):101069.
- [Google Scholar]
- Production and characterization of activated carbon from barley straw by physical activation with carbon dioxide and steam. Biomass Bioenergy. 2018;115(January):64-73.
- [Google Scholar]
- Utilization of cocoa peel as biosorbent for oil and color removal in Palm Oil Mill Effluent (POME) IOP Conf. Ser. Mater. Sci. Eng.. 2018;300(1)
- [Google Scholar]
- Intraparticle diffusion of Cr(VI) through biomass and magnetite coated biomass: a comparative kinetic and diffusion study. South African J. Chem. Eng.. 2020;32(December 2019):39-55.
- [Google Scholar]
- Effect of properties of activated carbon on malachite green adsorption. Fuel. 2019;249(October 2018):45-53.
- [Google Scholar]
- Chemically activated carbon residue from biomass gasification as a sorbent for iron(II), copper(II) and nickel(II) ions. J. Water Process Eng.. 2014;4:12-24.
- [Google Scholar]
- Insight into adsorption thermodynamics. In: Thermodynamics. Tech Europe; 2011. p. :349-364.
- [Google Scholar]
- High performance removal of phenol from aqueous solution by magnetic chitosan based on response surface methodology and genetic algorithm. J. Mol. Liq.. 2019;285:146-157.
- [Google Scholar]
- Removal of malachite green dye from aqueous solution with adsorption technique using Limonia acidissima (wood apple) shell as low cost adsorbent. Arab. J. Chem.. 2017;10:S3229-S3238.
- [Google Scholar]
- Monolayer-multilayer adsorption phenomenological model: kinetics, equilibrium and thermodynamics. Chem. Eng. J.. 2016;284:1328-1341.
- [Google Scholar]
- High capacity adsorption of malachite green in a mesoporous tyre-derived activated carbon. Asia-Pac. J. Chem. Eng.. 2013;8:172-177.
- [Google Scholar]
- Removal of atenolol and isoproturon in aqueous solutions by adsorption in a fixed-bed column. Ind. Eng. Chem. Res.. 2012;51(13):5045-5055.
- [Google Scholar]
- Kinetic study of brilliant green adsorption from aqueous solution onto white rice husk ash. J. Colloid Interface Sci.. 2013;409:112-122.
- [Google Scholar]
- Mechanistic study of atenolol, acebutolol and carbamazepine adsorption on waste biomass derived activated carbon. J. Mol. Liq.. 2017;241:386-398.
- [Google Scholar]
- Pb (II) sorption by biochar derived from Cinnamomum camphora and its improvement with ultrasound-assisted alkali activation. Colloids Surfaces A. 2018;556(June):177-184.
- [Google Scholar]
- Biochar from Alternanthera philoxeroides could remove Pb (II) efficiently. Bioresour. Technol.. 2014;171:227-232.
- [Google Scholar]
- Adsorption behavior of modified Glossogyne tenuifolia leaves as a potential biosorbent for the removal of dyes. J. Mol. Liq.. 2018;252:289-295.
- [Google Scholar]
- Enhancing adsorption of malachite green dye using base-modified Artocarpus odoratissimus leaves as adsorbents. Environ. Technol. Innov.. 2019;13:211-223.
- [Google Scholar]


