

Translate this page into:
ATR-FTIR combined with chemometrics to distinguish geographical indications from non-geographical indications Gastrodia elata Bl
*Corresponding authors: E-mail addresses: hhyhhy96@163.com (Y. Huang); boletus@126.com (Y. Wang)
-
Received: ,
Accepted: ,
Abstract
Gastrodia elata Bl (G. elata), a medicinal and edible homologous variety, has been artificially cultivated in different regions of China to meet the growing demands of human beings. In this study, attenuated total reflection/Fourier transform infrared spectroscopy (ATR/FTIR) combined with chemometrics [Principal component analysis (PCA), Partial least squares discrimination (PLS-DA), Support vector machines (SVM), and Data-driven soft independent modeling of class analogy (DD-SIMCA)] was used to differentiate between geographical indications and non-geographical indications of G. elata. PLS-DA, after the application of SNV+SD spectral preprocessing, achieved 100% accuracy on the training set and 88.89% on the test set, respectively. Under SG+SD conditions, SVM outperformed PLS-DA with 100% training set accuracy and 94.74% for the test set. A ResNet model that used synchronous 2DCOS data successfully distinguished G. elata from Yunnan and Guizhou, achieving 100% accuracy across training, test, and external validation sets. These findings support that ATR-FTIR and chemometrics can be utilized to effectively identify the geographical origin of G. elata, with potential applications for other medicinal and edible plants.
Keywords
Attenuated fourier transform infrared spectrum
Chemometrics
Gastrodia elata Bl
Geographical indications and non-geographical indications

1. Introduction
The dried tuber of the Gastrodia elata Bl (G. elata) is a kind of perennial parasitic plant widely distributed in China, Bhutan, Nepal, India, Japan, Korea, Siberia, and other countries, which possesses both high medicinal and edible value [1]. In traditional Chinese medicine (TCM), G elata calms wind, stops spasms, soothes liver-yang, dispels wind, clears collaterals, etc., and can be leveraged for children’s convulsions, epilepsy, tetanus, headache, dizziness, paralysis of hands and feet, numbness of limbs, rheumatism, and arthralgia [2]. It has been found that the chemical composition of G. elata encompasses phenols (e.g. Gastrodin, 4-hydroxybenzenol and balisin), polysaccharides, sterols (e.g. Beta-sitosterol), and organic acids (e.g. Citric acid and succinic acid) [3,4]. Also, modern pharmacological studies have proven that G. elata has anti-inflammatory, anti-epileptic, anti-stroke, anti-anxiety, and anti-depression pharmacological effects [5]. Beyond its role as one of the commonly used TCMs, G. elata is also a functional food. The Chinese government officially announced in 2019 that it can be applied as a “medicinal food homologous” plant [6]. In daily life, G. elata is employed to make various tonic diets, such as fish head soup, stewed chicken and ham, yam congee, etc., which indicates the valued and promoted trend in the field of TCM and food.
Geographical indication (GI) refers to products that grow in a certain geographical area, with a specific quality, reputation, or other characteristics, and are mainly determined by natural and human factors in the area. G. elata grows in Xiaocaoba Town, Yiliang County, Zhaotong City, Yunnan Province, and Dafang County, Bijie City, Guizhou Province. Lv et al. [7] proposed that it is necessary to distinguish between GI and non-GI G. elata since GI products may attract consumers and influence their purchasing decisions. Experts can distinguish between GI and non-GI G. elata through visual perception and sensory evaluation, while this analysis is highly subjective and lacks reproducibility due to the variability of individuals and samples [8]. The traditional identification method is to collect G. elata samples from different origins and harness instruments like high-performance liquid chromatography (HPLC), mass spectrometry (MS), gas chromatography-mass spectrometry (GC-MS), etc., for analysis. After detecting the content of certain chemical components of G. elata, the equipment quantitatively uses it as a testing parameter to evaluate the quality level and category. Through using UPLC-ESI-QTOF-MS/MS and HPLC-UV, Su et al. [9] determined the content of 7 components of G. elata. Instruments including HPLC and GC-MS can provide highly accurate analytical results and then aid in identifying the differences between G. elata samples of different origins and assess their quality, whereas HPLC and GC-MS are cumbersome to operate and use chemicals harmful to the environment and human health. Consequently, non-destructive testing technology possesses an important application prospect in the analysis of G. elata and other Chinese medicinal materials.
Spectroscopy is the most widely applied method in geographical origin classification, and attenuated total reflectance-Fourier transform infrared spectroscopy (ATR-FTIR) analysis is characterized by the advantages of simple operation, fast analysis speed, no damage to samples, and requiring fewer samples and represents a pivotal technical approach widely used in various fields [10]. Spectroscopic techniques, especially ATR-FTIR, contribute much to the field of modern analytical chemistry and biomaterials. ATR-FTIR technology is used in basic chemical analysis and is also widely employed in exploring the homology of medicine and food and the quality identification of Chinese medicinal materials. ATR-FTIR has been utilized for the identification of G. elata origin [11,12], accurate identification of G. elata GIs [13], and the identification of Fritillaria species from various plant sources [14]. Being an efficient analytical method, ATR-FTIR can generate high-throughput, non-specific, and redundant data [15]. This feature can still bring some challenges in data analysis, even it is a significant advantage in data acquisition. With the development of chemometrics, an increasing number of efficient data processing methods have been proposed to tackle the complexity of infrared spectral data. Combined with Principal component analysis (PCA), Partial least squares discrimination (PLS-DA), Support vector machines (SVM), and other analysis methods, He et al. [16,17] used FT-NIR spectral data to identify the drying temperature of Amomum tsao-ko, and determined the quality grade of wine by ML model based on RF and K-Nearest Neighbors (KNN) algorithms. To address adulteration and abuse in the aboveground parts of herbal medicines, Song et al. constructed and evaluated ten different machine learning (ML) models based on ATR-FTIR spectroscopy [18]. Correspondingly, it is not difficult to find from the literature that the combination of ATR-FTIR and chemometrics gives full play to its advantages in identification.
This research aims to use ATR-FTIR technology, combined with chemometric methods, to quickly and accurately identify GI and non-GI G. elata. First of all, a total of 248 G. elata samples from Yunnan and Guizhou were dried under the same conditions. Secondly, the effectiveness of G. elata sample classification for GI and non-GI was evaluated separately through PCA. Thirdly, after the implementation of 10 spectral preprocessing methods, PLS-DA, SVM, and Data-driven soft independent modeling of class analogy (DD-SIMCA) models were constructed to compare the adaptability of ATR-FTIR technology integrated with chemometrics in distinguishing GI from non-GI G. elata. Finally, a Resnet model was established based on G. elata 2DCOS data to distinguish the G. elata production areas in Yunnan Province and Guizhou Province. In this study, a reliable G. elata identification model was set up for GI and non-GI, which provided a scientific basis for analyzing the geographical sources of G. elata, exhibiting important application prospects in the medicinal and edible industries, quality control of medicinal materials, etc.
2. Materials and Methods
In 2023, fresh cultivated G. elata samples were collected in Yunnan Province (Zhaotong Xiaocaoba and Not xiaocaoba (Yongshan County and Zhenxiong County) and Guizhou Province (Dafang County and Not dafang County (Hezhang County and Jinsha County) in China, totaling 248 samples (Table 1). They were identified by Professor Huang Hengyu of Yunnan University of Traditional Chinese Medicine. The relevant sample information has been shown in Figure 1. All tubers were washed, dried, crushed, and sieved through a 100-mesh sieve. The powder was stored in a plastic sealed bag at room temperature for further analysis.
| Origin | Abbr. | Total | Train set | Test set | |
|---|---|---|---|---|---|
| Zhaotong city, Yunnan Province | Xiaocaoba town of yiliang county | XCB | 59 | 41 | 18 |
| Yongshan county | YS | ||||
| Zhenxiong county | ZX | 60 | 42 | 18 | |
| Bijie city, guizhou Province | Dafang county | DF | 68 | 48 | 20 |
| Hezhang County | HZ | ||||
| Jinsha County | JS | 61 | 43 | 18 | |
Note: The geographical indication production areas are XCB and DF, while the non-geographical indication production areas comprise YS, ZX, HZ, and JS, corresponding to NXCB (comprising YS and ZX) and NDF (comprising HZ and JS).
- (a) Gastrodia elata Bl. Sample. (b) and (c) Sample site information.
2.1. Spectral collection
A Fourier transform infrared spectrometer (Perkin Elmer, USA) equipped with ZnSe attenuated total reflection attachment and OMNIC 9.77 (Thermo Fisher Scientific, USA) software was used for spectral acquisition and analysis. G. elata powder was placed on ZnSe crystal material for spectral scanning. ATR-FTIR spectral data within the wavenumber range of 4000-400 cm-1 was recorded. Each sample was scanned 64 times with a resolution of 8 cm-1 and repeated 3 times under the same conditions to verify accuracy and obtain the average spectrum for further analysis.
2.2. Spectral data preprocessing
The collected sample spectra were converted into a dataset using SIMCA-P+14.1 software (Umetrics, Umea, Sweden). The original ATR-FTIR spectrum was pre-processed to remove interference information, such as background, noise, and baseline drift. This study applied preprocessing methods, such as savitzky-golay smoothing (SG), second derivative (SD), multiple scattering correction (MSC), and standard normal variable (SNV) smoothing separately and in combination. SG smoothing is a commonly used spectral data smoothing method that smoothens curves by local polynomial fitting of spectral data, reduces the effect of noise, and maximizes the retention of the peak characteristics of the original spectral signal [19]. The SD can enhance the slope change of spectral data, extract fine features, and is often used for preprocessing to reduce random noise and improve signal frequency resolution [20]. The MSC corrects the scattering effect in the spectral data, making the spectral intensity more consistent between different samples and helping to improve the comparability of the data [21]. The SNV corrects the spectral baseline shift, eliminating differences due to equipment drift, sample placement, and particle size changes. It improves the ability of spectral comparison and understanding, highlights the main characteristics of the spectrum, and reduces the impact of scale differences between samples on the analysis results, helping to find small spectral changes [22]. SD with nine smoothing points is used to amplify FTIR and NIR spectral differences and eliminate baseline bias [23]. Chen et al. [12,24] performed SG smoothing pretreatment on the selected NIRS band, and applied SNV and MSC to NIRS and ATR-FTIR spectral pretreatment for honey adulteration.
2.3. Soft
ATR-FTIR transmittance was converted to absorbance using the OMNIC 9 software. Spectral data was preprocessed, and PLS-DA modeling was performed using SIMCA 14.1 software. Origin 9.1 software was used to draw. MATLAB 2023a software was used to establish SVM and DD-SIMCA models, as well as acquire of 2DCOS images. ResNet was built in the Spyder (Anaconda 3) software.
2.4. Model construction
Before data modeling, the sample was randomly divided into 70% training and 30% test sets by the Kennard-Stone algorithm, and stoichiometric analysis included multivariate statistical techniques, such as PCA, PLS-DA, SVM, and Random forests (RF). The performance of these classification algorithms on GI and non-GI spectral preprocessing data sets was compared.
Principal component analysis (PCA) is a kind of multivariate statistical method that transforms the collected data dimension and data of dimension reductions after further linear classification, a reduction in the number of features and complexity, while retaining most of the original data information [25]. Thus, the classification and differentiation of samples from different places can be realized, and the potential hidden characteristics and rules can be found.
PLS-DA is a method that combines Partial Least Squares Regression (PLS) and Discriminant Analysis (DA), commonly used for processing high-dimensional data with classification labels [26,27]. PLS-DA aims to find the component with the greatest covariance between the observed variable (X) and the response variable (Y) while achieving the best distinction between classes. PLS-DA is suitable for processing high-dimensional data with classification labels, helping to solve classification and prediction problems in data analysis while providing solutions for data reduction and feature selection.
Support vector machine (SVM) is a classical nonlinear supervised learning modeling method, which has outstanding advantages for the analysis and modeling of nonlinear relations of high-dimensional input variables. By finding an optimal hyperplane, the distance between sample points and this hyperplane is as far as possible [28]. The goal of SVM is to maximize the spacing to ensure better classification of different classes. This study employs the grid search algorithm (GS) to optimize the values of parameters c and g. To be specific, parameter c represents the degree of error acceptance of the model, in which too large or small c can bring poor generalization of the SVM model. Besides, the parameter g attached to the RBF function chosen as the kernel determines the distribution of the data set mapped to the high-latitude factor space.
DD-SIMCA is a multi-variable data analysis method based on the soft independent modeling of class analogy (SIMCA) algorithm. First, the scoring distance (SD) and orthogonal distance (OD) of each sample in the training set were calculated. Then, the acceptance region of the target class was established based on different methods. The purpose of the acceptance region is to determine whether the test set is considered to belong to the target class. Finally, the non-target class samples were substituted into the trained model for classification prediction [29,30].
A residual network (ResNet) is a deep convolutional neural network structure. Compared with ordinary neural networks, ResNet does not need to learn the entire input and output process but only the difference between output and input (residual) to minimize the training difficulty [31]. By introducing residual blocks, the ResNet enables the network to learn residuals directly rather than the difference between the original input and output. In this way, the problems of gradient disappearance and explosion can be effectively alleviated, and the training efficiency and generalization ability of the network can be improved [32].
2.5. The acquisition of 2DCOS image dataset
The generalized 2DCOS algorithm can obtain and analyze a series of dynamic spectra by applying external interference to the sample and finally carry out correlation analysis to obtain the 2DCOS image. The argument changes from continuous time to v. t is the external disturbance, and m is the spectrum measured by m steps at the same disturbance time interval t, as shown in Eq. (1).
The intensity of synchronous two-dimensional correlation between v1 and v2 is expressed as formula (Eq. 2).
The strength of the asynchronous two-dimensional correlation between v1 and v2 is expressed as formula (Eq. 3).
In formula (Eq. 4), where N is the Hilbert-Noda matrix.
The comprehensive two-dimensional correlation spectrum between v1 and v2 is defined as formula (Eq. 5).
2.6. Model performance evaluation parameters
In the model performance evaluation, the evaluation indicators such as RMSEE, RMSECV, RMSEP and accuracy (Acc) are selected, and their respective calculation methods are as the following formula (Eqs. 6-9).
is the measured value, is the predicted value, is the sample size, and is the number of variables considered in the model.
TP: Number of true positive
TN: Number of true negatives
FP: Number of false positives
FN: Number of false negative
3. Results and Discussion
3.1. ATR-FTIR analysis
The original and average mid-infrared spectra of GI and non-GI G. elata in Yunnan and Guizhou have been presented in Figure 2. Although artificially cultivated G. elata comes from different production areas in Yunnan and Guizhou, the spectra of different regions usually show similar trends. However, absorption intensity presents certain differences, which suggests that G. elata may differ slightly in the chemical composition of different regions.
- ATR-FTIR spectrum. (a) The original spectra (Left: Yunnan, Right: Guizhou). (b, c) Average spectrogram.
The strong broad band centered on 3278.8 cm-1 may correspond to hydroxyl (-OH) stretching vibrations of phenolic compounds in G. elata, including hydroxyl absorption in phenolic compounds [33]. The presence of 2927.7 cm-1 may be the symmetric and asymmetric stretching vibrations of C-H in aliphatic hydrocarbons in terpenoids [34]. Phenolic compounds in G. elata or other compounds containing carbonyl (C=O), including carbonyl absorption in phenolic compounds, are likely to be present at 1628.6 cm-1, and 1412.6 cm-1 usually corresponds to the methyl (CH3) functional group, which indicates compounds containing methyl functional groups in G. elata. It is possible that C=O, thioether bond (S-S, S-C, and C-S) correspond to 1336.9, 1234.3, 1147.9, and 929.1 cm-1, respectively [35,36]. What’s more, 1075.1 cm-1 may demonstrate compounds that contain hydroxyl functional groups in G. elata. The peaks corresponding to 856.2 cm-1 and 759 cm-1 are associated with C-H bending vibrations in aromatic compounds. Due to the very similar metabolic composition of G. elata, it is challenging to distinguish the original spectrum, and more sensitive machine-learning techniques must be employed to identify GI and non-GI G. elata.
3.2. Exploratory PCA analysis
In order to explore the similarities and differences between GI-producing areas and non-GI-producing areas, the principal component analysis was conducted to reduce the infrared spectral data of GI and non-GI G. elata. The results of PCA (Figure 3) showed the distribution of samples from Yunnan and Guizhou provinces in the principal component space, which facilitates the realization of GI and non-GI G. elata identification. PC1 and PC2, the first two principal components of the PCA score plot (Figure 3a), accounted for 88.4% and 9.0% of the total variance, respectively. Taken together, there is a high cumulative variance contribution of these two principal components, indicating that they contain most of the data variability. However, for the original ATR-FTIR of the samples, there was a classification overlap of the two types of samples in the score map, meaning that less difference existed in chemical composition between the GI and non-GI regions within the space constructed by the first two principal components. Figure 3(b) depicts the PCA results of different regions in Guizhou. The first two principal components account for over 90.0% of the variance explanation rate, with PC1 contributing 90.8% and PC2 contributing 6.7%, which implies that these two principal components not only more effectively explain the variance of the original data but also possess strong information preservation ability.
- The establishment of PCA model to analyze the PCA results of geographical indication production areas and non-geographical indication production areas. (a) Yunnan (XCB, NXCB); (b) Guizhou (DF, NDF). Best Spectral Preprocessing Image. (c) Yunnan SNV+SD; (d) Guizhou SG+SD.
Although PCA can effectively explain the variance of the original data, there remains an overlap in the classification of GI and non-GI G. elata in Yunnan and Guizhou. Certain GI areas and non-GI areas probably exhibit similarities or differences. Due to the high similarity of data features and the uneven distribution of data, overlap of GIS and non-GI G. elata samples in principal component space in different provinces may be caused. It was identified that PCA does not well describe the differences between samples, which is consistent with geo-traceable studies of porcini, green tea, and canola oil [37-39]. Hence, the establishment of supervised machine learning models plays a necessary role in attaining more accurate traceability, including PLS-DA, SVM, and ResNet.
3.3. Chemometrics
3.3.1. PLS-DA results
Spectral preprocessing aims to improve data quality, highlight useful information, and eliminate interference factors, which can provide a reliable basis for subsequent data analysis and model. As can be seen from Table 2, the spectral data of G. elata in Yunnan Province obtained poor results without preprocessing, which still has room for improvement. After employing single or combined spectral preprocessing, improvement was witnessed in PLS-DA model R2 and Q2 compared with the original spectra, while a slight decrease was seen in the values of RMSEE, RMSECV, and RMSEP. SD is often used in spectral preprocessing to enhance peak value, improve signal-to-noise ratio, and correct baseline drift. The results of the preprocessing methods in Table 2 demonstrated that when harnessing SD alone, its R2 and Q2 values were the highest compared with the other four spectral preprocessing methods, implying that SD is a more suitable spectral preprocessing method for Yunnan G. elata in specific datasets and models. After SG smoothing pretreatment, the equivalent values of R2, Q2, RMSEE, RMSECV, and RMSEP were close to those of the original spectrum. SG smoothing pretreatment lacks in improving the stability and reliability of modeling, though it aids in reducing noise and fluctuations in the spectrum. There is the largest R2 (0.903) and Q2 (0.653) in SNV combined with SD. SD can excel at the subtle features and changes in the spectral data, while SNV can eliminate the scale effect in the data, which enables the data to be more consistent with the normal distribution and further verifies that the combined spectral pretreatment can better enhance the model performance (Figure 3c). In summary, both single and combined spectral preprocessing exhibited improved PLS-DA prediction ability, albeit to different degrees of improvement.
| Pretreatment | R2 | Q2 | RMSEE | RMSECV | RMSEP | Train set Acc (%) | Test set Acc (%) |
|---|---|---|---|---|---|---|---|
| Raw | 0.0473 | 0.0178 | 0.494 | 0.4955 | 0.5072 | 60.24 | 61.11 |
| MSC | 0.521 | 0.278 | 0.3568 | 0.445 | 0.487 | 87.95 | 58.33 |
| SNV | 0.522 | 0.277 | 0.3565 | 0.447 | 0.4876 | 89.16 | 55.56 |
| SG | 0.145 | 0.06 | O.4940 | 0.4955 | 0.5072 | 60.24 | 61.11 |
| SD | 0.857 | 0.609 | 0.1941 | 0.3122 | 0.3291 | 94.96 | 83.33 |
| MSC+SNV | 0.522 | 0.278 | 0.3567 | 0.4453 | 0.4871 | 87.95 | 58.33 |
| MSC+SG | 0.589 | 0.252 | 0.3329 | 0.4514 | 0.5058 | 91.57 | 61.11 |
| SNV+SG | 0.521 | 0.277 | 0.3568 | 0.4462 | 0.4896 | 86.75 | 55.56 |
| MSC+SD | 0.806 | 0.571 | 0.2242 | 0.3316 | 0.3999 | 97.59 | 75.00 |
| SNV+SD | 0.903 | 0.653 | 0.1595 | 0.3058 | 0.3205 | 100.00 | 88.89 |
| SG+SD | 0.854 | 0.603 | 0.1957 | 0.3149 | 0.3278 | 100.00 | 83.33 |
Note: R2: Explains the ability of the model to fit the data; Q2: Indicates the prediction ability of the model to new data; RMSEE: Root mean square error of estimation; RMSECV: Root mean square error of cross-validation; RMSEP: Root mean square error of prediction; Acc: Accuracy. The bold text indicates the optimal preprocessing method.
Table 3 shows the spectral preprocessing results of GI and non-GI G. elata in Guizhou. The results obtained by a single method are consistent with those in Yunnan, in which excellent findings are presented by SD. The spectral pretreatment of MSC+SNV, MSC+SG, and SNV+SG indicates close equivalent values of R2, Q2, RMSEE, RMSECV, and RMSEP. The results imply that SG+SD serves as the best spectral preprocessing method to obtain the maximum accuracy of the training set and the test set (Figure 3d). Consequently, suitable pretreatment methods should be selected according to their characteristics and data performance for different spectral data sets, which can therefore improve data quality, underline sample characteristics, and provide a reliable basis for subsequent analysis and model. Hence, it is essential to flexibly select the best pretreatment when processing spectral data. The results imply that the accuracy of both of them in the training set is 100% (Table 2, Table 3), whereas the accuracy of Yunnan in the test set is 88.89% (Table 2), which is lower than the 94.74% of the Guizhou test set (Table 3), and the confusion matrix is shown in Figure 4. Some differences are likely to be exhibited by the sample data of Yunnan Province and Guizhou Province, including the growth environment, climate, soil, and other factors, potentially resulting in some differences in the spectral data of G. elata in different regions, which enables the established model to perform differently on the test set in different regions.
| Pretreatment | R2 | Q2 | RMSEE | RMSECV | RMSEP | Train set Acc (%) | Test set Acc (%) |
|---|---|---|---|---|---|---|---|
| Raw | 0.46 | 0.304 | 0.3775 | 0.45 | 0.331 | 81.32 | 86.84 |
| SD | 0.949 | 0.837 | 0.1165 | 0.2171 | 0.2442 | 100.00 | 94.74 |
| MSC | 0.444 | 0.32 | 0.3842 | 0.4125 | 0.3357 | 78.02 | 86.84 |
| SNV | 0.307 | 0.245 | 0.4203 | 0.4339 | 0.3981 | 79.12 | 84.21 |
| SG | 0.485 | 0.388 | 0.4751 | 0.4779 | 0.4655 | 67.03 | 57.89 |
| MSC+SNV | 0.427 | 0.32 | 0.3842 | 0.4125 | 0.3357 | 78.02 | 86.84 |
| MSC+SD | 0.888 | 0.694 | 0.1702 | 0.2779 | 0.2589 | 98.9 | 94.74 |
| MSC+SG | 0.428 | 0.321 | 0.3839 | 0.4121 | 0.3357 | 78.02 | 86.84 |
| SNV+SD | 0.96 | 0.736 | 0.1033 | 0.2661 | 0.2361 | 100.00 | 94.74 |
| SNV+SG | 0.428 | 0.321 | 0.3839 | 0.4122 | 0.3351 | 76.92 | 86.84 |
| SG+SD | 0.945 | 0.828 | 0.12 | 0.222 | 0.2469 | 100.00 | 94.74 |
The bold text indicates the optimal preprocessing method.
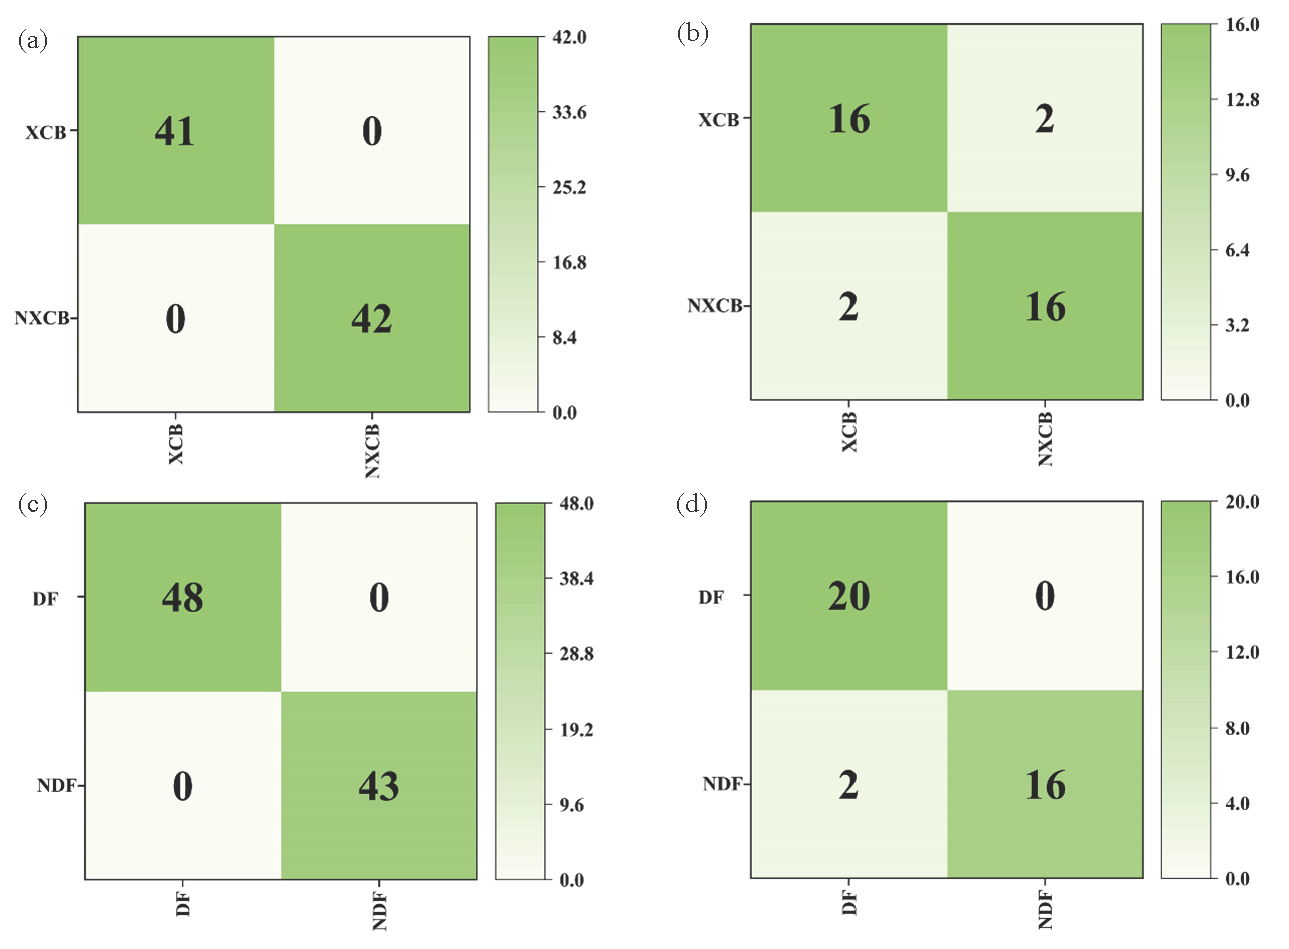
- Confusion matrix results of PLS-DA model training set and test set. (a, b) Yunnan; (c, d) Guizhou.
On the basis of the best pretreatment spectral data, the PLS-DA model was established, and a good classification was demonstrated by G. elata in GI-producing areas and non-GI-producing areas in Yunnan Province (Figure 5a). The cumulative variance explanation rate of the first two principal components in PLS-DA score chart accounted for 17.5% of the total variance, of which PC1 explained 13.8% and PC2 explained 3.7%, respectively. The cumulative variance explanation rate is an important indicator to evaluate the degree of variation of the model’s interpretation data, in which the higher value indicates the stronger interpretation ability of the model to the data. Under such circumstances, the explanatory power of PC1 is significantly higher than that of PC2 despite the relatively low cumulative variance interpretation rate, indicating that PC1 plays a more significant role in distinguishing samples. However, the PLS-DA scoring plot (Figure 5b) clearly reveals the distribution differences of G. elata samples in the principal component space of DF and non-GI regions. PC1 and PC2 explained 20.5% and 6.2%, respectively, of the variables in the spectral data, which may also mean that it is difficult to distinguish G. elata samples from GI and non-GI regions of these two principal components.
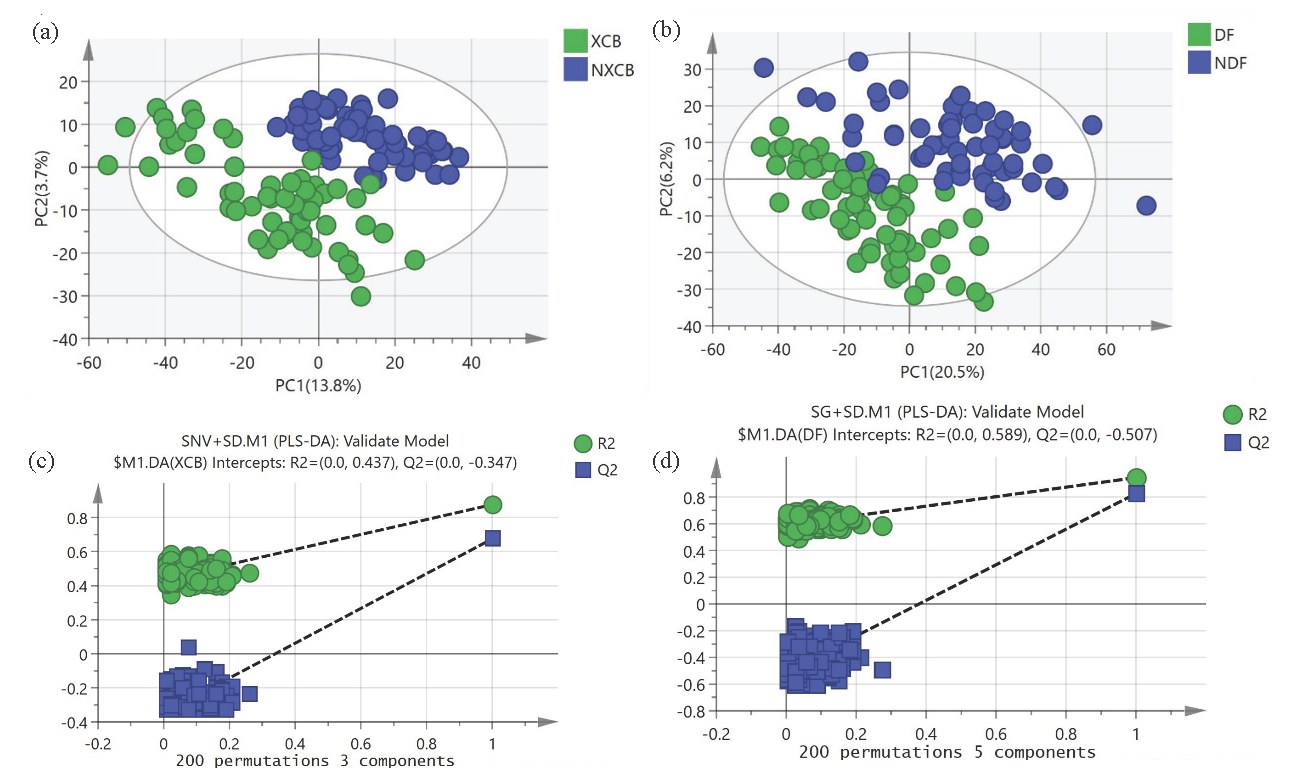
- PLS-DA score plot and permutation test result plot. (a, c) Yunnan; (b, d) Guizhou.
Regarding G. elata from GI and non-GI production areas in Yunnan Province and G. elata from Guizhou Province, the importance of substitution is leveraged to evaluate the fitting degree of the model. The phenomenon that the corresponding model training set has better predictive performance and poorer validation for unknown external samples is explained. For the PLS-DA model, the Q2 and R2 values generated by each iteration are lower than the Q2 and R2 values in the upper right corner. All the above results demonstrate that the model is not overfitted for each category of discrimination (Figure 5c and 5d).
3.3.2. Analysis of DD-SIMCA results
To improve the prediction accuracy of the model, DD-SIMCA attempted to directly distinguish between geographical indications and non-geographical indications in Yunnan Province and Guizhou Province and investigate the impact of different spectral data processing techniques on the performance of the model. The DD-SIMCA model is a modeling method that can be used to analyse and identify anomalies, which primarily focuses on anomaly detection and classification in dynamic data processes. The acceptance area (the area within the green curve), outlier limitation (the red curve), rule samples (the green dots), extremum (the yellow square), and outliers (the red square) for the samples used in model construction have been provided in the acceptance graph of TrainSet. In Figure 6, sub-figures Figure 6(a) and 6(c), it can be seen that under the best preprocessing method, the G. elata spectral data from Yunnan and Guizhou possess 1 and 2 samples located in the “extreme region” (yellow dots), respectively, and no samples located in the “abnormal region” (above the red threshold). When ATR-FIR is leveraged for data, all models cannot achieve 100% sensitivity regardless of preprocessing techniques, revealing that non-geographical indications G. elata in Yunnan and Guizhou cannot be correctly identified. However, the highest number of correctly classified non-GI G. elata using SD was 33 for G. elata from Yunnan, in which 27 out of 60 samples were projected to the geographical indication G. elata area. Consequently, the SD/D-SIMCA model obtained the best results, with a sensitivity of 96.67% and specificity of 55.00% for non-target classes (Figure 6b). By using the SG/D-SIMCA model, 52.46% of Guizhou’s non-geographical indication G. elata was correctly classified, in which 29 samples were misclassified and the sensitivity was 93.44% for non-target categories (Figure 6d).

- The DD-SIMCA results. Acceptance maps for training sets (a) Yunnan and (c) Guizhou; (b) Yunnan and (d) Guizhou are the predicted results of the test set.
In summary, the model cannot identify all non-geographical indication G. elata samples from Yunnan and Guizhou as non-target classes, which reveals that it cannot be harnessed to reject non-geographical indication samples. The possible reasons for this are as follows. First of all, the DD-SIMCA model relies on the characteristics of the input data. The model may not be able to effectively distinguish them if the geographical indication production areas and non-geographical indication production areas possess a high similarity or overlap in data features, including close distances between production areas. Secondly, the DD-SIMCA model requires a large amount of data for effective training and modeling. In case of insufficient sample data ON Yunnan and Guizhou, the model may not be able to capture the small differences between them. Being a linear model-based method that may have limitations in handling nonlinear features, DD-SIMCA can cause lower classification performance compared to PLS-DA and SVM models. SEN represents the model’s ability to correctly classify target classes (regular samples), while SPE serves as the model’s ability to correctly classify non-target classes (foreign samples).
3.3.3. SVM analysis
SVM refers to a classical model commonly utilized to solve nonlinear problems. As a two-classification model, its basic model is a linear classifier that establishes the maximum interval in the feature space to reduce overfitting. The larger the g is, the higher the mapping dimension is, the better the training result is, whereas the more likely it is to cause overfit. In Table 4, the optimization results of the important parameters and the accuracy of the training and test sets have been shown. Prior to building the SVM model, the raw spectral data were preprocessed in 10 different ways. The optimal values of penalty factor c and kernel parameter g were obtained by the grid search method, and the SVM model was also constructed. The model results have been shown in Table 4. However, it is essential to specify the reasonable range of the two parameters of SVM according to the situation since the places of G. elata exhibit some differences. After undergoing MSC+SD and SNV+SD spectral preprocessing, the original spectra of G. elata from Yunnan showed excellent performance, yielding consistent c and g values of 2 and 0.0039062, respectively (Figure 7a), which indicates that the parameter adjustment effect of the model is good and can better fit the data. At the same time, the accuracy of the training set reached 93.98% (Figure 7b), and the results of the confusion matrix demonstrated classification errors (Figure 7c). Nevertheless, the accuracy of the test set reached 91.67%, which implies that the model not only possesses good generalization capability to a certain extent but also achieves a relatively considerable accuracy on the test data.
| Data set | Best c | Best g | Training set Acc (%) | Test set Acc (%) |
|---|---|---|---|---|
| Raw | 524288 | 1.079×10⁻⁵ | 91.57 | 69.44 |
| MSC | 32768 | 1.079×10⁻⁵ | 91.57 | 75.00 |
| SG | 262144 | 2.1579×10⁻⁵ | 91.57 | 69.44 |
| SNV | 23170.475 | 1.5259×10⁻⁵ | 91.57 | 75.00 |
| MSC+SG | 46340.95 | 7.6294×10⁻⁶ | 91.57 | 75.00 |
| MSC+SNV | 32768 | 1.079×10⁻⁵ | 91.57 | 75.00 |
| SNV+SG | 32768 | 1.079×10⁻⁵ | 91.57 | 75.00 |
| SD | 45.2548 | 0.00024414 | 92.77 | 88.89 |
| MSC+SD | 2 | 0.0039062 | 93.98 | 91.67 |
| SG+SD | 5.6569 | 0.0013811 | 90.36 | 88.89 |
| SNV+SD | 2 | 0.0039062 | 93.98 | 91.67 |
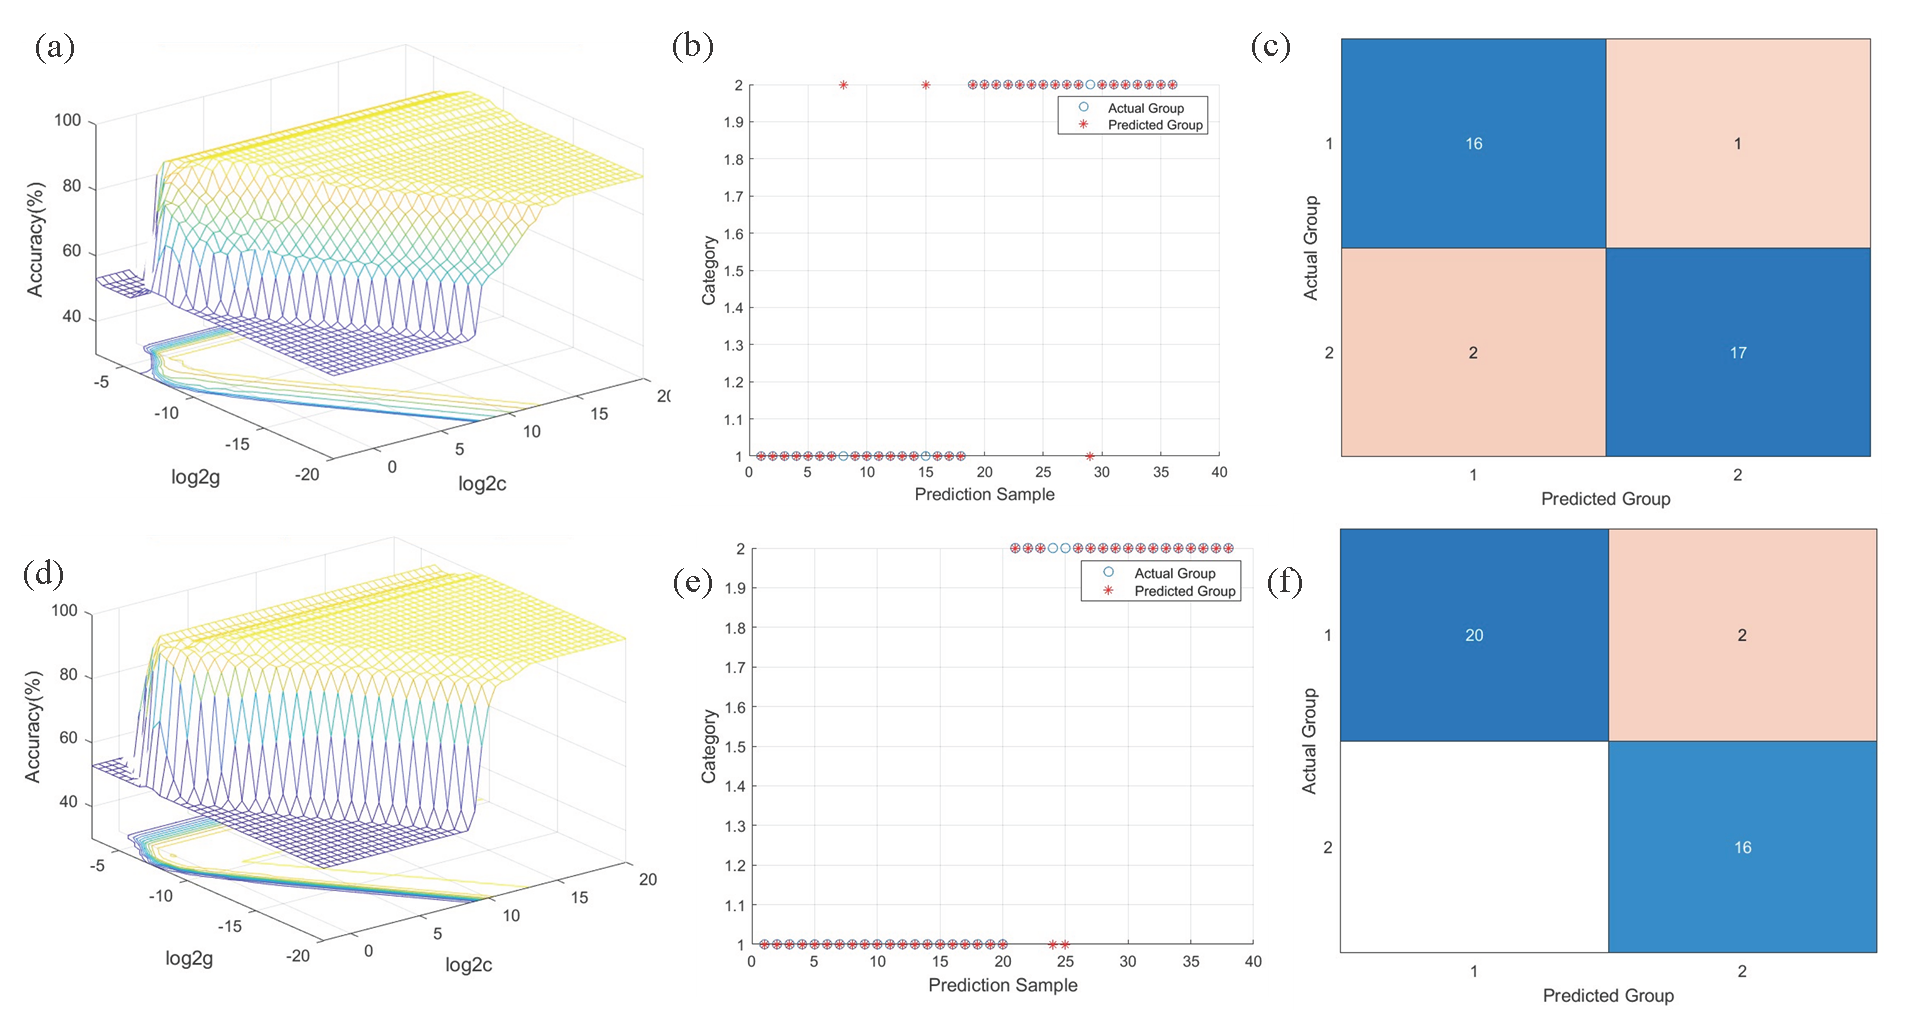
- SVM results. SVM parameter selection results, test set accuracy, and confusion matrices. (a-c) Yunnan Province; (d-f) Guizhou Province.
Being a supervised learning algorithm with classification and regression capabilities, SVM constructs hyperplanes in K-dimensional feature spaces to maximize the spacing between adjacent classes [10]. After the model parameters are adjusted, it can better align with the data characteristics, and under the best spectral preprocessing, the best c and g obtained are 5.6569 and 0.0013811, respectively (Figure 7d). In the ATR-FTIR model, the accuracy of the training set in the SVM model was as high as 100.00% (Table 5), and the accuracy of the test set was 94.74% (Figure 7e). The two type 2 samples in the test set were incorrectly set up (Figure 7f). Generally speaking, the SVM model both presents robust explanatory power and is capable of effectively distinguishing G. elata samples from GI-producing areas and non-GI-producing areas in Yunnan and Guizhou.
| Data set | Best c | Best g | Training set Acc (%) | Test set Acc(%) |
|---|---|---|---|---|
| Raw | 262144 | 2.1579×10⁻⁵ | 93.41 | 94.74 |
| SD | 5.6569 | 0.0013811 | 97.80 | 94.74 |
| MSC | 8192 | 4.3158×10⁻⁵ | 94.51 | 92.11 |
| SNV | 16384 | 2.1579×10⁻⁵ | 94.51 | 92.11 |
| SG | 741455.2002 | 1.079×10⁻⁵ | 92.31 | 94.74 |
| MSC+SNV | 5.6569 | 0.0013811 | 100.00 | 94.74 |
| MSC+SG | 23170.475 | 1.5259×10⁻⁵ | 94.51 | 89.47 |
| MSC+SD | 5.6569 | 0.0013811 | 100.00 | 94.74 |
| SNV+SD | 16 | 0.00097656 | 98.90 | 52.63 |
| SNV+SG | 32768 | 1.079×10⁻⁵ | 94.51 | 89.47 |
| SG+SD | 5.6569 | 0.0013811 | 97.80 | 94.74 |
3.4. Deep Learning
3.4.1. The 2DCOS spectra dataset
Two-dimensional correlation infrared (2D-IR) spectroscopy was first developed by Dr.IsaoNoda and subsequently extended to other analytical methods, and the concept of generalized 2DCOS was further proposed. To identify G. elata samples from different producing areas in Yunnan and Guizhou, this research compared three kinds of 2DCOS images, namely synchronous, asynchronous, and integrated 2DCOS (i2DCOS). By mapping one-dimensional (1D) information to two-dimensional space, 2DCOS improves spectral resolution and effectively solves the problem of overlapping absorption peaks of the same functional group in one-dimensional spectra. The mathematical methods were conducted to obtain the synchronous, asynchronous, and i2DCOS images (128×128 pixels) of G. elata in different production areas. Figure 8 shows the representative synchronous (Figure 8a(A1-A6)), asynchronous (Figure 8b(B1-B6)), and i2DCOS (Figure 8c(C1-C6)) of the six producing areas. In 2DCOS, the characteristic peaks are primarily divided into automatic peaks and cross peaks. Specifically, automatic peaks usually appear on the diagonal of the spectrum and, therefore, are also called diagonal peaks. In the area of the automatic peak in the spectrum, the degree of spectral intensity change under this wave number is reflected. The automatic peak is always positive, which means that the trend of increasing or decreasing spectral intensity is consistent at that wave number. There are usually cross peaks on both sides of the diagonal, and both positive and negative peaks appear simultaneously, indicating the type of autocorrelation (positive or negative correlation) of the spectral intensity change. Nevertheless, it may be subjective to identify G. elata from different origins in Yunnan and Guizhou provinces by two-dimensional spectrograms alone, as spectrograms can only provide limited information, and deep learning techniques like ResNet can be used to more accurately identify the origin.

- (a) Synchronous (A1-A6), (b) Asynchronous (B1-B6), and (c) Integrated (C1-C6) two-dimensional correlation spectra.
3.4.2. ResNet model analysis
The RseNet model, based on synchronous, asynchronous, and i2DCOS, was established since it is inaccurate to distinguish between GI production areas and non-GI production areas of G. elata solely based on the difference in 2DCOS recognized by the naked eye. Under the same number of iterations (200 epochs) and learning rate (0.01), Figure 9(a-c) reveals the accuracy curves of the training set and the test set of the three ResNet models with 2DCOS, with significant differences in the cross-entropy loss function curve and the confusion matrix of the external verification set. An accuracy curve is utilized to assess the model’s recognition ability, and a cross-entropy loss function is employed to demonstrate the model’s convergence effect. The closer the loss value is to 0, the closer the accuracy is to 100.00%, and the stronger the recognition ability of the model is. In Table 6, the detailed parameters of the ResNet model (number of iterations, loss value, accuracy of training set, test set and external validation set) were summarized. After 200 epochs, the accuracy of the ResNet model based on the 2DCOS spectral images of the training set and the test set was 100.00%, the loss value converged to 0.019, and the accuracy of the external validation set reached 100.00%. It is speculated that the ResNet model based on synchronous 2DCOS images not only extracted the most feature variables but also presented the strongest recognition ability, which holds the potential to quickly trace the geographical origin of G. elata. As the number of iterations increases, the accuracy of the training set of the ResNet model for synchronizing and i2DCOS images established under the same number of iterations can reach 100%, with different loss values and accuracy of the test set, which are 0.769, 25.00% and 0.272, 23.00%, respectively. In the results, there was the poorest external validation accuracy of ResNet based on i2DCOS, with DF G. elata misclassified to YS and JS G. elata not accurately identified. The model is unable to accurately distinguish G. elata from different places since the i2DCOS images may not fully extract the key differences in the appearance characteristics of DF, YS, and JS G. elata.
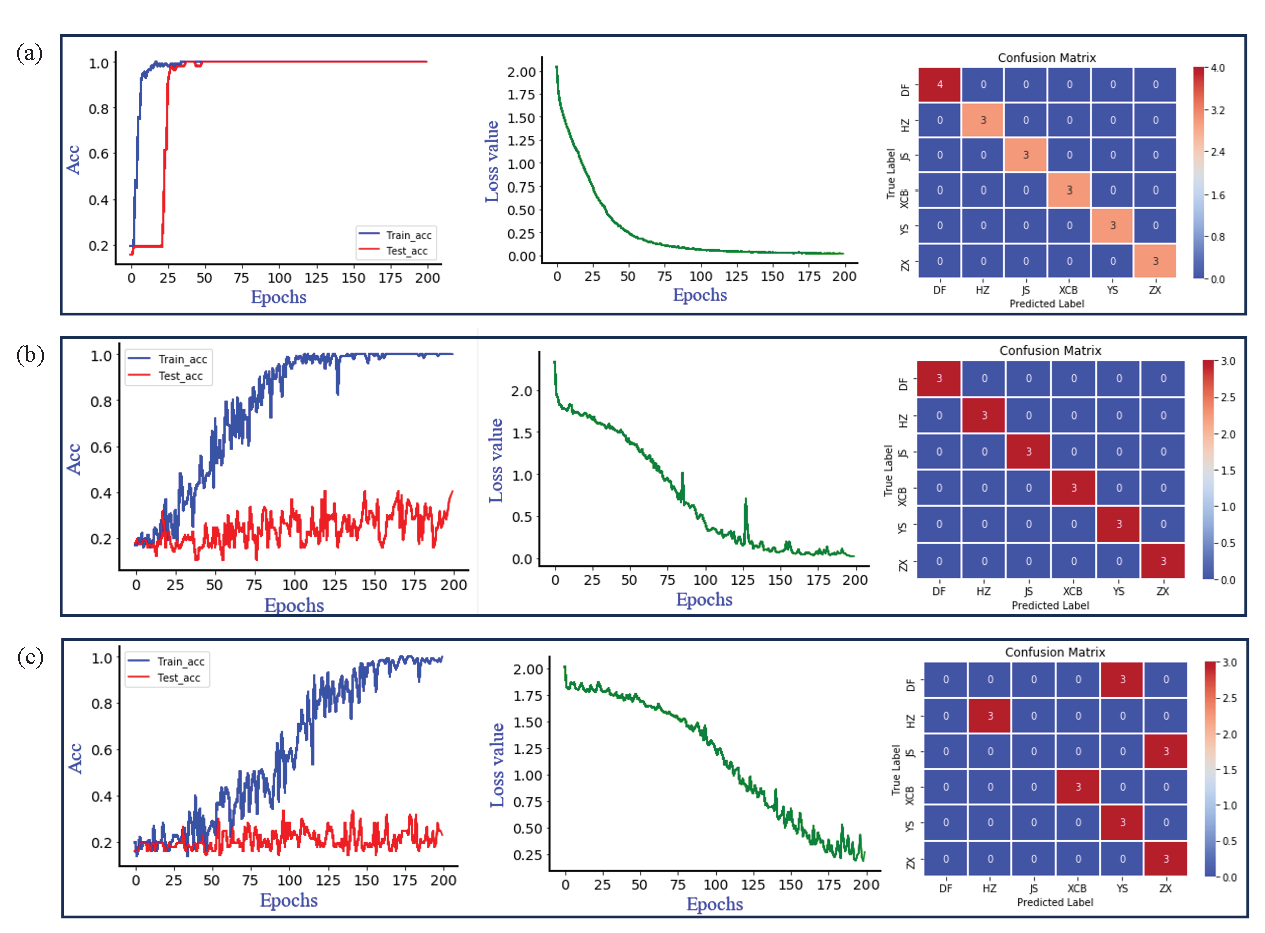
- The accuracy curves of the training and testing sets of the ResNet model, as well as the cross entropyloss function curve and the confusion matrix of the external validation set. (a) Synchronize two-dimensional correlation spectra; (b) Asynchronous two-dimensional correlation spectroscopy; (c) Integrated two-dimensional correlation spectroscopy.
| Data (2DCOS) | Epoch | Loss value | Train set Acc (%) | Test set Acc (%) | External validation Acc (%) |
|---|---|---|---|---|---|
| Synchronous | 200 | 0.019 | 100.00 | 100.00 | 100.00 |
| Asynchronous | 200 | 0.769 | 98.00 | 25.00 | 100.00 |
| Asys | 200 | 0.272 | 100.00 | 23.00 | 87.50 |
To sum up, the ResNet model training set of synchronous 2DCOS images attained 100% accuracy. It is hypothesized that asynchronous and i2DCOS images may have more noise, changes, and complex features and, therefore, make the model more difficult to learn and recognize. In contrast, synchronous 2DCOS images are likely to have more regular and simple features, which are relatively clear and stable, and the model can more easily understand and capture key feature information, thus achieving better accuracy on the training set.
4. Conclusions
In this study, the application effect of several models in the identification of G. elata GIS and non-GIS in Yunnan and Guizhou was systematically evaluated. ATR-FTIR has the advantage of non-destructive testing to realize rapid sample analysis while requiring high stability of results. DD-SIMCA performs well in category recognition but is prone to recognition errors. In addition, PLS-DA shows strong capability in processing high-dimensional data, whereas overfitting should be prevented. Relatively speaking, SVM performs well in small samples and high-dimensional space and can effectively tackle sample imbalance and identify G. elata geographical indication and non-geographical indication production areas. Regarding the proposed methods, the synchronous 2DCOS spectral ResNet model exhibited obvious advantages in the identification of G. elata from 6 production areas in Yunnan and Guizhou, both outperforming other models and achieving 100% classification accuracy, which can effectively capture the small differences between samples and reduce the loss value and is suitable for application in a complex background. In this study, the combination of chemometrics and deep learning can aid in further improving the accuracy and stability of geographical indication identification, and the results can generally provide crucial guidance and reference for the future application of non-destructive testing of medicinal and edible homologous plants.
CRediT authorship contribution statement
Qiong He: Conceptualization, Formal analysis, Writing–original draft, Writing–review & editing. Hengyu Huang: Investigation, Resources. Yuanzhong Wang: Funding acquisition, Investigation, Resources, Supervision.
Declaration of competing interest
The authors declare that they have no known competing interest or personal relationship that could have appeared to influence the work reported in this paper.
Data availability
The datasets generated during and/or analyzed during the current study are available from the corresponding author upon reasonable request.
Declaration of Generative AI and AI-assisted technologies in the writing process
The authors confirm that there was no use of artificial intelligence (AI)-assisted technology for assisting in the writing or editing of the manuscript and no images were manipulated using AI.
Acknowledgment
This work was supported by National Natural Science Foundation of China (Grant Number: 82460746), Yunnan Provincial Department of Education Scientific and Technological Innovation Team for Development and Utilization of Gastrodia Resources(Grant Number: 2024) and Zhaotong “Xingzhao Talent Support Program” Team Project(Grant Number: 2023-3).
References
- Rapid authentication of variants of gastrodia elata blume using near-infrared spectroscopy combined with chemometric methods. Journal of Pharmaceutical and Biomedical Analysis. 2023;235:115592. https://doi.org/10.1016/j.jpba.2023.115592
- [Google Scholar]
- Pharmacopoeia of the people’s republic of china. Beijing, China: China Medical Science Press; 2020. p. :319.
- [Google Scholar]
- Matrix-assisted laser desorption/ionization mass spectrometry imaging reveals “Spatial-temporal-content” changes of parishins in gastrodiae rhizoma during the steaming process. Food Research International. 2022;162:112092. https://doi.org/10.1016/j.foodres.2022.112092
- [Google Scholar]
- Variation of major components in Gastrodia elatawith primary processing procedures and chemical pattern recognition of processing procedures. Natural Product Research and Development. 2018;30:736-743, 869. https://doi.org/10.16333/j.1001-6880.2018.5.003
- [Google Scholar]
- Transcriptome sequencing reveals gastrodia elata blume could increase the cell viability of eNPCs under hypoxic condition by improving DNA damage repair ability. Journal of Ethnopharmacology. 2022;282:114646. https://doi.org/10.1016/j.jep.2021.114646
- [Google Scholar]
- Research progress on classification of chemical constituents from Gastrodia elata and their harmacological effects. Chinese Traditional and Herbal Drugs. 2022;53:5553-5564. https://doi.org/10.7501/j.issn.0253-2670.2022.17.033
- [Google Scholar]
- Key determinants of purchase intentions for geographical indication agricultural products: A hybrid PLS-SEM and ANN approach. Journal of Retailing and Consumer Services. 2025;84:104209. https://doi.org/10.1016/j.jretconser.2024.104209
- [Google Scholar]
- Rapid classification of commercial teas according to their origin and type using elemental content with x-ray fluorescence (XRF) spectroscopy. Current Research in Food Science. 2021;4:45-52. https://doi.org/10.1016/j.crfs.2021.02.002
- [Google Scholar]
- Study on the chemical composition and in vitro enzyme inhibition of different processed products of gastrodia elata. Journal of Food Composition and Analysis. 2024;130:106148. https://doi.org/10.1016/j.jfca.2024.106148
- [Google Scholar]
- Combination of PCA with LDA and SVM classifiers: A model for determining the geographical origin of coconut in the coastal plantation, aceh province, Indonesia. Case Studies in Chemical and Environmental Engineering. 2024;9:100552. https://doi.org/10.1016/j.cscee.2023.100552
- [Google Scholar]
- Identification of geographical origins of gastrodia elata blume based on multisource data fusion. Phytochemical Analysis : PCA. 2024;35:1704-1716. https://doi.org/10.1002/pca.3413
- [Google Scholar]
- Detection of adulteration in chinese honey using NIR and ATR-FTIR spectral data fusion. Spectrochimica Acta. Part A, Molecular and Biomolecular Spectroscopy. 2020;235:118297. https://doi.org/10.1016/j.saa.2020.118297
- [Google Scholar]
- ATR‐FTIR spectroscopy preprocessing technique selection for identification of geographical origins of Gastrodia elata blume. Journal of Chemometrics. 2024;38:e3579. https://doi.org/10.1002/cem.3579.
- [Google Scholar]
- Species discrimination of multiple botanical origins of fritillaria species based on infrared spectroscopy, thin layer chromatography-image analysis and untargeted metabolomics. Phytomedicine: International Journal of Phytotherapy and Phytopharmacology. 2024;123:155228. https://doi.org/10.1016/j.phymed.2023.155228
- [Google Scholar]
- Attenuated total reflectance-flourier transformed infrared spectroscopy (ATR-FTIR) coupled with deep learning: A rapid method for geographical origin identification of sea cucumber apostichopus japonicus. Microchemical Journal. 2024;204:111037. https://doi.org/10.1016/j.microc.2024.111037
- [Google Scholar]
- A rapid identification based on FT-NIR spectroscopies and machine learning for drying temperatures of amomum tsao-ko. Journal of Food Composition and Analysis. 2023;118:105199. https://doi.org/10.1016/j.jfca.2023.105199
- [Google Scholar]
- Wine Quality Analysis Using Machine Learning Algorithms. Lecture Notes in Networks and Systems 2020:106. https://doi.org/10.1007/978-981-15-2329-8_2
- [Google Scholar]
- A chemometric andmachine learning scheme for classification of 37 kinds of aerial parts of medicinalherbs based on ATR-FTIR. Microchemical Journal. 2025;209:112671. https://doi.org/10.1016/j.microc.2025.112671
- [Google Scholar]
- Prediction of soil-available potassium content with visible near-infrared ray spectroscopy of different pretreatment transformations by the boosting algorithms. Applied Sciences. 2020;10:1520. https://doi.org/10.3390/app10041520
- [Google Scholar]
- Discrimination of transgenic tomatoes based on visible/near-infrared spectra. Analytica Chimica acta. 2007;584:379-384. https://doi.org/10.1016/j.aca.2006.11.071
- [Google Scholar]
- Recent advances of chemometric calibration methods in modern spectroscopy: Algorithms, strategy, and related issues. TrAC Trends in Analytical Chemistry. 2022;153:116648. https://doi.org/10.1016/j.trac.2022.116648
- [Google Scholar]
- The classification of Iranian wheat flour varieties using FT-MIR spectroscopy and chemometrics methods. Expert Systems with Applications. 2024;239:122175. https://doi.org/10.1016/j.eswa.2023.122175
- [Google Scholar]
- Application of UV-vis-NIR and FTIR spectroscopy coupled with chemometrics for quality prediction of katsuobushi based on the number of smoking treatments. Food chemistry. 2024;442:138604. https://doi.org/10.1016/j.foodchem.2024.138604
- [Google Scholar]
- Waveband selection for NIR spectroscopy analysis of soil organic matter based on SG smoothing and MWPLS methods. Chemometrics and Intelligent Laboratory Systems. 2011;107:139-146. https://doi.org/10.1016/j.chemolab.2011.02.008
- [Google Scholar]
- Rapid evaluation of ziziphi spinosae semen and its adulterants based on the combination of FT-NIR and multivariate algorithms. Food Chemistry: X. 2023;20:101022. https://doi.org/10.1016/j.fochx.2023.101022
- [Google Scholar]
- Application of likelihood ratios and optimal decision thresholds in fire debris analysis based on a partial least squares discriminant analysis (PLS-DA) model. Forensic Chemistry. 2019;16:100188. https://doi.org/10.1016/j.forc.2019.100188
- [Google Scholar]
- Combination of interactance and transmittance modes of vis/NIR spectroscopy improved the performance of PLS-DA model for moldy apple core. Infrared Physics & Technology. 2022;126:104366. https://doi.org/10.1016/j.infrared.2022.104366
- [Google Scholar]
- Quantitative analysis of key components in qingke beer brewing process by multispectral analysis combined with chemometrics. Food Chemistry. 2024;436:137739. https://doi.org/10.1016/j.foodchem.2023.137739
- [Google Scholar]
- Geographic authentication of argentinian teas by combining one-class models and discriminant methods for modeling near infrared spectra. Chemometrics and Intelligent Laboratory Systems. 2024;251:105156. https://doi.org/10.1016/j.chemolab.2024.105156
- [Google Scholar]
- A one-class classification approach for authentication of specialty coffees by inductively coupled plasma mass spectroscopy (ICP-MS) Food Chemistry. 2024;442:138268. https://doi.org/10.1016/j.foodchem.2023.138268
- [Google Scholar]
- A geographical traceability method for lanmaoa asiatica mushrooms from 20 township-level geographical origins by near infrared spectroscopy and resNet image analysis techniques. Ecological Informatics. 2022;71:101808. https://doi.org/10.1016/j.ecoinf.2022.101808
- [Google Scholar]
- Wider or deeper revisiting the ResNet model for visual recognition. Pattern Recogn. 2019;90:119-133. https://doi.org/10.48550/arXiv.1611.10080
- [Google Scholar]
- Rapid detection of maltodextrin adulteration in pomegranate sour using ATR-FTIR spectroscopy and chemometrics. Journal of Food Composition and Analysis. 2025;140:107313. https://doi.org/10.1016/j.jfca.2025.107313
- [Google Scholar]
- Infrared spectroscopy of collagen and collagen-like polypeptides. Biopolymers. 1975;14:937-957. https://doi.org/10.1002/bip.1975.360140505
- [Google Scholar]
- Assessing saffron (Crocus sativus l.) adulteration with plant-derived adulterants by diffuse reflectance infrared fourier transform spectroscopy coupled with chemometrics. Talanta. 2017;162:558-566. https://doi.org/10.1016/j.talanta.2016.10.072
- [Google Scholar]
- ATR-FTIR spectroscopy combined with DNA barcoding and GC-MS to assess the quality and purity of saffron (Crocus sativus l.) Vibrational Spectroscopy. 2022;123:103446. https://doi.org/10.1016/j.vibspec.2022.103446
- [Google Scholar]
- Rapid prediction of nucleosides content and origin traceability of boletus bainiugan using fourier transform near-infrared spectroscopy combined with chemometrics. Spectrochimica Acta. Part A, Molecular and Biomolecular Spectroscopy. 2025;327:125421. https://doi.org/10.1016/j.saa.2024.125421
- [Google Scholar]
- Tracing the geographical origin of chinese green tea based on fluorescent sensor array combined with multi-way chemometrics analyses. Food Research International (Ottawa, Ont.). 2025;203:115838. https://doi.org/10.1016/j.foodres.2025.115838
- [Google Scholar]
- Combination of fingerprint and chemometric analytical approaches to identify the geographical origin of qinghai-tibet plateau rapeseed oil. Heliyon. 2024;10:e27167. https://doi.org/10.1016/j.heliyon.2024.e27167
- [Google Scholar]


