

Translate this page into:
Based on 1H NMR and LC-MS metabolomics reveals biomarkers with neuroprotective effects in multi-parts ginseng powder
⁎Corresponding authors. jingwei-lv@hotmail.com (Jingwei Lv), sun_jiaming2000@163.com (Jiaming Sun)
-
Received: ,
Accepted: ,
This article was originally published by Elsevier and was migrated to Scientific Scholar after the change of Publisher.
Peer review under responsibility of King Saud University.
Abstract
Abstract
In the absence of appearance features, it is becoming increasingly difficult to accurately distinguish botanical herbal powders from different families or parts of the plant. In this study, we explored the biomarkers with neuroprotective effects in multi-parts ginseng based on metabolite content changes and biological functions. First, using 1H NMR and LC-MS metabolomics techniques and multivariate statistical analysis techniques to analyze the differential metabolites (DMs) in ginseng main root (TR), lateral root (LR) and Rhizome (RZ). Also, the analysis of 14 differential metabolites (DMs) using network pharmacology yielded 23 core targets associated with neuroprotective diseases, the KEGG pathway was enriched for 117 signaling pathways and 184 enrichment processes were shown in the GO analysis. Combined with the correlation analysis of primary differential metabolites (PDMs) and secondary differential metabolites (SDMs) content and network activity, we finally identified three biomarkers in different parts of ginseng, namely sucrose, ginsenoside Rb1, and ginsenoside Rb3. Finally, the three biomarkers were validated by molecular docking and SH-SY5Y survival, and the results showed that sucrose, ginsenoside Rb1 and ginsenoside Rb3 exhibited favorable activity results in neuroprotective functions. The results of this study reveal the overall differences in the DMs of the three parts of ginseng, and three biomarkers can help identify different parts of ginseng powder, to avoid illegal substitution when ginseng is used in medicine. At the same time, it also provides a reference method for screening biomarkers that can distinguish different parts of traditional Chinese medicine.
Keywords
Multi-parts ginseng powder
1H NMR metabolomics
LC-MS metabolomics
Neuroprotection
Biomarkers

1 Introduction
Ginseng, the root and rhizome of Panax ginseng C.A.Mey., is traditionally used as an adaptogen as it is stated to have the capacity to normalize body functions and strengthen systems compromised by various stress and is one of the most widely and commonly used in traditional oriental medicine for the prevention and treatment of a variety of diseases, which has been as a panacea for 2,000 years in China (Zhou et al., 2017). Based on different medicinal parts, there are taproot (TR), lateral root (LR), and rhizome (RZ). Ginseng is characterized by a higher content of nutritious primary metabolites such as amino acids, carbohydrates and minor elements (Nguyen et al., 2016). In addition, ginseng has attracted significant interest because of its secondary metabolites, dammarane saponins (generally known as ginsenosides), the majority of these compounds are protopanaxadiols and protopanaxatriols, which are aglycones of dammarane-type triterpenes (Lee et al., 2015). Ginsenosides have been reported to have a wide range of therapeutic functions in the central nervous system and immune system (Shin et al., 2016), such as memory enhancement, anti-aging, anti-diabetes, anti-inflammation, anti-oxidation, and anti-tumor (Kim et al., 2018). In recent years, studies have indicated that ginsenosides play a pronounced positive role in neuroprotective.
Currently, the identification of herbal medicines relies mainly on the presence of certain secondary metabolites, especially some biomarkers, due to the transfer properties of metabolites from the original plant to its products. Therefore, there is an urgent need to discover reliable biomarkers to distinguish authentic herbs or herbs from different regions. Increasingly, non-targeted metabolomics approaches have been used to discover metabolites for the analysis of herbs, and plant metabolomics approaches for primary and secondary metabolites of medicinal plants have been used to identify and quantify biomarkers of plants (Patel et al., 2020). The primary metabolites of plants, such as fatty acids, amino acids and carbohydrates, are essential for life, while the production of secondary metabolites is closely related to plant development, and the types and contents of secondary metabolites may vary in different parts of the plant (He et al., 2018). Studies have shown that the relative contents of ginsenosides Re, ginsenosides Rb1, ginsenosides 20(R)-Rh1, ginsenosides Rd, and ginsenosides Rf are highest in the fibrous roots of ginseng, and the relative content of ginsenosides Rg1 is highest in RZ (Liu et al., 2017). In the 2020 edition of Chinese Pharmacopoeia, it is mentioned that “Ginseng can be powdered and swallowed, 2 g once, 2 times a day”. In recent years, various preparations prepared from ginseng have been marketed as dietary supplements (Wang et al., 2008). Its main edible or medicinal part has always been TR or LR. Most of the ginseng powder sold in the market is made from the main root, and the price of ginseng varies from part to part. At the same time, the huge demand for ginseng in the market has led to the phenomenon of substandard ginseng in the market. Therefore, distinguishing the powder of different parts of ginseng and identifying the authenticity of the herbs is an urgent problem to be solved.
In the last decades, high-throughput methods have been used to analyze metabolites of various molecular classes, such as nucleic acids, proteins and lipids (H. Xie et al., 2022). These methods provide a basic understanding of biological systems and have become a powerful tool. Only combined methods that have not yet fully established the corresponding data can yield a complete and full understanding of biological processes. Analyses that take into account two or more unique methods are called multiple unique methods and are being developed (Kopczynski et al., 2017) (Palazzotto and Weber, 2018). In this paper, 1H NMR and LC-MS based metabolomics techniques, combined with statistical methods, were used to effectively investigate ginseng metabolites. The 1H NMR-based metabolomics approach has the advantages of being highly reproducible, non-destructive and widely applicable (Rinschen et al., 2019). Meanwhile, LC-MS technology with high resolution, sensitivity, high quality accuracy and rich fragmentation information has become a powerful analytical tool for complex samples (Yuan et al., 2016). Multivariate statistical analysis, partial least squares discriminant analysis (PLS-DA) is used to differentiate sample categories by reducing the dimensionality of variables to extract important information from the whole spectrum, improve the reliability of analysis, and facilitate the interpretation of results. In addition, considering the “multi-component, multi-target” nature of traditional Chinese medicine, a network pharmacology approach was used for the comprehensive screening of effective identification markers of ginseng. Network pharmacology, characterized by integration and systematization with emphasis on drug interactions (Yuan et al., 2017), can predict the biomolecular mechanisms of drug therapy from a holistic perspective by constructing interaction networks of potential active ingredients and disease targets. Meanwhile, molecular docking can effectively calculate the binding mode and binding energy of protein–ligand complexes, which has become one of the main methods to predict the potential mechanism of action between drugs and diseases.
One of the pathological manifestations of nerve injury is progressive dysfunction caused by neurological defects, and glutamate (Glu)-induced excitotoxicity is one of the main causes of nerve injury (Hague, 2005). In the present study, we induced SH-SY5Y cell injury by Glu as a model of nerve injury. To examine the protective effect of ginseng polycomponent on SH-SY5Y cells. High-throughput metabolic analysis and network pharmacology were used to search for primary differential metabolites (PDMs) and secondary differential metabolites (SDMs) with neuroprotective properties in ginseng TR, LR and RZ. A comprehensive and representative analysis of the metabolites involved was performed using statistical methods. Therefore, a multi-omics approach to different samples and in terms of data analysis is a prerequisite to obtaining an integrated view. Moreover, it provides a scientific basis for assessing the quality of commercial products derived from different medicinal parts of ginseng and will facilitate the development of metabolomics techniques in food authentication and characterization.
2 Materials and methods
2.1 Materials and chemicals
This experiment was performed using 6-year-old artificially cultivated Panax ginseng C.A.Mey. A total number of 8 batches of ginseng materials in flat appearance were collected in October 2020 from Wanliang County, Jilin Province of China. The botanical identification was made by professor Dacheng Jiang (Jilin Ginseng Academy, Changchun University of Chinese Medicine, China), and a voucher specimen (No. 20200901- No. 20200908) was deposited at the laboratory of Jilin Ginseng Academy, Changchun University of Chinese Medicine, P.R. China.
HPLC grade acetonitrile was obtained from TEDIA. Purified water was made by a water purifier (Global Water Solution Ltd., Randolph, MA02368, USA). Other reagents and chemicals were of analytical grade, including methanol, ethanol, n-butanol, trichloromethane, Na2HPO4·12H2O and NaH2PO4·2H2O, were purchased from Beijing Chemical Works. Phosphate buffer (PBS, 0.1 M, pH 7.6), containing 0.05% 3-(trimethylsilyl)-propionic-2,2,3,3-d4 acid sodium salt (TSP) as an internal standard, was acquired from Cambridge Isotope Laboratories Inc. Deuterium Oxide (D2O 99.9% atom% D) was purchased Qingdao Tenglong Weibo technology co., Ltd. Donepezil hydrochloride was purchased from Yuanye Bio-Technology. Sucrose, ginsenoside Rb1 and ginsenoside Rb3 were purchased from Yuanye Bio-Technology (HPLC ≥ 98%). DMEM, Trypsin, FBS were purchased from Gibco. SH-SY5Y cells were obtained from the Shanghai Institute of Biochemistry and Cell Biology.
2.2 Sample preparation
The dried and cleaned ginseng was divided into three parts: taproot (TR), lateral root (LR), and rhizome (RZ), and each part was crushed and sieved through 20 mesh sieve, and the coarse powder was dispensed for use.
The dried and crushed TR, LR and RZ, were each weighed 2 g in a 50 mL centrifuge tube, 8 parts of each part, 24 parts in total. Each part was added with 40 mL of water-saturated n-butanol and filtered in a 50 mL centrifuge tube for 30 min on an ultrasonic cleaner, then evaporated on a water bath at 70℃ and stored in a desiccator.
2.3 Cell culture and MTT assays
SH-SY5Y cells were cultured in DMEM containing 10% FBS. The cells were cultured at 37 °C with 5% CO2 and passaged once every 2 days.
SH-SY5Y cells (1 × 10⁴ cells/well) were cultured in 96-well plates for 24 h. Cultured cells were treated by GLU for 4 h to establish oxidative damage conditions. Ginseng extracts (TR, LR and RZ) were dissolved in DMEM containing 1‰ DMSO, SH-SY5Y cells was intervened at final concentrations of 100, 50, 25 µg/ml. Twenty-four hours later, MTT (5 mg/mL, 20 µL) was added to the culture medium. After incubation at 37 °C for 4 h, the cell supernatants were aspirated and 150 µL DMSO was added to each well, followed by shaking for 10 min. The absorbance in the experimental wells was measured at 490 nm using a microplate reader. The experiments were performed in triplicate and the cells viability was expressed as percentages of survival relative to the control sample. Donepezil hydrochloride (100 µM) was used as a positive control.
2.4 NMR metabolomics method
2.4.1 Sample preparation for 1H NMR analysis
Samples of the TR,LR and RZ were separated from the Ginseng, all samples were pulverized into powder of over 65 mesh, there are five replicates of every part, then each sample of ginseng powder were accurately weighed (1 g), a two-phase extraction method composed of CHCl3–MeOH–H2O (7.5 mL of water, 7.5 mL of methanol and 15 mL of trichloromethane) in the ratio of 2:1:1 (v/v/v) was used to extract from TR, LR, RZ of ginseng in a 50 mL centrifuge tube, with the mixture sonicated for 30 min, and then centrifugation at 3,000 g for 25 min at room temperature. Metabolites in organic and aqueous phases were harvested as two samples after the extraction, and the superstratum was completely dried under N2 purge, each part collected under the same condition was subjected to 1H NMR analysis.
2.4.2 1H NMR measurements
Dried extract (20 mg) was weighed into 2 mL centrifuge tube and added 600 μL phosphate buffer solution (PBS, 0.1 M, pH 8.0) containing 0.05% TSP. after centrifuging at 11180 × g,10 min, the supernatant (450 μL) and 50 μL D2O was transferred into a 5 mm NMR tube for NMR analysis.
1H NMR was recorded at 25 ℃on a Bruker 500-MHz AVANCE III NMR spectrometer (Bruker, Karlsruhe, Germany) operating at a proton NMR frequency of 500 MHz. 1H NMR spectra uses standard NOESYPRGP1D pulse sequence. Waiting time (3 s) and mixing time(300 ms)used lower powered continuous wave pulse for water peak suppression. TSP is used for internal blocking. Each 1H NMR spectrum consists of 64 scans, which require 5 min of acquisition time, and has the following parameters: 0.18 Hz / point, pulse width (PW) = 5498.53 Hz, at 90° (12.08 μs) and time of 1.86 s sampling and relaxation delay) = 5.0 s.
2.4.3 1H NMR data processing and statistical analysis
The 1H NMR spectra were processed using Mest Re Nova (version 5.2.5, Mestrelab Research, Santiago de Compostella. Spain). Divide (cuvette) the spectral region between δ = 0.00 and 7.00 ppm in 175 regions of 0.04 ppm and integrate the signal strength of each region. Before exporting to the analysis software, the spectra were normalized in Microsoft Excel to the integral of the entire processed spectrum. Due to the residual HDO signal, the area of δ 4.80 ∼ 5.06 was excluded from the analysis range. Center and scale all spectral data to the unit variance, then use the SIMCA-P 17.0 multivariate data analysis software(Umetrics, Umeå, Sweden) to analyze based on the correlation matrix with PLS-DA.
The 1H NMR spectrum was analyzed using a multivariate statistical program.Input variables were generated through Mest Re Nova processing. Partial least squares discriminant analysis (PLS-DA) was applied to maximize the separation between samples. PLS-DA is an extension of PCA regression, which provides maximum covariance between the measured data (X variables, bins related to the NMR signal in the spectrum) and the response variables (Y variables, class members). Confidence in the probability of membership is considered 95% (observations below 5% are considered outliers).The quality of the models was described by R2, Q2 values. The R2 value is a cross validation parameter defined as the proportion of variance in the data interpreted by the models. and represents goodness of the fit. Parameter Q2 is defined as the proportion of variance in the predictable model data and represents predictability. This parameter is extracted according to the default internal cross validation method by the SIMCA-P software. For each PLS-DA model constructed, a load score, a combination of variable influence on projection parameters (VIP) and p (corr) were examined to determine which metabolites contributed most to the data pool. The load score describes the correlation between the original and new component variables. The VIP parameter is essentially a measure of the degree to which the variance Y (class member) is explained for a particular variable, while p (corr) represents the load scaled by the correlation coefficient (range 1.0 to 1.0) between the Model and original data. Compounds with variable impact projection (VIP) value > 1.0 and p < 0.05 were identified as PDMs from the PLS-DA model.
2.5 LC-MS metabolomics method
2.5.1 Sample preparation for LC-MS analysis
The water-saturated butanol extract was analyzed using RRLC-ESI-MS2 with the same sample preparation as in “2.2 Sample preparation”. All sample were dissolved in methanol with a final concentration of 1 mg/mL filtrated by a 0.45 µm filter prior to RRLC-ESI-MS analysis. All samples and mixed standard solutions were injected at 40 µL.
2.5.2 LC-MS conditions
RRLC conditions were analyzed by an Agilent 1200 infinity series liquid chromatography system (RRLC; Agilent Technologies, USA), which was equipped with a G1315D diode array detector (manufactured by Gemany) at 210 nm. LC separation of all inhibitors was performed on an Agilent SB-C18 column (4.6 mm × 100 mm, 1.8 µm, P.N. 828975–902, S.N. USWFM02237, Agilent Technologies, Inc.). The column temperature was controlled at 30℃. The flow rate of acetonitrile (A) and water (B) in the mobile phase is 0.3 mL/min. The LC method was as follows: The mobile phase was composed of water (A) and acetonitrile (B), using the following gradient procedures: 0–5 min, 5–20% (B); 5–15 min, 20–40% (B); 15–20 min, 40–60% (B); 20–25 min, 60–90%; 25–30 min, 90% (B). All samples were injected at 40 µL.
ESI–MS2 analysis: MS spectra were measured on a 6320 lon trap LC-MS (Agilent Technologies Co. Ltd.,U.S.), equipped with an electrospray ionization source was used both in positive and negative ion mode. Select the MS2 mode of the mass spectrometer to analyze the sample. The operating parameters of the MS spectrum are as follows: dry gas temperature 350℃; dry air flow, 11.0 L / min; the atomization gas pressure is 40 psi; 4000 V capillary voltage. Mass spectrometry was performed in scanning modes from m/z 50 ∼ m/z 2000. The data was recorded using the HPLC - MSD ChemStation software system applied.
2.5.3 RRLC data processing and multivariate statistical analysis
The data analysis software (Agilent RRLC 1260) was used to convert raw RRLC data to the CSV format and then processed by Microsoft Excel. Each compound is shown as a normalized peak area in relation to the internal standard. For further analysis, SIMCA-P version 17.0 software (Umetrics, Umeå, Sweden) was used to perform standardized data for multivariate statistical analysis. PLS-DA was used to compare the differences between TR, LR, RZ and ginseng tissue specificity to identify key important compounds. A typical cross validation is used to estimate the number of important compounds. The validity of the PLS-DA model for overfitting was calculated by a permutation test, and 200 permutations were used in all models. Compounds with VIP value > 1.0 and p < 0.05 were identified as SDMs from the PLS-DA model.
2.6 Network pharmacology analysis
2.6.1 Construction of the Compound-Target and Disease-Target networks
PDMs and SDMs with differential properties were used to obtain differential metabolites(DMs) targets by Pubchem and Swiss Target Prediction. The disease targets related to AD were obtained by Gene card database. By mapping the DMs targets to disease targets, the intersection targets are effect targets related to AD in the DMs of ginseng.
2.6.2 Protein-Protein interaction and pathway enrichment analysis
A network analyzer was used to calculate the topological analysisof the nodes of the component–target network. Effector targets were placed into the STRING (https://string-db.org/)to obtain interacting proteins, and nodes with degrees degree > double the average (4*2) were identified as core targets(von Mering, 2004) (Szklarczyk et al., 2021). The PPI network, ginseng DM-core target network was visualized and analyzed using Cytoscape.
Metascape database(J. Xie et al., 2022) (updated on 2022–04-15) can be used for functional enrichment analysis, and it has the advantages of fast update and simple operation compared with DAVID database(Tian et al., 2021), so Metascape was chosen for enrichment analysis. The core targets were entered into the Metascape database, the species was selected as H. sapiens, the p cutoff was set to 0.01, and the rest were kept as default settings.GO contains biological process (BP), molecular function (MF), and cellular composition (CC)(Burley et al., 2019), and GO analysis and KEGG-related pathway analysis were performed using the Metascape database (p < 0.05).
2.7 Correlation analysis
In order to compare the contents of biomarkers in ginseng powder from multi-parts, and to investigate the correlation between the contents of each biomarker, pearson correlation analysis of biomarkers in TR, LR, ZR was performed with SPSS 22.0 and visualized by heatmap. p < 0.05 indicated that the difference in data was statistically significant.
2.8 Docking and verification of biomarkers with core target molecules
Small molecule ligands and protein receptors are processed before docking, and ligands and non-protein molecules (e.g. water molecules) are removed from the protein using PyMol 2.3 software and saved in pdb format. Convert the molecules from mol2 format to pdb format and save them. Open all molecule files in AutoDock Tools software, hydrogenate and charge the molecules separately, and save them as pdbqt files. Open all proteins, hydrogenate, charge, add protein type, etc., and save them in pdbqt format as well.
Import the processed small molecule ligands and protein receptors structures, the Grid Box coordinates and box size were set, and the calculations were run using the “local search” algorithm with default parameters. The docking results are evaluated by the binding energy value. A binding energy value<0 indicates that the ligand and the receptor can bind spontaneously. The conformation with the lowest binding energy was selected and displayed on a graph using PyMol 2.3.
2.9 Biomarkers activity verification
Cell culture and MTT assays were performed as in 2.3. to investigate the effect of biomarkers on SH-SY5Y survival. Biomarkers were dissolved in DMEM containing 1‰ DMSO and intervened in SH-SY5Y cells at final concentrations of 0.1, 1, 10, 100, 1000 µM.
2.10 Statistical analysis
All experimental data were analyzed using SPSS 22.0 statistical software. computing software for analysis, and the data of measurement data were expressed as x-±s. Two samples were compared using the t-test; p < 0.05 indicated that the differences were statistically The differences were statistically significant.
3 Results
3.1 The protective effect of multi-parts of ginseng powder on SH-SY5Y cells
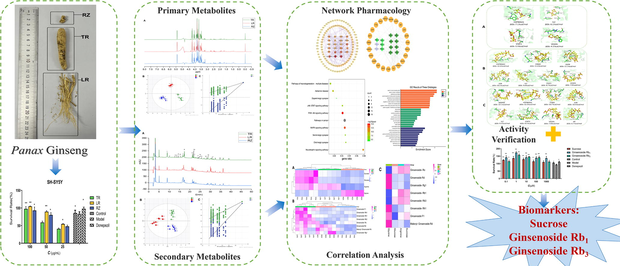
Different parts of ginseng powder have a certain protective effect on Glu-induced damage to SH-SY5Y cells. As shown in Fig. 1, when the concentration of the ginseng n-butanol extract group was 25, 50, and 100 μg/mL, the survival rate of SH-SY5Y cells had a significant concentration dependence, and the cell viability increased significantly with the increase in dose. And the damage situation of Glu on SH-SY5Y cells had some improvement in the effect of TR, LR, and RZ.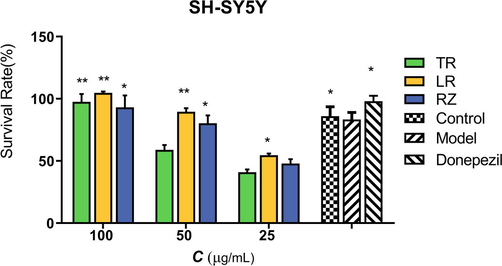
Effects of ginseng extract in SH-SY5Y induced by Glu. The data were presented as means ± SEM (n = 3).*: p < 0.05 compared with model group, **: p < 0.01 compared with model group.
3.2 Metabolites identification by 1H NMR spectra and multivariate data analysis
3.2.1 Metabolite identification by 1H NMR spectroscopy
Typical 1H NMR spectra (Fig. 2A) are shown the representative compositions of the upper layer of CHCl3–MeOH–H2O mixture (1:1:2) extracting from ginseng. The resonances were assigned to specific metabolites based on the reported literature data, supplement ary information. The metabolites detected were elucidated by 1H NMR spectral analysis and comparison with reference compounds, and an internal NMR chemical shift database. We summarizes the chemical shifts (1H) and coupling constants of all the identified metabolites present in ginseng, 1H NMR spectra of methanol–water extracts were mainly characterized by amino acids, organic acids, sugars, organic alkali, lipid, and their derivatives etc. Amino acids include Leucine (δ 0.95, d, 7.0 Hz), Valine (δ 0.98, d, 7.0 Hz), Threonine (δ 1.34, d, 6.5 Hz), Alanine (δ 1.49, d, 7.2 Hz), Lysine(δ 1.69, m), Arginine (δ 1.61–1.76, m; 1.87–1.96, m; δ3.26, t, J = 6.), Proline (δ 1.99–2.09, m), Glutamate (δ 2.10–2.17, m; δ 2.34–2.37, m), Glutamine (δ 2.45, m), Aspartate (δ2.82, dd, 17.1 Hz, 3.7 Hz), Serine (δ3.84, dd, 3.6 Hz, 5.4 Hz), and Glycine (δ3.68, s) were evident in the spectra area between δ0.98 and δ3.18. Organic acids include Lactate(δ1.33, d, 8.40 Hz), 4.11 (q, J = 8.32 Hz), 3-OH-butyrate (δ1.15, d;6.0 Hz), Acetate (δ1.90, s), α-Ketoglutarate(δ2.44, t, 3.01, t), Succinic acid(δ2.45, s), GABA (δ3.00, t, 7.2 Hz; 2.30, t, 7.2 Hz), Citric acid (δ2.55, d, 16.2 Hz; δ2.68, d, 16.2 Hz), Taurine (δ3.24, t; δ3.44, t), malate(δ4.31, dd; δ2.62, dd; δ2.36, dd), Pyruvate (δ2.38, s), 2-Oxoglutarate (δ3.02, t, 7.4 Hz), were evident in the spectra area between δ1.9 and δ3.2. Sugars include Glucose (δ3.45–3.48, m; δ3.56, dd, 9.9 Hz, 3.8 Hz; δ3.72–3.91, m; 5.22 d, 3.8 Hz) and Sucrose (δ3.47, t, 9.6 Hz; 3.56, dd, 10.0 Hz, 3.9 Hz; δ3.66, s; δ3.76, t, 9.5 Hz; δ3.79–3.91, m; δ4.05, t, 8.6 Hz; δ4.22, d, 8.8 Hz; δ5.42, d, 3.9 Hz) were evident in the spectra area between δ3.45 and δ5.42. Organic alkali includes Choline (δ3.18, s), etc.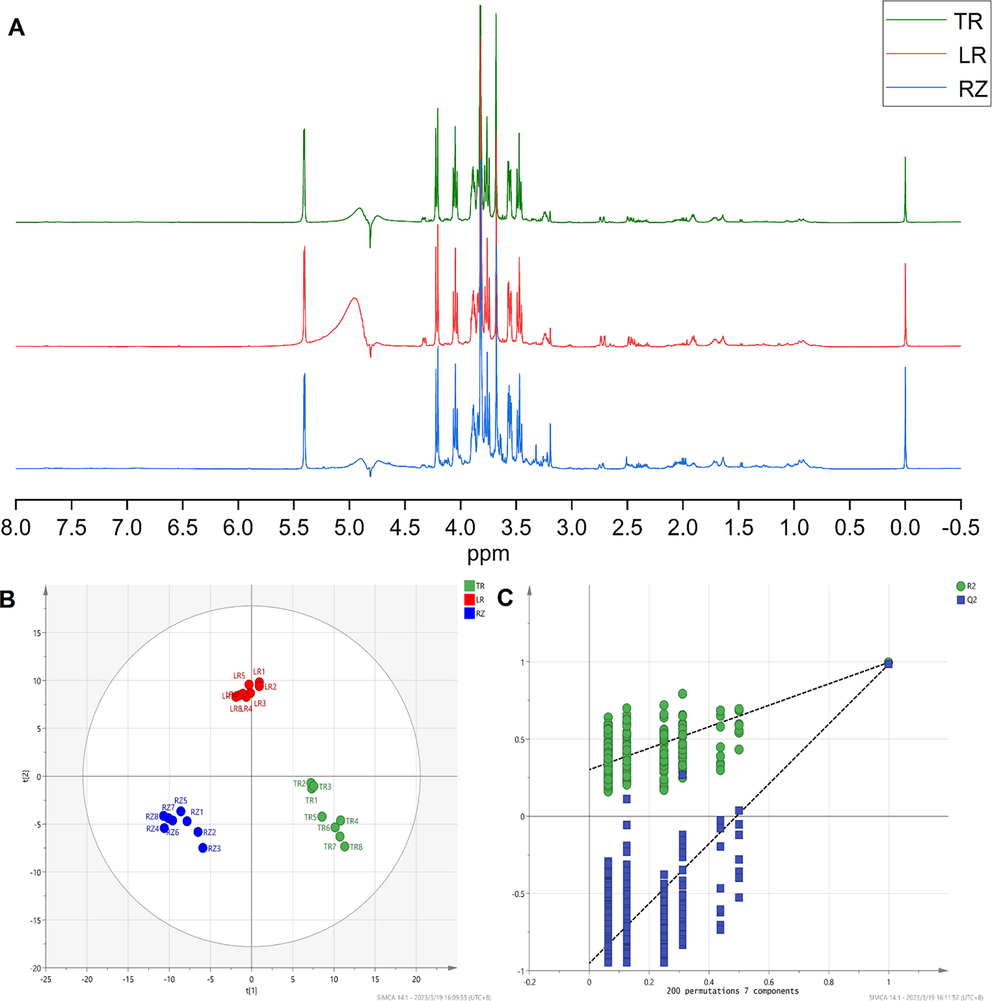
1H NMR metabolome results. (A) Representative 500 MHz 1H NMR Spectra (NMR solvent: NaH2PO4 buffer in D2O) of the aqueous methanol extracts from TR, LR, RZ of ginseng. (B) 1H NMR PLS-DA scores plots. (C)Validate Model.
3.2.2 Multivariate data analysis
Metabolic profiles of methanol–water extracts were studied by 1H NMR spectroscopy and multivariate analysis determining the chemical differences among the TR, LR and RZ of ginseng. Potential differences between species were investigated using PLS-DA. We employed PLS-DA (Fig. 2B) to find the metabolites contributing to the separation between the TR, LR and RZ. Parameters R2 (0.126) and Q2 (-0.41) indicate that the model has good adaptability. In addition, a permutation test (number of permutations: 200) was performed to assess the validity of the model. All values of Q2 and R2 in the displacement test were lower than those of the real model, showing good predictability and goodness (Fig. 2C). Screening for biomarkers in ginseng using PLS-DA with p < 0.05 and VIP > 1, indicated that the metabolites responsible for the separation of the TR, LR and RZ of ginseng, including Glucose, Glycine, Sucrose, Serine, Taurine and Arginine (see Table 1).
No.
δ(ppm)
VIP
Compound
The average peak area
TR
LR
RZ
PM-1
3.26866
1.42349
Arginine
200.06
198.88
143.95
PM −2
3.82866
4.09789
Glucose
2754.01
1996.70
1976.32
PM −3
3.66866
2.81548
Glycine
177.89
149.24
360.49
PM −4
3.86866
2.33767
Serine
1032.41
824.55
731.20
PM −5
5.42866
2.49282
Sucrose
920.76
679.35
577.16
PM −6
3.22866
1.47024
Taurine
123.24
149.71
209.72
Peak No.
TR
(min)Formula
MW (Da)
MS/MS data (m/z)
Identification
1
9.0259
C41H70O13
770.4816
769.4743; 637.4314; 475.3788; 391.2837
Ginsenoside-Noto R2
2
10.044
C48H76O19
956.4981
955.4956; 793.4394; 631.3852; 455.3498; 119.0336
Ginsenoside-Ro
3
12.650
C48H82O19
962.545
961.4944; 799.4606; 637.4000; 475.3596; 221.0571;
161.0316Ginsenoside-Re1
4
13.480
C47H80O18
932.5345
977.4962;931.4971; 799.4616; 637.4045;475.3588; 293.0690;179.0504;161.0385; 149.0363;131.0291; 101.0242
Ginsenoside-Noto R1
5
14.430
C48H82O18
946.5501
945.5037; 783.4615; 621.4111;
459.3644; 161.0368; 101.0248Ginsenoside Rd
6
15.258
C48H82O18
946.5501
945.5071; 783.4588; 637.4034; 475.3611
Ginsenoside-Re
7
16.419
C42H72O14
800.4922
799.4807; 637.4302; 475.3775; 391.2836; 161.0445; 101.0245
Ginsenoside-Rg1
8
17.652
C54H92O23
1108.603
1107.5560; 945.5067; 783.4598; 621.4125; 459.3653;323.0832; 179.0474
Ginsenoside-Rb1
9
20.941
C53H90O22
1078.592
1077.5451; 945.5046; 783.4554; 621.4121; 459.3628
Ginsenoside-Rc
10
21.384
C53H90O22
1078.592
1077.5934; 945.5433; 783.4892; 621.4343; 293.0857; 191.0535; 149.0437; 101.0231
Ginsenoside-Rb2
11
21.707
C53H90O22
1078.592
1077.5309; 945.5088; 783.4629;
621.4125; 293.0716; 149.0382Ginsenoside-Rb3
12
23.6
C36H62O9
638.4394
637.4309; 475.3775; 391.2843; 161.0444
Ginsenoside-Rh1
13
23.81
C36H62O9
638.4394
637.4258; 475.3746; 161.0438
Ginsenoside F1
14
24.766
C42H70O12
766.4867
811.4885; 765.4794; 619.4207; 457.3665
Ginsenoside-Rg6
15
28.3725
C47H80O18
932.5345
977.4962; 931.4952; 799.4434;
637.4103; 475.3505; 293.0906; 272.4082;161.0370;101.0193Ginsenoside-Re4
16
28.71
C45H74O17
886.4926
909.4789; 707.4349; 689.4232
Ginsenoside Malonyl- Rg1
17
30.974
C51H84O21
1032.551
1031.5412; 987.5557; 621.4426; 179.0528
Ginsenoside Malonyl- Rd
18
34.658
C41H70O13
770.4816
769.4743; 637.4314; 475.3788; 391.2837
Ginsenoside noto R2
No.
δ(ppm)
VIP
Compound
The average peak area
TR
LR
RZ
SM-1
10.0434
1.10723
Ginsenoside-Ro
34.29
52.77
21.89
SM-2
14.43
1.62064
Ginsenoside Rd
6.37
24.08
25.33
SM-3
16.4177
1.36503
Ginsenoside-Rg1
162.34
228.85
302.52
SM-4
17.652
1.028
Ginsenoside-Rb1
16.27
65.96
13.22
SM-5
21.7072
1.25468
Ginsenoside-Rb3
72.79
135.00
60.03
SM-6
23.6084
1.22157
Ginsenoside-Rh1
3.66
10.28
5.34
SM-7
23.8103
1.09117
Ginsenoside F1
3.02
9.83
3.21
SM-8
30.6769
1.27106
Malonyl-Ginsenoside Rd
51.24
76.19
94.85
3.3 Metabolites identification by LC-MS and multivariate data analysis
3.3.1 Metabolite identification by LC-MS
According to the LC-MS analysis conditions, the ginseng was tested for solution. The base peak intensity (BPI) chromatogram profiles of TR, LR and RZ are shown in Fig. 3A. The retention time of the compound, the exact mass-to-charge ratio, and the fragment ion and the reference substance were used to identify the main metabolites. A total of 18 metabolites were identified or inferred, as shown in Table 2. As shown in Fig. 3A, a visual analysis of the chromatograms of different parts of the ginseng revealed that there were some differences between different parts. The saponins in TR were more than LR and RZ. In addition, there are many identical saponin components in different parts of ginseng, but according to the relative peak area, they can be judged to have significant differences in content. For example, the content of Ginsenoside-Rb1 in LR was significantly higher than that in TR and RZ.
3.3.2 Multivariate data analysis
Metabolic profiles of methanol–water extracts were studied by LC-MS spectroscopy and multivariate analysis determining the chemical differences among the TR, LR and RZ of ginseng. Potential differences between species were investigated using PLS-DA. We employed PLS-DA (Fig. 3B) to find the metabolites contributing to the separation between the TR, LR and RZ. Parameters R2 (0.382) and Q2 (-0.291) indicate that the model has good adaptability. In addition, a permutation test (number of permutations: 200) was performed to assess the validity of the model. All values of Q2 and R2 in the displacement test were lower than those of the real model, showing good predictability and goodness (Fig. 3C). Screening for biomarkers in ginseng using PLS-DA with p < 0.05 and VIP > 1,indicated that the metabolites responsible for the separation of the TR, LR, RZ of ginseng, including Ginsenoside-Ro, Ginsenoside Rd, Ginsenoside-Rg1, Ginsenoside-Rb1, Ginsenoside-Rb3, Ginsenoside-Rh1, Ginsenoside F1, Malonyl-Ginsenoside Rd (see Table 3).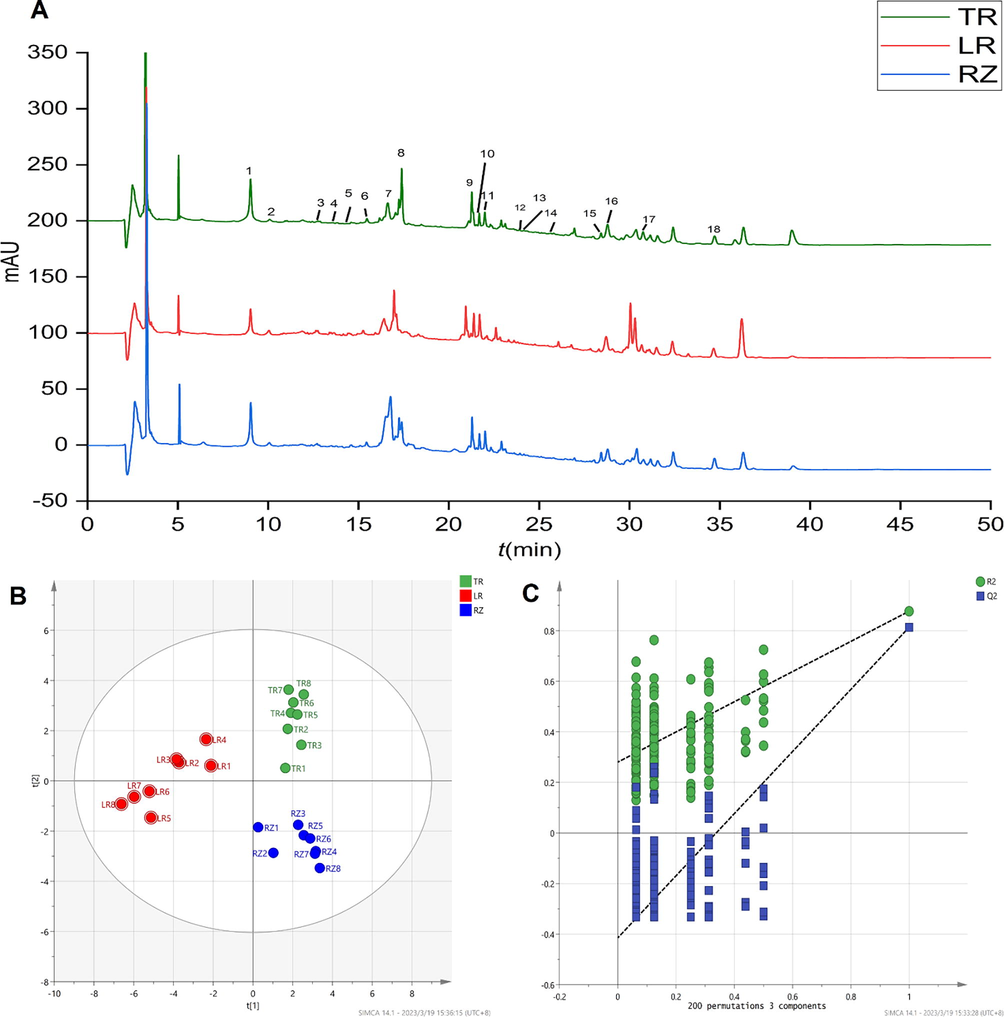
LC-MS metabolome results. (A) RRLC-chromatogram of water saturation butanol extract from TR, RZ and LR of ginseng. (B) LC-MS PLS-DA scores plots. (C)Validate Model.
3.4 Network pharmacology analysis results
3.4.1 Target prediction results
The target information of PDMs and SDMs was collected by TCMSP, a systematic pharmacological analysis platform for traditional Chinese medicine, and 431 metabolite-related targets were obtained by removing duplicate items. The target information was collected and screened by GeneCards database with the keyword “ Alzheimer's disease ”. The disease targets with Score > 1 were selected and duplicate items were removed to obtain 3493 targets related to memory enhancement. After mapping, 170 metabolite-disease effect targets were obtained.
3.4.2 Results of protein–protein interactions and enrichment analysis
The 170 effector targets were entered into STRING database, and the minimum required interaction score was set to 0.9, and the nodes disconnected from the network were hidden to obtain the protein–protein interaction network(Fig. 4A). The results of the above analysis were imported in TSV format into Cytoscape 3.7.2 software, the 23 core targets were screened by (degree > mean*2), and the metabolite-core target network was constructed by Cytoscape (Fig. 4B). It is worth mentioning that the results of network pharmacology showed that PM-4 and PM-6 were not associated with the core targets, therefore were grayed out in the network diagram and were not involved in the later analysis.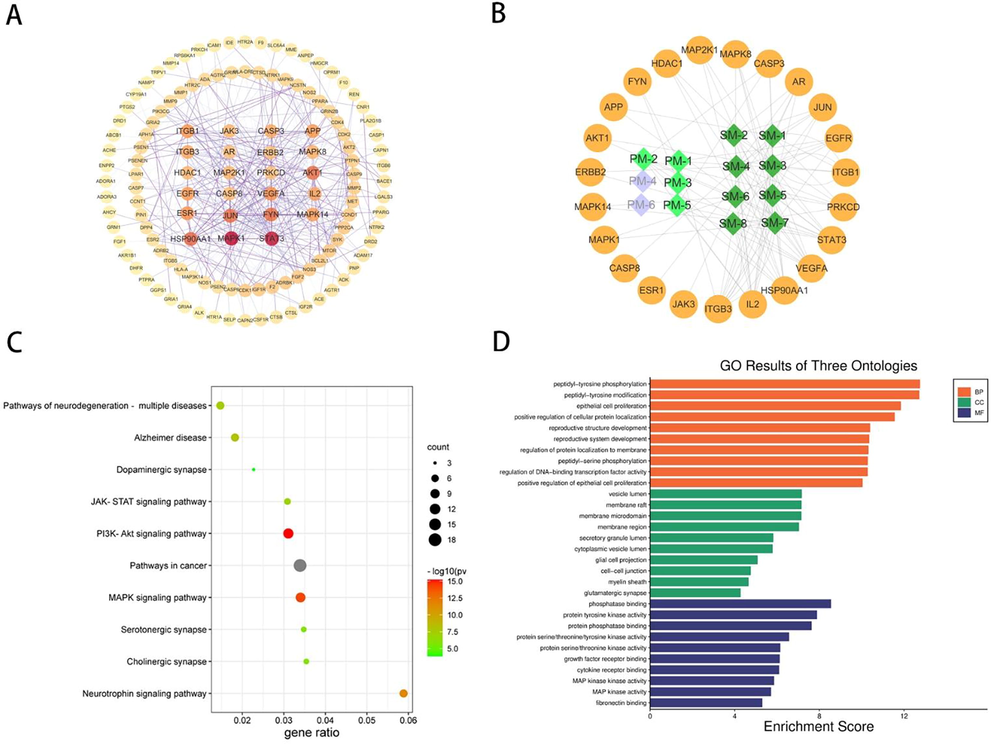
Network pharmacology analysis results. (A)Protein-protein interaction network (Circles represent target.). (B). DMs-Target network (Circles represent target the diamond represents metabolites.). (C). KEGG pathway enrichment results. (D). GO analysis results.
KEGG pathway enrichment and GO analysis were performed for 22 core targets using the DAVID database. 117 signaling pathways were shown in the KEGG pathway enrichment (Fig. 4C), with the top 10 pathways ranked according to p-value shown in Fig. 4C. 184 enriched processes were shown in the GO analysis, including 126 biological processes, 39 molecular functions, and 19 cellular components. cellular components. The top 30 ranked according to p-value are shown in Fig. 4D.
3.5 Correlation analysis between DMs content and various parts of ginseng
Based on the comparison of the relative contents of metabolites, the relative peak areas of PDMs and SMs were correlated with each of the three different parts of ginseng, and the degree of correlation was evaluated by the absolute value of Pearson's correlation coefficient(Fig. 5 A, Fig. 5 B). Heatmap (Fig. 5 C) directly reflected the significant differences in the relative contents of the biomarkers among the 5batches of ginseng powders from different parts, as well as the clustering between TR, LR and RZ.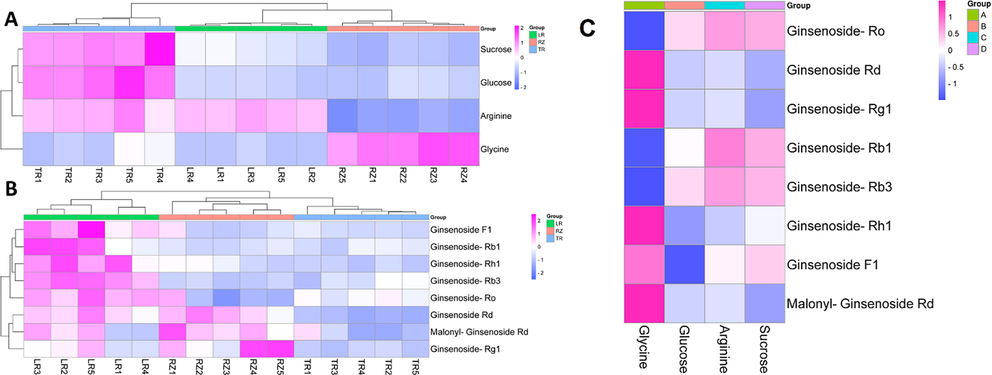
Heat map of correlation between the content of major DMs and multi-parts ginseng. (A) PDMs. (B).SDMs.(C). The correlation between the content of PDMs and SDMs.
Therefore, based on the connection with the anti-AD core targets and the content of each DMs distributed in each part of ginseng, three DMs with high participation in the anti-AD component-target network and a large relative range were finally identified as biomarkers to distinguish multiple parts of ginseng. They were sucrose, ginsenoside Rb1, and ginsenoside Rb3.
3.6 Molecular docking
The binding energy results of molecular docking between the chemomarker and the core target are shown in Fig. 6. Since PRKCD does not have a protein that can be molecularly docked, it is not shown in the binding energy results of Fig. 6. It is generally believed that when the binding energy is<0, it indicates that the component and the target can bind together. The lower the binding energy, the stronger the binding ability of the two, and the more stable the conformation formed. SDMs is not only involved in plant growth and development, but also acts as an active ingredient in ginseng's medicinal parts in neuroprotective pathways and biological functions. PDMs, on the other hand, provides essential nutrients for the biosynthesis of the medicinal parts of ginseng, but the main amino acids and sugars in PDMs are also essential for maintaining human health and regulating human metabolism. Since core targets are all highly correlated with nerve damage, the differences between the binding energy results of the 3 biomarkers from PDMs and SDMs docked with the core targets are generally consistent with the differences in the biological functions of PDMs and SDMs. The specific form of docking of the 3 biomarkers to the core targets is shown in Fig. 7.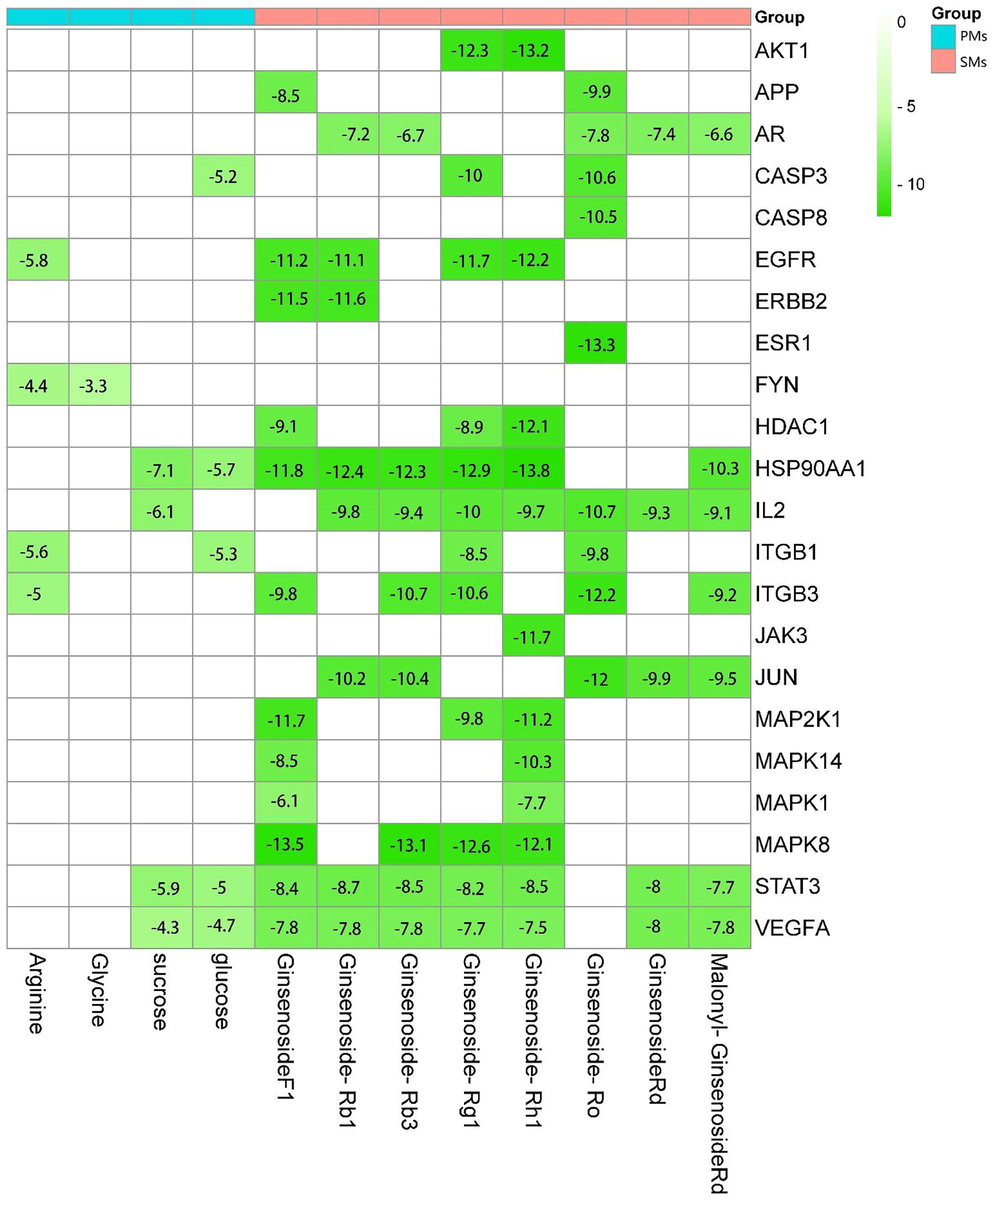
Molecular docking binding energy results.(White means that DMs and Targets were no relationship in DMs-Target network.).
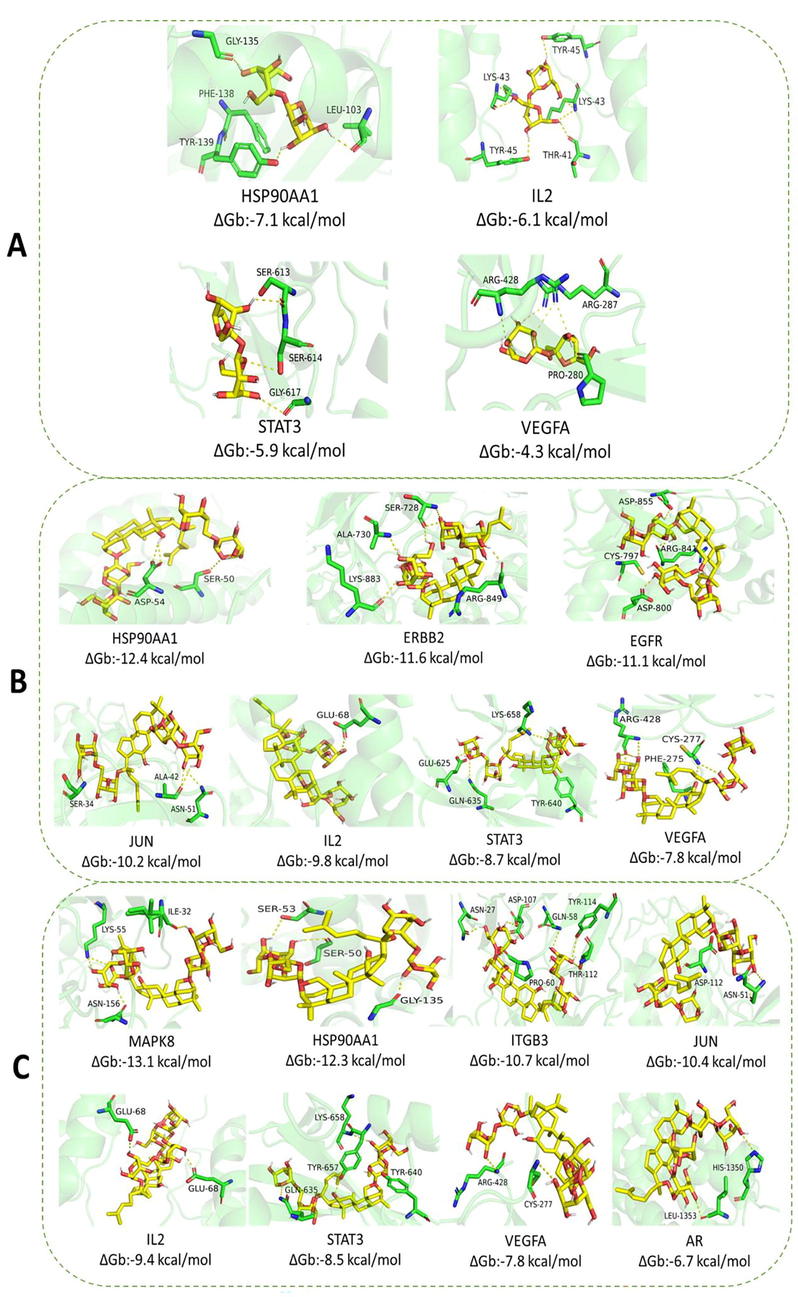
Molecular docking results. (A). Molecular docking of sucrose and effector targets. (B). Molecular docking of ginsenoside Rb1 and effector targets. (C). Molecular docking of ginsenoside Rb3 and effector targets.
3.7 Protective effects of biomarkers on SH-SY5Y cells
The protective effects of the three biomarkers on Glu-induced SH-SY5Y are shown in Fig. 8. The results showed that the viability of SH - SY5Y cells in the model group was significantly decreased compared with the blank group; the cell viability of Glu-induced SH-SY5Y was increased by the intervention of the three biomarkers compared with the model group (p < 0.05 or p < 0.01).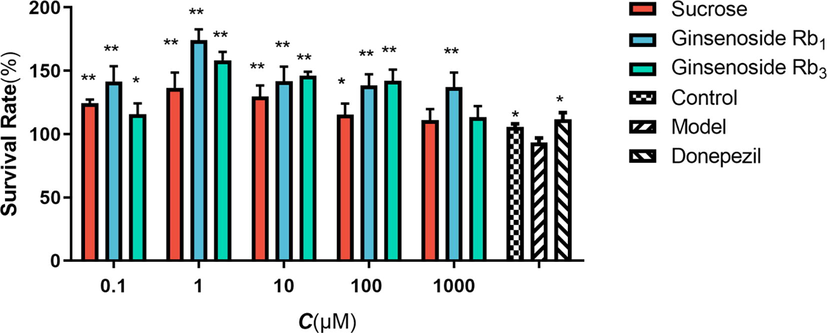
Effects of 3 biomarkers in SH-SY5Y induced by Glu. The data were presented as means ± SEM (n = 3);*: p < 0.05 compared with model group, **: p < 0.01 compared with model group.
By examining the protective effects of the three biomarkers on SH-SY5Y cells, the previous approach of screening ginseng for biomarkers with neuroprotective effects can be justified. The protective effect of ginsenoside Rb1 on SH-SY5Y cells was the most prominent, which was consistent with the present findings(Gong et al., 2022). Meanwhile, the latest study showed that sucrose and ginsenoside Rb3 also had a role in neuroprotection, although sucrose does not have a significant neuroprotective effect, it can contribute to neuroprotection as a nutritional element (Gong et al., 2022; Peng et al., 2009).
4 Discussion
AD is a neurodegenerative disease characterized clinically by memory impairment and cognitive dysfunction. Ginseng has been used in traditional Chinese medicines (TCMs) for thousands of years. Based on its extensive substance-based research, it is rich in amino acids, volatile oils, and ginsenosides, and the content of these components varies among different parts(Li et al., 2021). In recent years, numerous pharmacological studies have shown that ginseng has a variety of biological activities, including anti-inflammatory, antioxidant, immunomodulatory, and neuroprotective properties(Kim et al., 2018). Due to its diverse medicinal effects, ginseng has been used in various nutraceuticals and dietary supplements to relieve fatigue and improve memory. Since most of the ginseng is currently available in the market as a powder, it isn't easy to distinguish the medicinal parts of the powdered ginseng, which in turn affects the efficacy of the active ingredients in the drug. Therefore, this paper combined metabolomics and bioinformatics to screen the ginseng powder for biomarkers with anti-AD activity.
The metabolomic results of ginseng powder show that the PDMs involved in the biosynthetic pathway are amino acid components and the SDMs involved in the biosynthetic pathway are ginsenoside components. Amino acid components in ginseng are not only essential components in the biosynthetic pathway, but also participate in the synthesis and metabolism of various active substances in the body, and play important roles in immune function, learning and memory, neurotransmission, and receptor function of the body (Gueli and Taibi, 2013). Amino acids are important neurotransmitters in the brain, and the levels of some amino acids in specific areas of the brain are related to learning memory capacity (Tang et al., 2016), which is essential for learning memory and synapse formation. Supplementation of the body with a certain amount of amino acids can promote protein synthesis, regulate brain cells and neurological functions, and improve intelligence and memory (Hone-Blanchet et al., 2022). Ginsenosides are one of the products of the biosynthetic pathway of ginseng, and also one of the important components of the organism that exert neuroprotective effects. Ginseng extracts can reduce AD symptoms to some extent in animal models and patients, which suggests that ginseng extracts contain certain bioactive components that prevent cognitive dysfunction due to reduced Aβ burden and amyloid plaque accumulation (Saba et al., 2017). Further findings suggest that ginsenosides may generate information on ginseng extract-mediated anti-AD activity by inhibiting Aβ-induced neurotoxicity and reactive oxidative stress, stimulating soluble amyloid precursor protein a formation, exerting anti-inflammatory effects, as well as enhancing cholinergic system, hippocampal neurogenesis and cognitive functions (Kim et al., 2018).
The network pharmacology results showed that 14 DMs connected 170 CE-related targets, and 22 highly relevant core targets were obtained after PPI screening. Among them, the primary metabolites Serine and Taurine corresponding to AD-related targets were not included in the 22 core targets, presumably because Serine and Taurine are mainly involved in the biosynthesis of ginseng, providing one of the components of energy metabolism for ginseng. The KEGG pathway enrichment analysis results showed that ginseng's DMs act on AD. The results of GO analysis showed that the key targets of ginseng DMs in AD were mainly related to peptide-tyrosine phosphorylation, vesicle lumen and phosphatase binding. The key targets of ginseng DMs in AD were primarily associated with peptide-tyrosine phosphorylation, vesicle lumen, and phosphatase binding.
Based on the dual-omics analysis and network pharmacology results, it screened the remaining 12 DMs for correlation between the DMs content and each part of ginseng. The results showed significant differences between the ginseng parts and the contents of different DMs.Heat map of the correlation between the content of PDMs and the different parts of ginseng showed that the content of PDMs was mostly positively correlated with TR, and the content of PDMs was mostly negatively correlated with LR and RZ. Sucrose, Glucose, and Arginine were higher in TR. Arginine was higher in LR, and Glycine was higher in RZ. Ginsenoside-Rb1 and Ginsenoside-Rb3 were higher in LR. The contents of DMs in different parts showed significant clustering differences so that they could distinguish different parts of ginseng according to their contents. It is hypothesized that the different contents of different DMs in different parts of ginseng are one of the reasons for the different efficacy of each part of ginseng (Li et al., 2021; Liu et al., 2017). The content correlation heat map between PDMs and SDMs can visually represent their content relationship. The relationship between Sucrose The content comparison between Sucrose and Ginsenoside-Rb1 was positively correlated, presumably related to Sucrose being a supplement in the Ginsenoside-Rb1 biosynthetic pathway (Wang et al., 2005). the content comparison between Glycine and Ginsenoside-Rb1 was negatively correlated, presumably related to Glycine affecting The comparison between Glycine and Ginsenoside-Rb1 was negatively correlated, presumably related to Glycine affecting the thermal stability of Ginsenoside-Rb1 for the Maillard reaction (Kang et al., 2007).
The molecular docking results showed that the DMs of ginseng had better binding forms to the corresponding core targets. They assume that ginsenosides, as SDMs of ginseng, can directly affect the AD-related targets and pathways and thus influence AD-related biological functions. In contrast, amino acids, as PDMs of ginseng, are mainly involved in ginseng biosynthetic pathways and human basal metabolism. Therefore, based on the content of ginseng DMs and the network pharmacology results of AD intervention targets, the biomarkers identified in different parts of ginseng with AD intervention ability were Sucrose, Ginsenoside-Rb1, and Ginsenoside-Rb3. Induced damage to SH-SY5Y cells was all therapeutically effective. The ranking of the therapeutic effects of the three biomarkers on SH-SY5Y cells was: Ginsenoside-Rb1 > Ginsenoside-Rb3 > Sucrose, which was consistent with the ranking of the molecular docking binding energy, indicating that the three biomarkers in ginseng have sound intervention effects on AD.
Sucrose metabolism plays a crucial role in development, stress response, and yield formation, primarily by producing a series of sugars as metabolites to promote the growth and synthesis of essential compounds (including proteins, cellulose, and starch), and as a regulator of microRNA expression, transcription, and signaling factors and other genes, as well as crosstalk with hormonal, oxidative, and defense signaling. In recent years, studies have shown that ginsenosides have certain preventive and therapeutic effects on nervous system diseases (Ruan, 2014). Ginsenosides can increase the levels of γ-aminobutyric acid, acetylcholine and dopamine in the hippocampus and cortex and decrease the levels of glutamate and aspartate (Zheng et al., 2018). Ginsenoside Rb1 significantly inhibits acetylcholinesterase, and BChE Lian et al. compared the anticonvulsant activity of whole root extract, whole leaf/stem extract and Rb extract (You et al., 2017). The results suggest that the Rb component of the panaxadiol group has a good effect on the nervous system. In addition, the researchers found that ginsenoside Rb3 significantly reduced immobility time in the forced swim test and tail suspension test. In addition, ginsenoside Rb3 reduced the number of escape failures during learned helplessness. Furthermore, ginsenoside Rb3 increased sucrose preference, autonomic activity, and novelty inhibition in mice and alleviated hypothermia, ptosis, and akinesia. In addition, ginsenoside Rb3 reversed the decline in hippocampal weight and hippocampal brain-derived neurotrophic factor (BDNF) levels (Jiang et al., 2012).
5 Conclusion
The number of studies on ginseng markers continues to increase, such as the study of quality markers of different species of ginseng (Huang et al., 2018) and the study of biomarkers of ginseng after different concoction methods (Zhao et al., 2020). However, no biomarkers have been reported to identify multi-part ginseng powder. The 1H NMR and LC-MS selected in this study are extremely sensitive and have broad coverage, and thus can be applied to analyze DMs of ginseng. The network pharmacology results indicated that most DMs. of ginseng has the potential anti-AD ability, and this prediction was confirmed by the molecular docking results and SH-SY5Y cells viability results. In conclusion, this approach based on a dual analytical platform of 1H NMR and LC-MS combined with network pharmacology techniques for screening biomarkers with anti-AD activity in different parts of ginseng in this study is feasible.
Funding
This work was financially supported by the Science and Technology Development Project of Jilin Province (No.20200404081YY), the National Natural Science Foundation of China (No.31570347), the Industrialization research project of Jilin Province Education Department (No.JJKH20210992KJ), the Health and Wellness Innovation Project of Jilin Province (No.2018J111), Jilin Provincial Department of Education (No.JJKH20200905KJ).
Declaration of Competing Interest
The authors declare that they have no known competing financial interests or personal relationships that could have appeared to influence the work reported in this paper.
References
- RCSB Protein Data Bank: biological macromolecular structures enabling research and education in fundamental biology, biomedicine, biotechnology and energy. Nucleic Acids Res.. 2019;47:D464-D474.
- [CrossRef] [Google Scholar]
- Neuroprotective Mechanisms of Ginsenoside Rb1 in Central Nervous System Diseases. Front. Pharmacol.. 2022;13:914352
- [CrossRef] [Google Scholar]
- Alzheimer’s disease: amino acid levels and brain metabolic status. Neurol. Sci.. 2013;34:1575-1579.
- [CrossRef] [Google Scholar]
- Neurodegenerative disorders: Parkinson’s disease and Huntington’s disease. J. Neurol. Neurosurg. Psychiatry. 2005;76:1058-1063.
- [CrossRef] [Google Scholar]
- Discovery and identification of quality markers of Chinese medicine based on pharmacokinetic analysis. Phytomedicine. 2018;44:182-186.
- [CrossRef] [Google Scholar]
- Relationships between frontal metabolites and Alzheimer’s disease biomarkers in cognitively normal older adults. Neurobiol. Aging. 2022;109:22-30.
- [CrossRef] [Google Scholar]
- Antidepressant-like effects of ginsenoside Rg1 are due to activation of the BDNF signalling pathway and neurogenesis in the hippocampus: Antidepressant effects of Ginsenoside Rg1. Br. J. Pharmacol.. 2012;166:1872-1887.
- [CrossRef] [Google Scholar]
- The Effects of Glycine and L-Arginine on Heat Stability of Ginsenoside Rb1. Biol. Pharm. Bull.. 2007;30:1975-1978.
- [CrossRef] [Google Scholar]
- Panax ginseng as an adjuvant treatment for Alzheimer’s disease. J. Ginseng Res.. 2018;42:401-411.
- [CrossRef] [Google Scholar]
- Multi-OMICS: a critical technical perspective on integrative lipidomics approaches. Biochim. Biophys. Acta BBA - Mol. Cell Biol. Lipids. 2017;1862:808-811.
- [CrossRef] [Google Scholar]
- Novel Dammarane-Type Triterpene Saponins from Panax ginseng Root. Chem. Pharm. Bull. (Tokyo). 2015;63:927-934.
- [CrossRef] [Google Scholar]
- Ultra-high performance liquid chromatography/ion mobility time-of-flight mass spectrometry-based untargeted metabolomics combined with quantitative assay unveiled the metabolic difference among the root, leaf, and flower bud of Panax notoginseng. Arab. J. Chem.. 2021;14:103409
- [CrossRef] [Google Scholar]
- GC-MS Metabolomic Analysis to Reveal the Metabolites and Biological Pathways Involved in the Developmental Stages and Tissue Response of Panax ginseng. Molecules. 2017;22:496.
- [CrossRef] [Google Scholar]
- A 1H NMR-based metabolomics approach to evaluate the geographical authenticity of herbal medicine and its application in building a model effectively assessing the mixing proportion of intentional admixtures: A case study of Panax ginseng. J. Pharm. Biomed. Anal.. 2016;124:120-128.
- [CrossRef] [Google Scholar]
- Omics and multi-omics approaches to study the biosynthesis of secondary metabolites in microorganisms. Curr. Opin. Microbiol.. 2018;45:109-116.
- [CrossRef] [Google Scholar]
- Metabolic profiling and scavenging activities of developing circumscissile fruit of psyllium (Plantago ovata Forssk.) reveal variation in primary and secondary metabolites. BMC Plant Biol.. 2020;20:116.
- [CrossRef] [Google Scholar]
- Inhibition of NMDA Receptors Underlies the Neuroprotective Effect of Ginsenoside Rb 3. Am. J. Chin. Med.. 2009;37:759-770.
- [CrossRef] [Google Scholar]
- Identification of bioactive metabolites using activity metabolomics. Nat. Rev. Mol. Cell Biol.. 2019;20:353-367.
- [CrossRef] [Google Scholar]
- Sucrose Metabolism: Gateway to Diverse Carbon Use and Sugar Signaling. Annu. Rev. Plant Biol.. 2014;65:33-67.
- [CrossRef] [Google Scholar]
- Black ginseng-enriched Chong-Myung-Tang extracts improve spatial learning behavior in rats and elicit anti-inflammatory effects in vitro. J. Ginseng Res.. 2017;41:151-158.
- [CrossRef] [Google Scholar]
- CereboostTM, an American ginseng extract, improves cognitive function via up-regulation of choline acetyltransferase expression and neuroprotection. Regul. Toxicol. Pharmacol.. 2016;78:53-58.
- [CrossRef] [Google Scholar]
- The STRING database in 2021: customizable protein–protein networks, and functional characterization of user-uploaded gene/measurement sets. Nucleic Acids Res.. 2021;49:D605-D612.
- [CrossRef] [Google Scholar]
- Urinary Metabolomics Reveals Alterations of Aromatic Amino Acid Metabolism of Alzheimer’s Disease in the Transgenic CRND8 Mice. Curr. Alzheimer Res.. 2016;13:764-776.
- [CrossRef] [Google Scholar]
- Identification and Validation of an Immune-Associated RNA-Binding Proteins Signature to Predict Clinical Outcomes and Therapeutic Responses in Glioma Patients. Cancers. 2021;13:1730.
- [CrossRef] [Google Scholar]
- STRING: known and predicted protein-protein associations, integrated and transferred across organisms. Nucleic Acids Res.. 2004;33:D433-D437.
- [CrossRef] [Google Scholar]
- Analysis of ginsenosides in Panax ginseng in high pressure microwave-assisted extraction. Food Chem.. 2008;110:161-167.
- [CrossRef] [Google Scholar]
- Enhancement of ginsenoside biosynthesis in high-density cultivation of Panax notoginseng cells by various strategies of methyl jasmonate elicitation. Appl. Microbiol. Biotechnol.. 2005;67:752-758.
- [CrossRef] [Google Scholar]
- Untargeted metabolomics analysis to unveil the chemical markers for the differentiation among three Gleditsia sinensis-derived herbal medicines by ultra-high performance liquid chromatography/quadrupole time-of-flight mass spectrometry. Arab. J. Chem.. 2022;15:103762
- [CrossRef] [Google Scholar]
- Development of a prognostic nomogram based on an eight-gene signature for esophageal squamous cell carcinoma by weighted gene co-expression network analysis (WGCNA) Ann. Transl. Med.. 2022;10:88.
- [CrossRef] [Google Scholar]
- Antidepressant-like effects of ginsenoside Rg3 in mice via activation of the hippocampal BDNF signaling cascade. J. Nat. Med.. 2017;71:367-379.
- [CrossRef] [Google Scholar]
- Component analysis and target cell-based neuroactivity screening of Panax ginseng by ultra-performance liquid chromatography coupled with quadrupole-time-of-flight mass spectrometry. J. Chromatogr. B. 2016;1038:1-11.
- [CrossRef] [Google Scholar]
- Ginsenosides: A Potential Neuroprotective Agent. BioMed Res. Int.. 2018;2018:1-11.
- [CrossRef] [Google Scholar]
- Simultaneous quantification of twenty-one ginsenosides and their three aglycones in rat plasma by a developed UFLC–MS/MS assay: Application to a pharmacokinetic study of red ginseng. J. Pharm. Biomed. Anal.. 2017;137:1-12.
- [CrossRef] [Google Scholar]


