

Translate this page into:
Behaviour of electrical conductivity in CsI–Al2O3 and CsI–TiO2 systems
⁎Corresponding author. Tel.: +91 571 2720888. rafi_amu@rediffmail.com (Rafiuddin)
-
Received: ,
Accepted: ,
This article was originally published by Elsevier and was migrated to Scientific Scholar after the change of Publisher.
Abstract
This paper reports the effect of heterogeneously doped alumina and titania on the ionic conductivity of CsI. Composite materials (1 − x)CsI–xAl2O3 and (1 − x)CsI–xTiO2, x = 0–0.7 have been prepared and studied by X-ray diffraction (XRD), differential scanning calorimetry (DSC), scanning electron microscopy (SEM) and impedance spectroscopy. The results confirmed the formation of a composite in which the interface layer plays an important role in controlling the bulk properties of the material. Enhancement of electrical conductivity is noticed with the increase in the mole percent (mol%) of dispersoid and the maximum enhancement is observed at x = 0.3 in case of alumina as well as titania. Arrhenius equation is used to study the effect of temperature on conductivity and activation energy. As the electrical conductivity increased, the activation energy was found to be decreased. The activation energy for CsI–xAl2O3 and CsI–xTiO2 systems was 0.713 and 0.677 eV, respectively.
Keywords
Composite
Dispersoid
Conductivity
Activation energy
Arrhenius equation

1 Introduction
Composite electrolytes are multiphase (mostly two phase) solid systems in which two or more materials are mixed together to achieve some desirable material properties namely enhancement in the ionic conductivity at room temperature. Composite electrolytes are also called heterogeneously doped materials or dispersed solid electrolyte. Conductivity enhancement in two-phase composite systems was known for about many years (Jander, 1929). However, the research activity in this area gained impetus only after 1973, when Liang (1973) reported approximately 50 times enhancement in Li+ ion conductor at room temperature simply by dispersing ultrafine particle of inert Al2O3 in LiI. Since then a large number of two phase composite systems have been investigated with the conductivity enhancement of about one-third order of magnitude compared with those of constituent phases (Przluski et al., 1992; Wieczorek, 1992; Wagner, 1980; Poulsen, 1985). Two phase composite electrolyte systems were prepared in general, by dispersing semi micrometre size particles of insulating chemical inert materials (called second phase dispersoid) into a moderate-ionic conducting solid (called first phase host matrix). The conductivity increases with increasing dispersoid concentration, attains a peak value and then decreases. The peak is generally sharp, except for few systems, such as AgI–Al2O3 (Pack, 1979).
Further more, the conductivity maxima may be different in different composite systems and depend on the nature of the second phase dispersoid (Shahi and Wagner, 1982; Singh and Srivastava, 1992). Interface plays an important role for the transport properties of polycrystalline and polyphase (composite) materials. C. Wagner first used the space-charge layer concept to explain conductivity effects in the semiconducting two phase materials (Wagner, 1972). The importance of space-charge layer for the ionic conduction was first revealed by Liang (1973). After these initial studies, the conductivity enhancement in multiphase materials was confirmed for numerous ceramic composites, including dispersion of fine insulator particles in the ionic conductor matrix and mixture of two different ionic conductors, with a major contribution by Wagner (1989). In particular, the added oxides led to desirable mechanical properties and enhancement of ionic conductivity at room temperature (Mhiri and colomban, 1991; Uvarov et al., 1992, 1994; Ponomareva et al., 1994). He gave a quantitative description of the conductivity enhancement based on the concept of space-charge layer near the phase boundaries.
Heterogeneous doping has been employed to enhance the conductivity of solid electrolyte. In all cases the conductivity was found to go through a maximum as a function of concentration of the insulating component. It has been shown that if the particle size of the inert component is sufficiently small the heterogeneous doping causes a noticeable change in the bulk properties of the ionic salt. In particular new unusual phases of ionic salt were found in Li2SO4–Al2O3 (Chen et al., 1985) and RbNO3–Al2O3 (Uvarov et al., 1996).
X-ray diffraction pattern of cesium iodide taken at room temperature up to the melting point gives no evidence of any transition from simple cubic to fcc structure in contrast to the cesium chloride where transition occurs at 469 °C and in cesium iodide at the melting point as a part of fusion process. The transition accompanied by the sharp decrease in conductivity is due to the mechanism of ionic transport and the presence of phase transition. When an aqueous solution of cesium iodide is evaporated slowly, the rhombic dodecahedral form (1 1 0) is obtained and at a high rate of evaporation, the cubic form (1 0 0) is obtained. CsI is strongly polarisable and has the CsCl-type lattice (Kern, 1952). We have used electrical conductivity measurements, XRD, DSC, to identify the existence of separate phases at CsI–Al2O3 and CsI–TiO2 in the presence of high conducting space-charge region and interactions have also been suggested as the reason of conductivity enhancement in composite systems.
2 Experimental
CsI was used from sigma Aldrich with the stated purity of 99.9%. Alumina and titania were taken from BDH LABORATARY with a stated purity of 99.9%. Alumina and Titania were first ground for 2 h and mixed with acetone followed by drying at 150 °C for 3 h. The material was then ground again for an hour and sieved with 200 mesh. The required amounts of this material and CsI were mixed thoroughly using an agate motor and pestle to produce the series (1 − x)CsI–xAl2O3 and (1 − x)CsI–xTiO2, x = 0–0.7. These mixtures were then heated in an electrical furnace at 200 °C for 3 h with intermittent grinding. The final mixtures were crushed to fine powders and kept in glass tubes. X-ray diffractograms for the material were recorded using a “BRUKER ADVANCED D8” diffractometer with Cuka radiations. DSC traces were taken by heating in the temperature range 25–650 °C using a Perkin–Elmer instrument with Alumina powder as a reference. The heating rate was kept constant at 10 °C/min. Impedance spectroscopy was performed using a hightester HIOKI-353250 LCR METER in the frequency range 42 Hz–5 MHz for circular pellets pressed under 4 tonnes/cm2 pressures. The two opposite surfaces of the pellet were coated with carbon paint and annealed between the electrodes for 2 h at 150 °C to increase the electrical connectivity between the samples and the electrodes. SEM micrographs were taken for the pelletized samples, and SEM was performed using “STEREO-SCAN 360”.
3 Result and discussion
3.1 X-ray-diffraction
X-ray diffractograms of the samples taken at room temperature are presented in Fig. 1a and b shows the presence of a prominent phase which is cubic CsI mixed with Al2O3 and TiO2, respectively. The phase of CsI was confirmed by analysing the prominent peak using PDF#772185. X-ray Diffractograms of pure CsI and CsI doped with alumina did not show any characteristic peak associated with the alumina, indicating the two phases are completely mixed due to cubic phase nature of both CsI and alumina. Similar observations were made in NaCl–Al2O3, NaNO3–Al2O3, KCl–Al2O3 and CsCl–Al2O3 solid electrolyte systems (Kumar and Shahi, 1992, 1994, 1996). However, in the case of CsI doped with titania, a new peak was observed which is attributed to anatase phase of titania. This has been observed to transfer to the rutile phase if titania is sintered at high temperatures or mixed with other impurities (Madhava Rao et al., 2005). It is worthy to mention that the strong X-ray absorbtion of CsI causes the intensities of alumina and titania to drop rapidly upon increasing the amount of CsI in the system.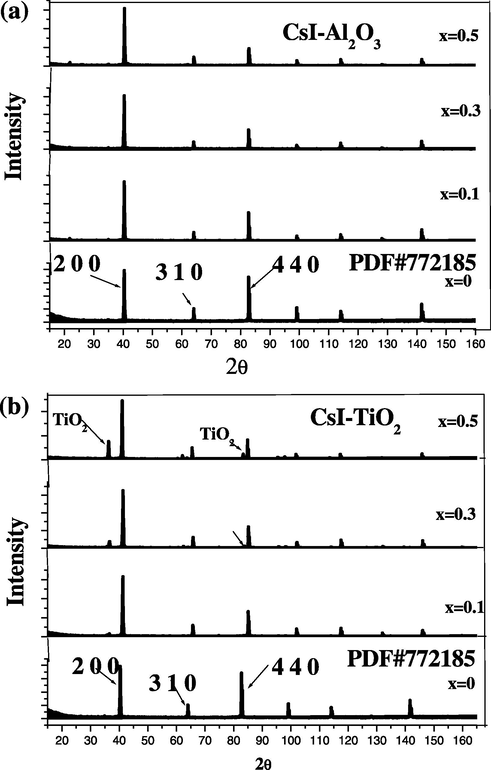
(a and b) Room temperature X-ray diffractograms of (1 − x)CsI–xAl2O3 and (1 − x)CsI–xTiO2 samples.
3.2 Differential scanning calorimetry
Fig. 2a and b shows the heating mode of DSC curve of the sample (pure CsI and CsI doped with different mole percent of alumina and titania) taken in the temperature range 25–650 °C. Pure cesium iodide does not give evidence of any transition and give its melting peak at 620 °C, whereas on increasing the amount of alumina (∼40%) a small hump appears towards the lower side of melting peak at about 257 °C indicating that the increase in the concentration of the dopant makes the transition shift towards the high temperature side. This peak attributed to interface-interaction between CsI and Al2O3. The increase in mole percent of alumina results in the growth of the hump and broadening of the melting peak there by slightly lowering the melting point. This hump could be due to the formation of an amorphous phase within the space-charge layer that is expected to form between the host material and the dispersoid particles (Madhava Rao et al., 2005). The mixture samples show no appreciable effect on the temperature of the phase transition as reported earlier in case of RbNO3–Al2O3 (Uvarov et al., 1996), CsCl–Al2O3 (Uvarov et al., 1994), Cs2H3{(SO4)4–SO2} (Lavrova et al., 2005) and TlI–TiO2 (Sultana and Rafiuddin, 2009). In Fig. 2b, only melting peak of CsI was observed and titania does not show any phase transition.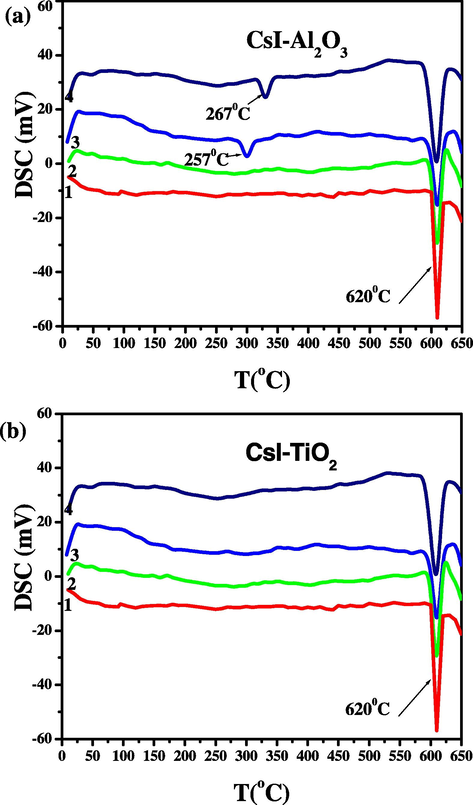
(a and b) DSC curves of (1 − x)CsI–xAl2O3 and (1 − x)CsI–xTiO2 samples: (1) x = 0, (2) x = 0.1, (3) x = 0.3 and (4) x = 0.5.
3.3 Scanning electron microscopy
Fig. 3a and b shows the SEM micrographs of two samples, the first is for pure titania after the process of its grinding with acetone and then sieving with 200 mesh. The micrograph shows reasonable homogeneity with average particle size in the range 200–400 nm. The second SEM micrograph is for the mixture contains 0.3 mol fraction of alumina and titania. It shows distribution of alumina and titania particles between the particles of cesium iodide which has higher average grain size. This distribution of alumina and titania layers between the grains of ionic salt is favoured from local thermodynamic equilibrium due to wetting of alumina and titania particles by CsI grains during the preparation of the mixture (Desvals and Knauth, 1997). This type of distribution is very important in creating a great number of surfaces which in turn act as additional sources of point defects. This new region between the ionic salt and the added oxide is called space-charge layer which strongly alters the bulk properties of the ionic salt (Uvarov and vanek, 2000). It is also clear that low density and a large number of pores are observed in the mixture sample. This is due to the two phase nature of the sample and the particle size difference between the salt and the added oxide.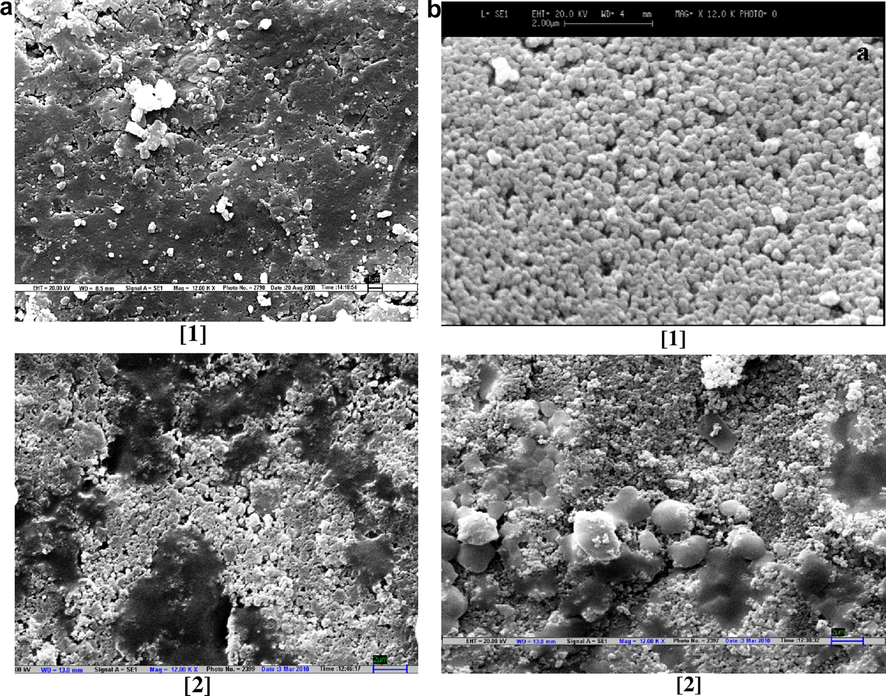
(a and b) SEM micrographs of (1 − x)CsI–xAl2O3 samples: (1) pure Al2O3 and (2) x = 0.3.
3.4 Electrical conductivity
3.4.1 Impedance spectroscopy
AC impedance spectroscopy has become a powerful tool for the investigation of the ionic conductivity. Fig. 4a and b shows the impedance spectra of pure CsI and its mixture with alumina and titania. In this graph we plotted the imaginary impedance component (Z″) at each against the real impedance component (Z′) at each excitation frequency. It is observed that at high frequencies the impedance of the Randles cell was almost entirely created by the ohmic resistance. The frequency reaches its high limit at the left most end of the semicircle. It has been found that the idealized impedance plot of such material consists of a semicircle attributed to grain and grain boundary as well as low frequency inclined spike due to the ionic polarization and electrochemical reactions, occurring at the electrode interface (Dygas et al., 2005; Godinho et al., 2003).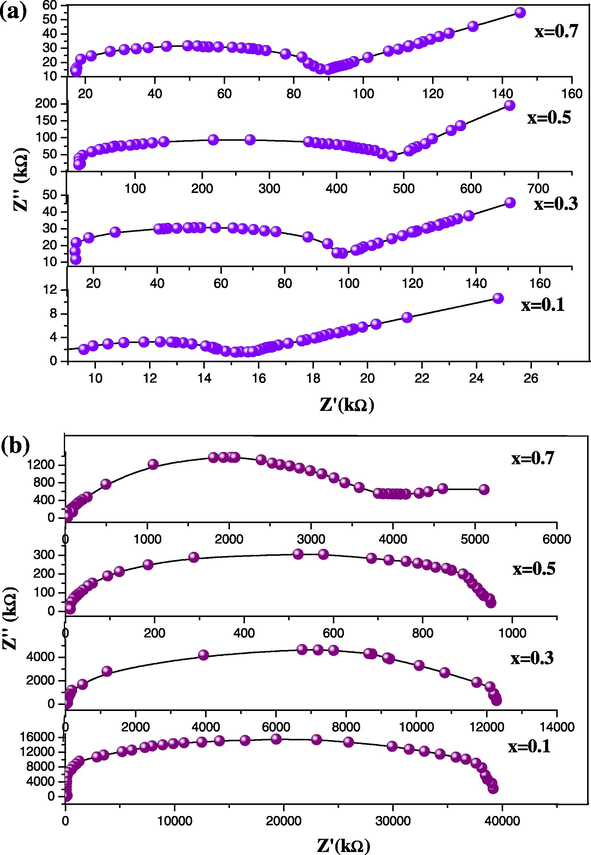
(a and b) Impedance spectra of (1 − x)CsI–xAl2O3 and (1 − x)CsI–xTiO2 samples.
It is well known that the complex impedance (Z∗(ω)) is defined as the sum of its real (Z″) and imaginary part:
3.4.2 Conductivity
Figs. 5a and b illustrates the behaviour of conductivity with the composition of the system at different temperatures. The conductivity increases with the alumina and titania content in the materials and passes through a threshold value after which it starts to decrease with further increase in the mole fraction of alumina and titania. This threshold value estimated from Fig. 5a and b is found to be x = 0.3 (i.e., 30%). The enhancement of ionic conductivity in these types of materials is observed for two reasons; first, the interface region itself is a disordered region where defect formation and migration enthalpies are notably reduced. This leads to the enhancement of ionic conductivity within the interface region (grain boundary diffusion), and second, the disordered region induces concentration profiles of point defect in the region adjacent to the interface in the ionic material (space-charge layers) (Knauth, 2000) These two factors lead to the enhancement of ionic conductivity with increasing amount of dispersoid alumina and titania in the material.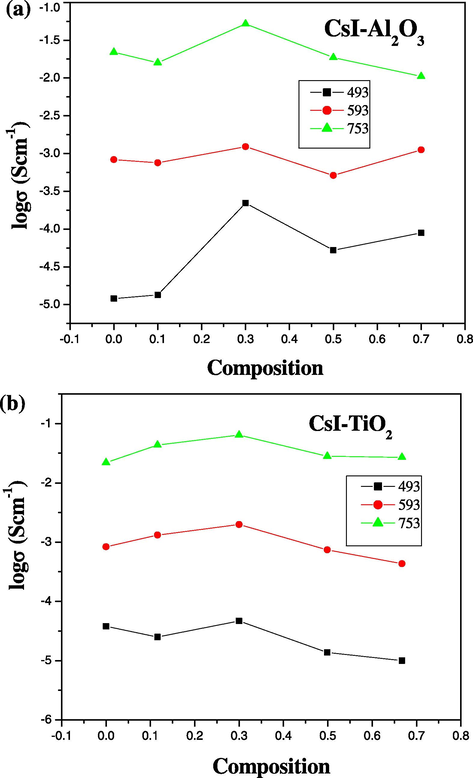
(a and b) Electrical conductivity as a function of composition of (1 − x)CsI–xAl2O3 and (1 − x)CsI–xTiO2 samples at different temperatures.
Fig. 6a and b shows the variation of conductivity as a function of concentration (mole percent) of Al2O3 and TiO2 at different temperatures. The result shows that the maximum enhancement of conductivity occurred at 30% in both cases, thereafter the conductivity shows a remarkable drop (similar results were obtained from Fig. 5). This is because, when the concentration of the dispersoid exceeds the threshold value in the system (x = 0.3), blocking of conduction pathways by the alumina and titania particles was observed leading to a fall in conductivity (Uvarov et al., 1994). CsI is the Schottky disordered material in which anion vacancies are mobile than the cation vacancies. However, very little enhancement is observed due to the addition of alumina and in any case the maximum enhancement is observed at x < 0.4 alumina.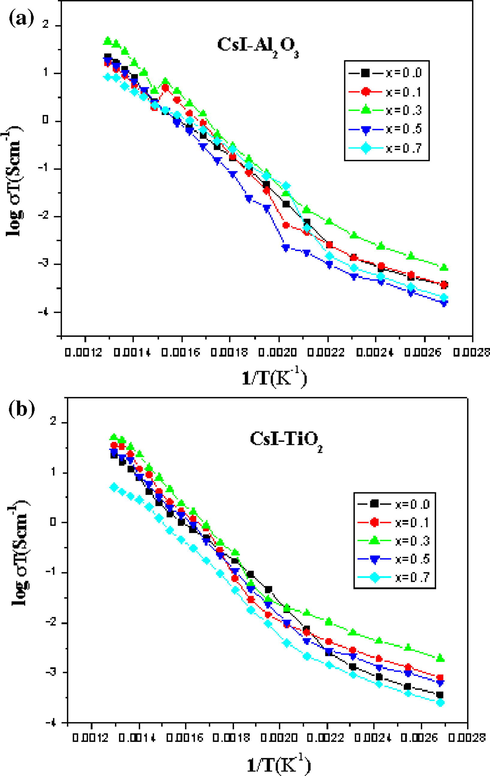
(a and b) Electrical conductivity as a function of temperature at different composition of (1 − x)CsI–xAl2O3 and (1 − x)CsI–xTiO2 samples.
A continuous increase in the contribution of grain boundary to the total resistivity of the samples is also observed with increasing the content of alumina and titania in the system. This is due to the increase in the phase boundary as has been seen in SEM micrographs above. CsI have a bcc crystal structure but in the case of CsCl the sharp fall in conductance occurs at the transition bcc-fcc. CsI shows a similar increase in activation energy on approaching the melting point.
The temperature dependence of ionic conductivity is given by the Arrhenius expression,
Mole fraction
Activation energy (eV) Al2O3
Activation energy (eV) TiO2
0
0.714
0.714
0.1
0.721
0.715
0.3
0.713
0.677
0.5
0.785
0.706
0.7
0.720
0.670
According to the Maier’s space-charge model (Maier, 1995) the solid electrolyte is enriched with defects in the interface space-charge region, especially if the surface interaction between the phases of a composite takes place. Space-charge layers that are formed around dislocations and inner intergrain boundaries of the solid electrolyte (Dudney, 1988, 1989), also give rise to the point defect concentration. The space-charge model is applicable for many systems where the crystal structure and thermodynamic parameters of the ionic component do not change markedly after its heterogeneous doping. However, it is not the case in all composites. Thermodynamic properties of both the components in AgI–Al2O3 (Chen, 1986) differ from those of pure substances, silver iodide being likely in amorphous state (Uvarov et al., 1990).
4 Conclusion
Electrical conductivity has enhanced and activation energy of conduction has decreased remarkably in the systems CsI–Al2O3 and CsI–TiO2 compared to the pure CsI. The highest ionic conductivity was observed in both the systems at x = 0.3 mol fraction of dispersoid (alumina and titania). XRD and DSC ruled out the formation of solid solutions between the host material and the dispersoid. The experimental data indicating higher conductivity in dispersed system are interpreted in terms of the formation of space-charge layer between the host material and the dispersoid in which defect concentration increases and that is believed to be the possible mechanism of conductivity enhancement. The material is found to be in a binary phase system with alumina and titania particles distributed between the grains of cesium iodide. The enhancement of electrical conductivity in comparison with pure cesium iodide can be interpreted with the space-charge layer model. The behaviour is explained in terms of disordering phenomena at interface regions and space-charge layers formed in the bulk grains of cesium iodide.
Acknowledgements
Authors are thankful to Aligarh Muslim University, Aligarh for providing necessary research facilities. UGC is to be thanked for providing financial assistance.
References
- Chowdary B.V.R., ed. Composite Solid Electrolytes Materials for Solid State Batteries. World Pub. Co.; 1986. p. :69.
- Acta Phys. Sin.. 1985;34:102-112.
- J. Phys. Chem. Solids. 1997;58:319.
- Solid State Ionics. 1988;28–30:1065.
- Annu. Rev. Mater. Sci.. 1989;19:103.
- Solid State Ionics. 2005;176:2085.
- Mater. Lett.. 2003;57:2540.
- Czech. J. Phys. B. 1981;31:620.
- Angew. Chem.. 1929;42:462.
- Compt. Rend.. 1952;234:1696-1697.
- Solid State Ionics. 1999;119:145.
- J. Electroceramics. 2000;5:111.
- Chowdari B.V.R., ed. Solid State Ionics: Materials and Applications. New York: World Pub. Co.; 1992. p. :433.
- Chowdary B.V.R., ed. Solid Ionics Materials. Singapore: World Scientific Pub. Co.; 1994. p. :14.
- Mater. Res. Bull.. 1996;3:877.
- Solid State Ionics. 2005;176:767.
- J. Electrochem. Soc.. 1973;120:1289.
- Physica B. 2005;362:193.
- Prog. Solid State Chem.. 1995;23:171.
- Solid State Ionics. 1991;44:235.
- Pack, S., 1979. Electrochemical Society Meeting, Los Angeles, Abstract No. 133.
- Solid State Ionics. 1994;74:15.
- Andersen N.H., Clausen K., Skaarup S., Sorensen O.T., eds. Transport – Structure Relations in Fast Ion and Mixed Conductors. Roskilide, Denmark: Riso National Laboratory; 1985. p. :67.
- Przluski, J., Wieczorek, W., Florjanczyk, Z., 1992. In: Chowdari, B.V.R., Chandra, S., Singh, S., Srivastava, P.C. (Ed.), Solid State Ionics – Materials and Applications, p. 209.
- J. Solid State Chem.. 1982;42:107.
- Singh, S., Srivastava, P.C. (Eds.), 1992. Solid State Ionics – Materials and Applications, p. 209.
- Physica B. 2009;404:36.
- J. Mater. Synth. Proc.. 2000;8:319.
- Rev. Solid State Sci.. 1990;4:61.
- Solid State Ionics. 1992;51:41.
- Solid State Ionics. 1994;74:15.
- J. Mater. Synth. Process. 1996;4:391.
- J. Phys. Chem. Solids. 1972;33:1051.
- Mater. Res. Bull.. 1980;15:1691.
- Takahashi T., ed. High Conductivity Solid ion Conductors. Singapore: World Scientific; 1989.
- Wieczorek, W., 1992. Solid State Ionics 53–56, 1064.


