

Translate this page into:
Bioinformatical and experimental validation on EFNA5 biomarker for pancreatic cancer
⁎Corresponding authors at: Department of Oncology, The Second Affiliated Hospital of Zhengzhou University, No. 2 Jingba Road, Jinshui District, Zhengzhou 450014, Henan Province, China. suliman.khan18@mails.ucas.ac.cn (Suliman Khan), panjie1221@126.com (Zhenjie Pan), wj68happy@hotmail.com (Jian Wang)
-
Received: ,
Accepted: ,
This article was originally published by Elsevier and was migrated to Scientific Scholar after the change of Publisher.
Abstract
Pancreatic cancer is one of the most aggressive malignancies in the digestive system, characterized by vague early symptoms and rapid disease progression. Currently, treatment options for pancreatic cancer are limited, with unsatisfactory outcomes and poor prognosis, as the overall 5-year survival rate is less than 10%. Therefore, it is crucial to identify new biomarkers for pancreatic cancer.
We analyzed the differential expression of EFNA5 at the mRNA level using data from the TCGA, GTEX, and GEO databases, followed by validation of EFNA5 protein expression differences through immunohistochemistry. Kaplan-Meier survival analysis and Cox regression analysis were used to explore the prognostic value of EFNA5. KEGG, GO enrichment analyses, and GSEA were employed to predict the biological functions of EFNA5. Bioinformatics algorithms were utilized to analyze the impact of EFNA5 on drug sensitivity, immune cell infiltration, and tumor mutational burden. Finally, we conducted cell phenotype experiments to investigate the effects of EFNA5 on the proliferation, migration, and invasion of pancreatic cancer cells. Bioinformatics data showed that the mRNA level of EFNA5 was higher in pancreatic cancer tissues compared to normal tissues. Immunohistochemistry experiments confirmed that the protein expression level of EFNA5 was significantly higher in pancreatic cancer tissues (n = 19) than in adjacent normal tissues (n = 19). Survival analysis indicated that the overall survival (OS) and progression-free survival (PFS) were worse in the high EFNA5 expression group compared to the low expression group. Univariate and multivariate Cox regression analyses demonstrated that EFNA5 is a risk factor affecting the prognosis of pancreatic cancer patients. KEGG pathway enrichment analysis revealed that differentially expressed genes (DEGs) between high and low EFNA5 expression groups were primarily enriched in pathways such as PI3K/Akt, axon guidance, and focal adhesion. GO enrichment analysis showed that DEGs were mainly associated with functions like epidermis development, cell adhesion, and intercellular junctions. Immune cell infiltration analysis found that EFNA5 expression was correlated with the infiltration levels of various immune cells. The tumor mutational burden was higher in the high EFNA5 expression group compared to the low expression group. Drug sensitivity analysis indicated that the high EFNA5 expression group had lower sensitivity to several commonly used chemotherapy drugs for pancreatic cancer. Cellular experiments demonstrated that knocking down EFNA5 inhibited the proliferation, invasion, and migration of pancreatic cancer cells. EFNA5 is overexpressed in pancreatic cancer tissues, and its high expression is associated with poor prognosis in pancreatic cancer patients. Downregulation of EFNA5 reduces the proliferation, migration, and invasion capabilities of the pancreatic cancer cell line BxPC-3. EFNA5 is closely related to the occurrence, development, prognosis, immune infiltration, and drug sensitivity of pancreatic cancer. Our study suggests that EFNA5 is a potential biomarker and therapeutic target.
1 Introduction
Pancreatic cancer is a relatively rare but highly malignant tumor of the digestive tract. Currently, pancreatic cancer ranks as the eighth most common cancer among women and the tenth among men in the United States, yet it is the fourth leading cause of cancer-related deaths in the country (Siegel et al., 2023). Pancreatic ductal adenocarcinoma (PDAC) accounts for the majority of pancreatic cancers (over 90%), while other subtypes such as pancreatic head cancer, pancreatoblastoma, and neuroendocrine tumors are relatively rare (Collisson et al., 2019; Park et al., 2021). Due to its characteristics of insidious early symptoms, late diagnosis, low resectability (Ahmadipour et al., 2024), high metastatic potential, and high recurrence rate, the 5-year survival rate for pancreatic cancer is only 10% (Mizrahi et al., 2020). Therefore, identifying new prognostic biomarkers and potential therapeutic targets is crucial for improving the prognosis of pancreatic cancer.
EFNA5, fully named Ephrin A5, is a member of the Eph/Ephrin signaling system. Eph proteins belong to the transmembrane tyrosine kinase receptor superfamily, and their ligands are known as Ephrins, derived from the abbreviation for Eph family receptor interacting proteins (Kania and Klein, 2016). Ephrin ligands can bind to Eph receptors to initiate short-range bidirectional intercellular communication, leading to various biological effects (Depaepe et al., 2005). The Eph/Ephrin (EFN) signaling axis is closely associated with neural development, angiogenesis, cell differentiation, proliferation, apoptosis, and tumorigenesis (Depaepe et al., 2005). Physiologically, EFNA5 primarily participates in neurological development and lens homeostasis; pathologically, abnormal upregulation of EFNA5 in the retina promotes pathological retinal neovascularization (Ieguchi and Maru, 2021). EFNA5 is closely related to several malignancies and exhibits abnormal expression in colorectal cancer (Papadakos et al., 2022), pancreatic cancer (Xie et al., 2021), glioma (Ricci et al., 2020), non-small cell lung cancer (Zhang et al., 2023), and other malignancies. In gliomas and non-small cell lung cancer, EFNA5 expression is elevated, promoting tumorigenesis and progression through various mechanisms (Ricci et al., 2020; Zhang et al., 2023). Interestingly, EFNA5 is downregulated in colorectal cancer, with studies indicating that MiR-645 promotes the malignant biological behavior of colorectal cancer by targeting EFNA5, suggesting that EFNA5 may act as a “tumor suppressor gene” in colorectal cancer (Li et al., 2020). This highlights the ability of EFNA5 to promote or inhibit tumorigenesis and progression through multiple mechanisms (Sivanathan et al., 2022). In pancreatic cancer, studies have shown that effective neoadjuvant chemotherapy (NAT) can reduce the expression of collagen types I, III, IV, and V in pancreatic cancer tissue, and this stromal remodeling is closely related to EFNA5 (Nakajima et al., 2022). NAT may inhibit collagen expression by downregulating EFNA5. However, there are few studies on the mechanism of EFNA5 in pancreatic cancer.
In this study, we first analyzed the mRNA expression of EFNA5 in pancreatic cancer using the GTEX, TCGA, and GEO databases, and then validated the protein expression of EFNA5 in pancreatic cancer tissues through immunohistochemistry. We also analyzed the relationship between EFNA5 and the survival prognosis of pancreatic cancer patients based on the TCGA database. Next, we explored the signaling pathways and biological functions involving EFNA5 in pancreatic cancer through KEGG, GO, and GSEA methods. Additionally, we employed bioinformatics algorithms to investigate the correlation between EFNA5 and immune cell infiltration, drug sensitivity, and tumor mutational burden. Finally, we designed a series of in vitro experiments to evaluate the impact of EFNA5 on the proliferation, migration, and invasion of pancreatic cancer cells.
2 Methods
2.1 Bioinformatics data Sources
The Cancer Genome Atlas Program (TCGA, https://www.cancer.gov/ccg/research/genome-sequencing/tcga) is a comprehensive project that has cataloged sequencing data, including RNA-Seq, methylation data, and copy number variation (CNV) data, from over 10,000 cancerous and adjacent non-cancerous tissue samples across more than 30 types of tumors. It also provides corresponding clinical information.
The Gene Expression Omnibus (GEO, https://www.ncbi.nlm.nih.gov/geo) is a database that primarily collects gene expression profile data from studies published by researchers worldwide. The Genotype-Tissue Expression (GTEX, https://gtexportal.org/home) project collects genomic data from over 50 types of normal tissues and organs, donated by healthy volunteers during their lifetime.
In this study, two datasets from the GEO database were used: GSE183795 (Yang et al., 2022) (139 PDAC samples and 102 normal samples) and GSE15471 (Badea et al., 2008) (36 PDAC samples and 36 normal samples). We also used sequencing data from 171 normal pancreatic tissue samples from the GTEX database and 179 pancreatic cancer tissue samples and 4 normal tissue samples from the TCGA database.
2.2 Tissue samples
We collected 19 pairs of pancreatic cancer and adjacent non-cancerous tissue paraffin-embedded specimens from patients who underwent surgical resection at the Second Affiliated Hospital of Zhengzhou University between 2018 and 2022. Inclusion criteria: 1) Postoperative pathological diagnosis of primary pancreatic cancer; 2) No preoperative radiotherapy, chemotherapy, or other related treatments; 3) No concomitant other malignancies. Exclusion criteria: 1) Specimens of inadequate quality for subsequent experiments; 2) Patients who received radiotherapy or chemotherapy before surgery; 3) Patients with tumors in other organs or systems. The study was approved by the Ethics Committee of the Second Affiliated Hospital of Zhengzhou University, with the ethical approval number 2023210.
2.3 Analysis of the diagnostic and prognostic value of EFNA5 in pancreatic cancer
Raw data were organized using R 4.2.1 and Strawberry Perl 5.3.2.1. The R package “limma” was used to analyze the differential expression of EFNA5 between tumor and normal tissues, followed by visualization using the “ggplot2″ and ”ggpubr“ packages. Survival analysis, including overall survival (OS) and progression-free survival (PFS) differences between high and low EFNA5 expression groups, was performed using the R packages ”survival“ and ”survminer.“ Univariate and multivariate Cox regression analyses were conducted to assess the prognostic value of EFNA5 in pancreatic cancer. A nomogram was constructed using the ”regplot“ package to predict the prognosis of pancreatic cancer patients based on EFNA5 expression levels, age, gender, tumor grade, and stage.
2.4 Functional enrichment analysis
KEGG and GO functional enrichment analyses were used to explore the potential functions of the EFNA5 gene. The “limma” package in R was used to identify differentially expressed genes (DEGs) between high and low EFNA5 expression groups, with selection criteria of logFC ≥ 0.5 and adjP < 0.05. The “clusterProfiler” package in R was then used to perform KEGG and GO enrichment analyses on these DEGs (Yu et al., 2012). Gene Set Enrichment Analysis (GSEA) is an enrichment method developed by the Broad Institute to analyze upregulated or downregulated gene sets separately. We used GSEA to analyze the pathways enriched in the low and high EFNA5 expression groups (Subramanian et al., 2005).
2.5 Immune cell infiltration analysis
CIBERSORT, developed by Stanford University, is an immune infiltration analysis tool that uses a linear support vector regression-based deconvolution method to estimate the proportion of different immune cell subtypes in tumor tissues based on gene expression data (Newman et al., 2015). In this study, the CIBERSORT algorithm was used to analyze the differences in immune cell infiltration between high and low EFNA5 expression groups.
2.6 Tumor mutational burden analysis
Tumor mutational burden (TMB) data for pancreatic cancer were downloaded from the TCGA website. The data were processed using R and Perl software to analyze the correlation between EFNA5 expression and TMB.
2.7 Drug sensitivity analysis
The “OncoPredict” package (Maeser et al., 2021), which is based on machine learning algorithms, builds prediction models by training known cell expression profiles and drug sensitivity information. This package can predict tumor cell responses to different drugs based on gene expression profiles, thereby providing a basis for personalized treatment. We downloaded IC50 values for various anticancer drugs and expression profile data of cell lines from the GDSC database (Yang et al., 2013). The “OncoPredict” package in R was used to analyze the relationship between EFNA5 expression and the sensitivity of pancreatic cancer to commonly used chemotherapy drugs and small-molecule antitumor drugs.
2.8 Immunohistochemistry experiments
Paraffin blocks were sectioned, and immunohistochemical staining was performed according to the following steps: deparaffinization, antigen retrieval, blocking endogenous peroxidase activity, primary antibody incubation (1:100 dilution), secondary antibody incubation, DAB staining, hematoxylin counterstaining, clearing, and mounting. The immunohistochemical results were independently and blindly evaluated by two professional technicians, assessing staining intensity and the percentage of positive cells in all sections (Chahrour et al., 2023). The staining intensity was scored as follows: no color, 0 points; light yellow, 1 point; yellowish-brown, 2 points; brown, 3 points. The percentage of positive cells was scored as follows: <5%, 0 points; 6%-25%, 1 point; 26%-50%, 2 points; 51%-75%, 3 points; >75%, 4 points. The final immunohistochemical score was calculated as the product of the staining intensity and the percentage of positive cells: 0 points for negative (−), 1–4 points for weak positive (+), 5–8 points for moderate positive (++), and 9–12 points for strong positive (+++).
2.9 Cell lines and Culture Conditions
The pancreatic cancer cell line BxPC-3 was purchased from Shanghai Zhongqiao Xinzhou Biotechnology Co., Ltd. Cells were cultured at 37°C in a 5% CO2 atmosphere with 10% fetal bovine serum (FBS, CLARK) in 1640 medium.
2.10 Western blotting
Cells were lysed with RIPA buffer, and proteins were extracted. Protein concentration was determined using a BCA kit. Samples were separated by 10% SDS-PAGE and transferred onto PVDF membranes. Membranes were incubated with primary antibodies at 4°C for 12 h, washed three times with TBST, and then incubated with secondary antibodies at room temperature for 1 h. After three washes with TBST, the membranes were developed using ECL detection reagent (Ahmadipour et al., 2022).
2.11 Cell transfection
Three EFNA5-siRNAs were synthesized by Shanghai Shenggong Bioengineering Co., Ltd. siRNA-02, validated by Western blotting, was selected for subsequent experiments. The transfection reagent lipo8000 was provided by Beyotime Biotechnology. The transfection system consisted of siRNA, lipo8000, and OptiMEM. Proteins were extracted or subsequent experiments were performed 48 h after transfection.
2.12 CCK8 proliferation assay
The CCK8 kit was provided by Yacoy Biotechnology Co., Ltd. The working system was prepared by mixing CCK8 reagent and 1640 medium at a 1:9 ratio, with 10 µL of the working solution added to each well. Cells were seeded in 96-well plates at a density of 5 × 10³ cells per well after digestion and counting. The CCK8 working solution was added at 0, 24, 48, and 72 h after seeding, incubated for 2 h, and then measured at 450 nm.
2.13 Transwell assay and wound healing assay
An 8 µm pore Transwell chamber was used for this experiment. The upper chamber contained 1640 medium with 2% FBS, with 5 × 10⁴ cells (or 10 × 104 cells for the invasion assay) seeded. The lower chamber contained 1640 medium with 20% FBS. For the invasion assay, Matrigel was pre-coated onto the membrane. After 24 h of incubation, cells were fixed, stained, and photographed.
For the wound healing assay, a 10 µL pipette tip was used to create scratches after 48 h of transfection, followed by a medium change. Images were taken under a microscope at 0 and 48 h after scratching.
2.14 Statistical analysis
Bioinformatics data were analyzed and visualized using R (version 4.2.1). Experimental data were analyzed using SPSS 26.0 and GraphPad Prism 9.5.0. Data were expressed as mean ± SD. An independent Student's t-test was used to analyze normally distributed variables, while the Mann–Whitney U test (Wilcoxon rank-sum test) was used for non-normally distributed variables.
3 Results
3.1 Differences in EFNA5 at the mRNA level
An analysis was conducted on mRNA sequencing data from 171 normal pancreatic tissues from the GTEx database, 179 pancreatic cancer tissues and 4 adjacent non-cancerous tissues from the TCGA database. The results indicated that EFNA5 expression was significantly higher in pancreatic cancer tissues compared to normal tissues, with the difference being statistically significant (p < 0.001), as shown in Fig. 1-A. To validate this difference, we used external datasets for further verification. Differential analysis was performed on two datasets from the GEO database, GSE15471 and GSE183795. The results confirmed that EFNA5 was also highly expressed in pancreatic cancer tissues, with the differences being statistically significant (all p < 0.001), as shown in Fig. 1-B and 1-C.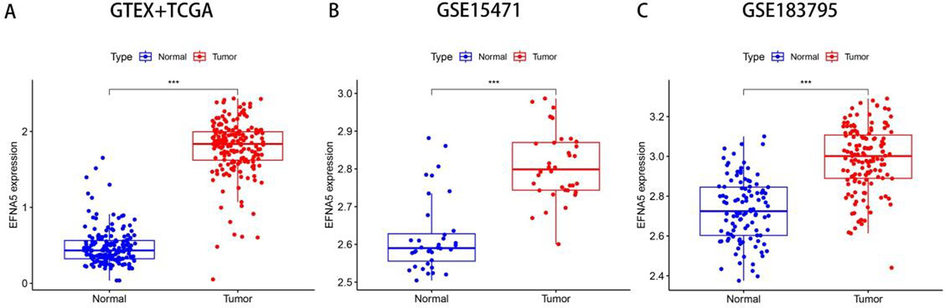
A. Analysis of EFNA5 expression in pancreatic cancer tissues (n = 179) and normal tissues (n = 175) based on the GTEX and TCGA databases. B. Analysis of EFNA5 expression in pancreatic cancer tissues (n = 36) and adjacent non-cancerous tissues (n = 36) in the GSE15471 dataset. C. Analysis of EFNA5 expression in pancreatic cancer tissues (n = 139) and adjacent non-cancerous tissues (n = 102) in the GSE15471 dataset.
3.2 Differences in EFNA5 at the protein level
To verify the results obtained from the database analysis at the protein level, we conducted immunohistochemistry (IHC) experiments. EFNA5 protein expression was examined in 19 pancreatic cancer tissues and 19 adjacent non-cancerous tissues. Representative IHC images are shown in Fig. 2-A and 2-C. We then performed a statistical analysis of the IHC scores for the cancerous and adjacent tissues. The results demonstrated that EFNA5 expression at the protein level was significantly higher in cancerous tissues compared to adjacent tissues, with the difference being statistically significant (p < 0.001), as shown in Fig. 2-B.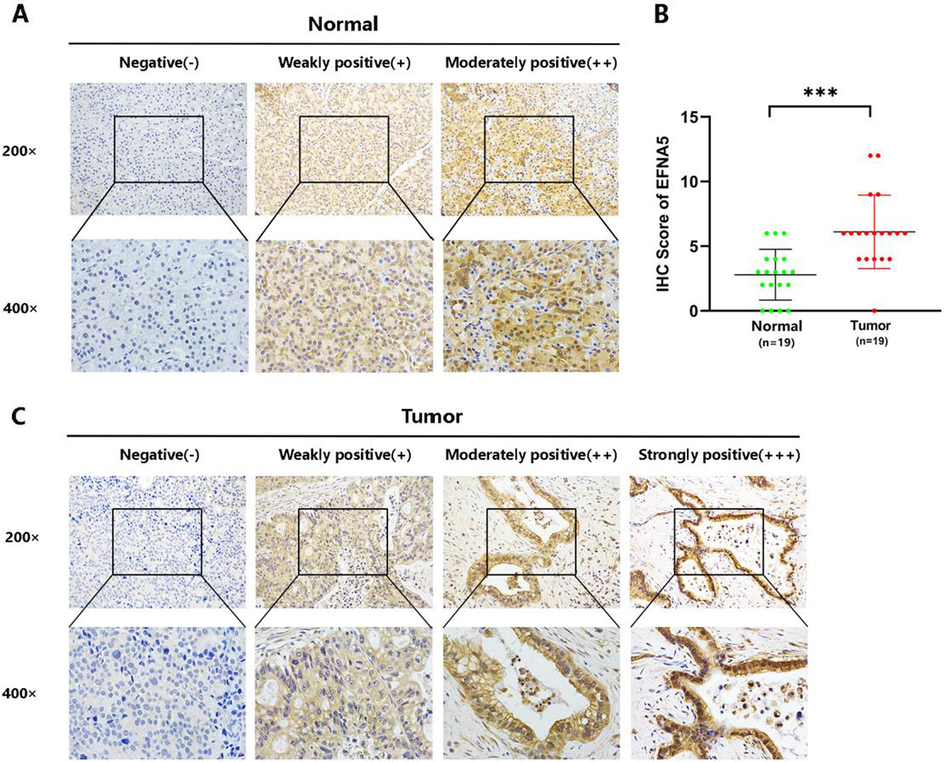
A. Immunohistochemistry (IHC) results of 19 adjacent non-cancerous tissues, showing representative images under 200x and 400x magnification. B. EFNA5 expression in pancreatic cancer tissues (n = 19) is significantly higher than in adjacent non-cancerous tissues (n = 19), with p < 0.001. Green dots represent the IHC scores of adjacent non-cancerous tissues, and red dots represent the IHC scores of cancer tissues. C. IHC results of 19 pancreatic cancer tissues, showing representative images at different staining intensities.
3.3 Survival analysis
Based on data from the TCGA database, 177 pancreatic cancer patients were divided into a high EFNA5 expression group (n=88) and a low expression group (n=89) using the median EFNA5 expression level as the cutoff. The Kaplan-Meier method was employed to analyze the relationship between EFNA5 expression levels and overall survival (OS) as well as progression-free survival (PFS). The results showed that both OS and PFS were significantly shorter in the high EFNA5 expression group compared to the low expression group (p < 0.01), as shown in Fig. 3-A and -B.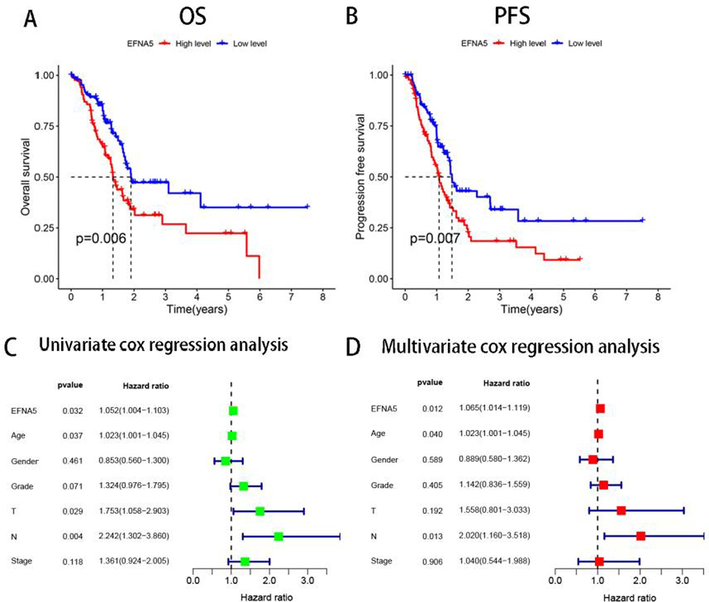
A. In the TCGA data, the overall survival (OS) of the high EFNA5 expression group (n = 88) is significantly shorter than that of the low expression group (n = 89), p < 0.01. B. The progression-free survival (PFS) of the high EFNA5 expression group (n = 88) is significantly shorter than that of the low expression group, p < 0.01. C, D. Univariate and multivariate COX regression analyses determine the prognostic value of each factor.
Subsequently, to determine whether EFNA5 is an independent prognostic factor for pancreatic cancer patients, we conducted univariate and multivariate COX regression analyses using OS as the outcome measure, considering EFNA5 and various clinicopathological parameters, as shown in Fig. 3-C and 3-D. Univariate COX regression analysis indicated that EFNA5, age, T stage, and N stage were risk factors affecting OS, with an HR value of 1.052 and a 95% CI of 1.004–1.103 (p < 0.05) for EFNA5. Multivariate COX regression analysis further revealed that EFNA5, age, and N stage were significant factors influencing OS in pancreatic cancer patients, with an HR value of 1.065 and a 95% CI of 1.014–1.119 (p < 0.05) for EFNA5. These data further indicate that EFNA5 is a risk factor affecting the prognosis of pancreatic cancer patients.
3.4 KEGG and GO enrichment analysis of EFNA5
Using the median EFNA5 expression level as a threshold, pancreatic cancer samples from the TCGA database were divided into a high EFNA5 expression group (n=88) and a low expression group (n=89). Differentially expressed genes (DEGs) between the high and low EFNA5 expression groups were identified using the criteria |log Fold Change (FC)| > 0.5 and adjusted p-value < 0.05. KEGG and GO enrichment analyses were then performed on these DEGs. Bubble plots were created to illustrate the top ten pathways from the KEGG enrichment analysis and the top five functions from the GO enrichment analysis, as shown in Fig. 4.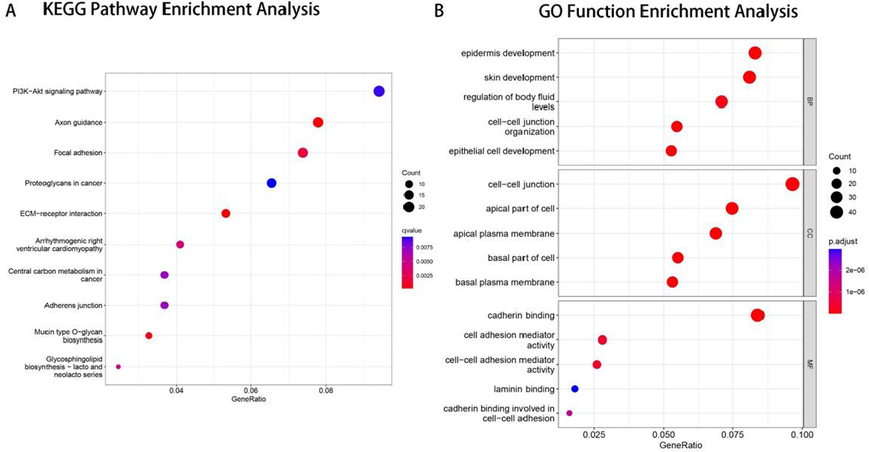
A. Bubble chart of KEGG pathway enrichment analysis. B. Bubble chart of GO functional enrichment analysis.
KEGG pathway enrichment analysis revealed that DEGs were primarily enriched in pathways such as PI3K/Akt, axon guidance, focal adhesion, proteoglycans in cancer, ECM-receptor interaction, central carbon metabolism in cancer, and adherens junction, with the PI3K/AKT pathway having the highest number of enriched DEGs. GO functional enrichment analysis showed that in the Biological Process (BP) category, DEGs were mainly enriched in processes such as epidermis development, regulation of fluid levels, cell–cell junction organization, and epithelial cell development. In the Cellular Component (CC) category, DEGs were primarily enriched in components such as cell–cell junction, apical part of cell, apical plasma membrane, basal part of cell, and basement membrane. In the Molecular Function (MF) category, DEGs were mainly enriched in functions such as cadherin binding, cell adhesion mediator activity, and laminin binding.
3.5 GSEA enrichment analysis of EFNA5
Gene Set Enrichment Analysis (GSEA) was performed to identify enriched pathways in the EFNA5 high expression group and low expression group. The high expression group had six significantly enriched pathways, while the low expression group had 36 significantly enriched pathways. The top five pathways, ranked by enrichment score, are illustrated in Fig. 5. The results showed that the EFNA5 high expression group was primarily enriched in pathways related to base excision repair, cell cycle, drug metabolism, and homologous recombination. In contrast, the EFNA5 low expression group was enriched in pathways related to cell adhesion, chemokine signaling, and cytokine-cytokine receptor interaction.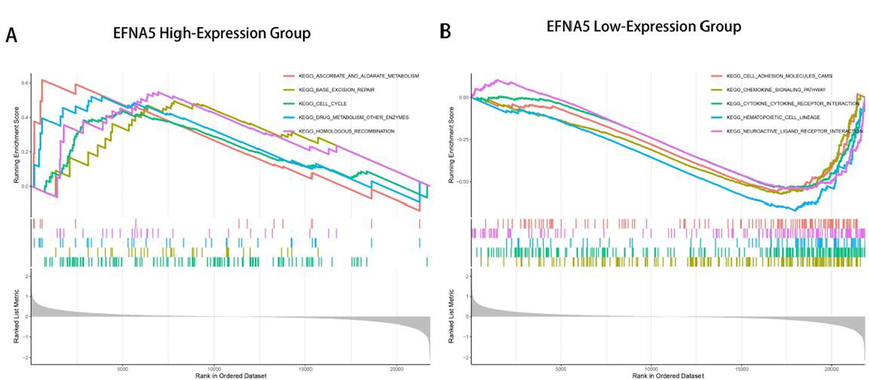
A. GSEA enrichment analysis of the EFNA5 high-expression group. B. GSEA enrichment analysis of the EFNA5 low-expression group.
3.6 Immune cell infiltration and tumor mutation burden analysis
To evaluate the impact of EFNA5 on immune cell infiltration, the CIBERSORT algorithm was used to analyze the distribution of immune cells between the EFNA5 high and low expression groups. The results showed that the high expression group had higher levels of M0 macrophage infiltration and lower levels of CD8+ T cells and activated CD4+ memory T cells compared to the low expression group, as shown in Fig. 6-A. Further analysis of the correlation between EFNA5 expression and immune cell levels revealed a positive correlation between EFNA5 and M0 macrophages (p < 0.01) and a negative correlation between EFNA5 and CD8+ T cells (p < 0.001), as shown in Fig. 6-B.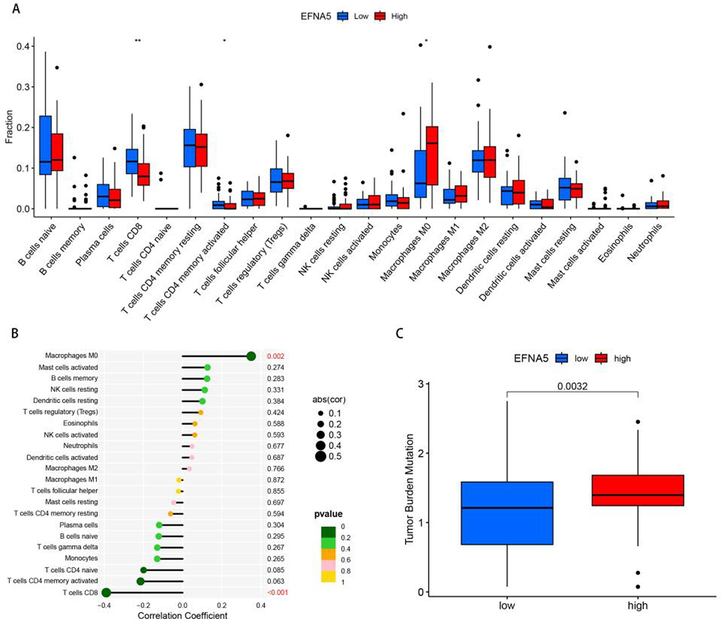
A. Immune cell distribution in the EFNA5 high- and low-expression groups. B. Correlation analysis between EFNA5 and levels of infiltrating immune cells. C. Tumor mutation burden analysis.
Tumor Mutation Burden (TMB) refers to the number of somatic nonsynonymous mutations within a specific genomic region and is associated with patient survival and the efficacy of immunotherapy. TMB data for pancreatic cancer patients were downloaded from the TCGA database, and a statistical analysis was conducted to compare TMB between the EFNA5 high and low expression groups. The results indicated that the high expression group had a significantly higher TMB (p < 0.01), as shown in Fig. 6-C.
3.7 Drug sensitivity
Expression profile data and IC50 values for various anticancer drugs in different cell lines were downloaded from the GDSC database. Based on this data, the “OncoPredict” package was used to predict the IC50 values for different chemotherapy drugs and small molecule inhibitors in pancreatic cancer samples from the TCGA database. Lower IC50 values indicate higher sensitivity to the drug. Drug sensitivity analysis showed that, compared to the EFNA5 low expression group, the high expression group had reduced sensitivity to gemcitabine, paclitaxel, oxaliplatin, irinotecan, cisplatin, docetaxel, AMG-319 (a PI3K inhibitor), and AT13148 (an AKT inhibitor), with statistically significant differences (p < 0.05). For 5-FU, the high expression group showed a trend towards reduced sensitivity, but the difference was not statistically significant, as shown in Fig. 7.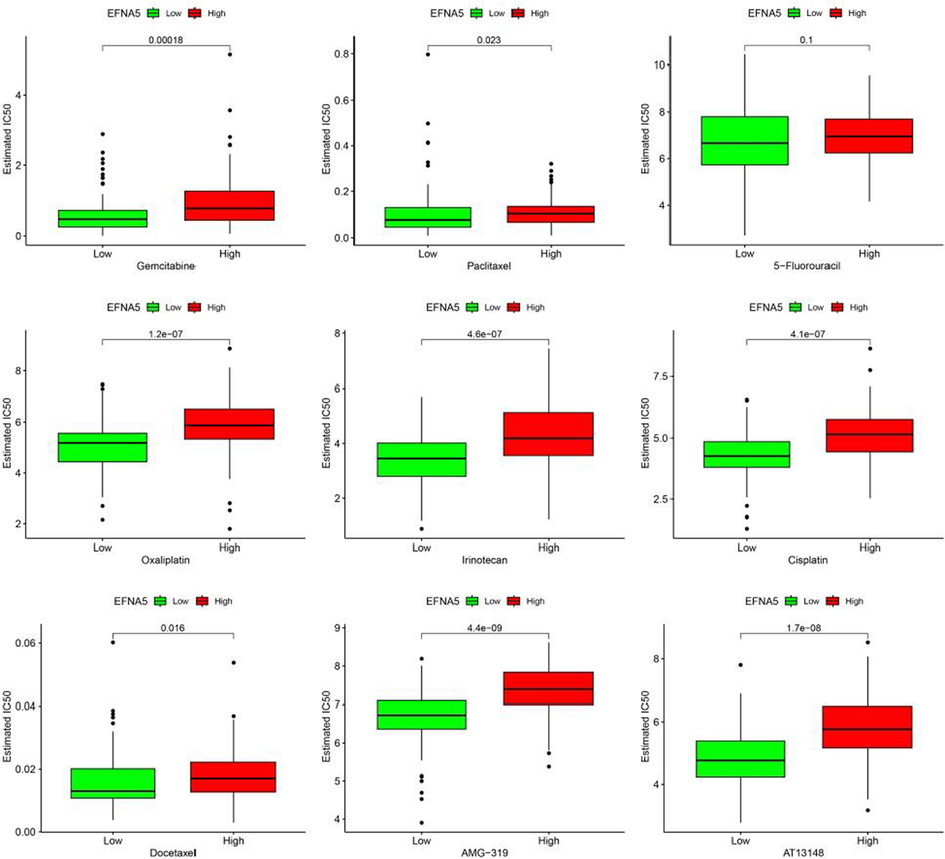
Drug sensitivity analysis.
3.8 Cell phenotype experiments
We designed a series of experiments to investigate the impact of downregulating EFNA5 expression on the proliferation, migration, and invasion abilities of pancreatic cancer cells. Western blot analysis was used to detect the expression levels of EFNA5 protein. Compared with the si-NC group, all three siRNAs significantly reduced EFNA5 protein expression (p < 0.05), with si-EFNA5-02 showing the highest knockdown efficiency. Therefore, si-EFNA5-02 was selected for subsequent experiments, as shown in Fig. 8-A.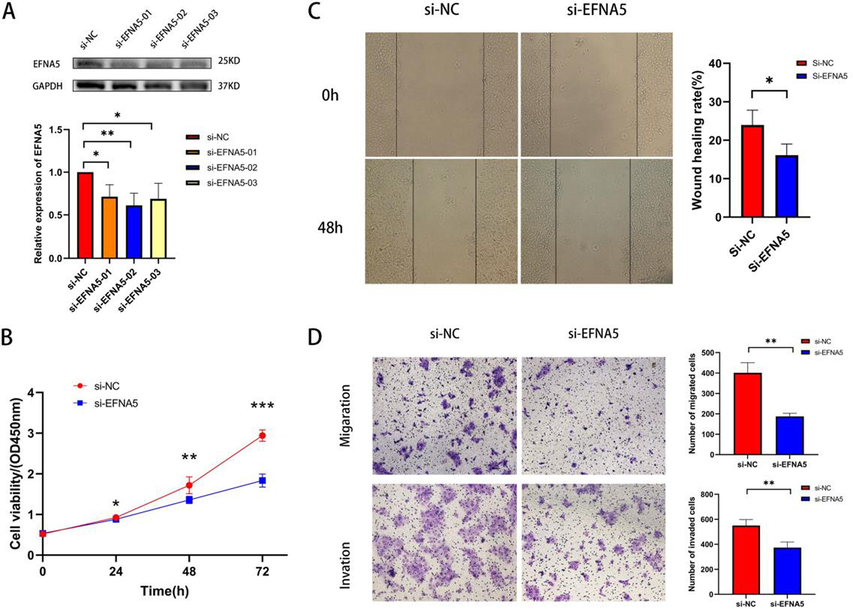
A. Western blot experiment to detect knockdown efficiency. B. CCK8 assay to assess the impact of EFNA5 knockdown on the proliferation ability of BxPC-3 cells. C. Wound healing assay to evaluate the effect of EFNA5 knockdown on the migration ability of BxPC-3 cells. D. Transwell assay to examine the effect of EFNA5 knockdown on the migration and invasion abilities of BxPC-3 cells.
The CCK8 assay was employed to assess the proliferation ability of BxPC-3 cells after EFNA5 knockdown. The results showed that the proliferation of BxPC-3 cells was significantly inhibited after EFNA5 knockdown compared with the si-NC group (24h, p < 0.05; 48h, p < 0.01; 72h, p < 0.001), as shown in Fig. 8-B.
A wound healing assay was conducted to evaluate the effect of EFNA5 knockdown on the migration ability of BxPC-3 cells. The results indicated that the “healing speed” was slower in the si-EFNA5 group compared to the si-NC control group, suggesting that EFNA5 knockdown reduced the migration ability of BxPC-3 cells (p < 0.05), as depicted in Fig. 8-C.
Transwell migration and invasion assays were utilized to assess cell migration and invasion capabilities. The results showed that, compared with the si-NC control group, fewer cells in the si-EFNA5 group passed through the porous membrane (p < 0.01), indicating that EFNA5 knockdown decreased the migration ability of BxPC-3 cells, as shown in Fig. 8-D. Furthermore, compared to the si-NC control group, fewer cells in the si-EFNA5 group passed through both the Matrigel and the porous membrane (p < 0.01), demonstrating that EFNA5 knockdown reduced the invasion ability of BxPC-3 cells as shown in Fig. 8-D.
4 Discussion
Pancreatic cancer often presents with atypical early clinical symptoms, leading patients to seek medical attention due to nonspecific gastrointestinal issues such as vague abdominal pain, jaundice (in cases of pancreatic head cancer), loss of appetite, nausea, and vomiting (Cai et al., 2021). Given the typically short course of pancreatic cancer, by the time noticeable symptoms appear, the disease has often progressed to an advanced stage, leaving 80–90% of patients ineligible for surgery. Additionally, due to the highly malignant nature of pancreatic cancer cells and their resistance to chemotherapy, the prognosis for pancreatic cancer patients is poor, with a 5-year survival rate of less than 10% (Stoffel et al., 2023). Thus, identifying potential biomarkers and therapeutic targets for pancreatic cancer is urgently needed in the diagnosis and treatment of this disease.
In this study, we aimed to analyze the diagnostic and prognostic value of EFNA5 in pancreatic cancer and gradually reveal its role in tumorigenesis and progression. Based on data from the GTEx, TCGA, and GEO databases, we found that the mRNA level of EFNA5 was significantly elevated in pancreatic cancer tissues, which was validated using external datasets (GEO). To confirm whether its protein levels were similarly elevated, we collected 19 pairs of pancreatic cancer tissues from the Second Affiliated Hospital of Zhengzhou University and conducted immunohistochemistry experiments. The results also indicated that EFNA5 protein expression was significantly higher in cancerous tissues compared to adjacent non-cancerous tissues, leading us to conclude that EFNA5 is upregulated in pancreatic cancer (Dolatabadi et al., 2022). To explore whether EFNA5 is associated with prognosis, we performed survival analysis using clinical data from TCGA, revealing that patients with high EFNA5 expression had significantly worse overall survival and progression-free survival than those with low expression (Dolatabadi and Ahmadzadeh, 2023). Univariate and multivariate COX regression analyses showed that EFNA5 is an independent risk factor affecting the prognosis of pancreatic cancer patients, indicating that EFNA5 could be used as a predictor of patient outcomes (Dolatabadi et al., 2023). Taken together, these findings suggest that EFNA5 may function as an oncogene in pancreatic cancer, though further investigation is required to understand how it promotes tumorigenesis and progression.
To elucidate the biological functions of EFNA5 in pancreatic cancer, we first performed functional enrichment analysis. KEGG enrichment analysis indicated that EFNA5 is closely related to signaling pathways such as PI3K/Akt, axon guidance, focal adhesion, and ECM-receptor interaction (Ahmadian et al., 2022). The PI3K/AKT pathway is one of the most frequently mutated pathways in various cancers and plays a crucial role in cell growth, survival, proliferation, metabolism, and motility (He et al., 2021). KRAS mutations, present in over 90% of pancreatic cancers, are considered the main oncogenic driver and therapeutic target in this disease, and they can induce overexpression of mutant PI3KCA, leading to abnormal activation of the PI3K/AKT pathway (Tiemin et al., 2020; Gu et al., 2022). Therefore, it can be speculated that EFNA5 promotes pancreatic cancer development through the PI3K/AKT pathway. Regarding the axon guidance pathway in pancreatic cancer, studies have shown that pancreatic cancer cells can secrete the axon guidance molecule SEMA3D, which, by binding to the receptor PLXND1 on dorsal root ganglia (DRG) cells, increases the neuroinvasive capacity of pancreatic cancer cells. Knocking out SEMA3D in pancreatic cancer cells or blocking PLXND1 on DRG cells with antibodies can reduce invasion capacity (Jurcak et al., 2019). The focal adhesion signaling pathway is composed of multiple pro-survival signaling molecules, including integrins, growth factor receptors, and intracellular molecules such as focal adhesion kinase, which critically regulate cell behavior, influence tumor cell survival, lead to drug resistance, and serve as potential cancer targets (Eke and Cordes, 2015). GO enrichment analysis revealed that differentially expressed genes (DEGs) were mainly associated with functions such as epidermal development, cell adhesion (Eftekhari et al., 2020), and intercellular junctions, which are crucial for tumor progression and metastasis (Livshits et al., 2012; Garcia et al., 2018). GSEA showed that high EFNA5 expression was enriched in pathways related to base excision repair, cell cycle, and drug metabolism, all of which are closely related to tumor formation and progression (Grundy and Parsons, 2020; Michael and Doherty, 2005). In summary, the upregulation of EFNA5 may contribute to the formation and progression of pancreatic cancer by affecting these biological functions, although further studies are needed to confirm whether EFNA5 participates in pancreatic cancer development through these mechanisms.
Immune cells are an important component of the tumor microenvironment, playing a dual role in either inhibiting cancer cell proliferation or promoting apoptosis and necrosis, thereby exerting an anti-tumor effect, or providing a favorable environment for tumor growth, thus promoting cancer progression (Tay et al., 2023). The CIBERSORT algorithm can predict immune cell infiltration in tumor tissues based on transcriptomic data. We used the CIBERSORT algorithm to analyze differences in immune cell infiltration between high and low EFNA5 expression groups. The results showed that the high EFNA5 expression group had higher infiltration levels of M0 macrophages and lower levels of CD8+ T cells and activated CD4+ memory T cells. Correlation analysis revealed a positive correlation between EFNA5 expression and M0 macrophage infiltration levels, and a negative correlation with CD8+ T cells. Previous studies have reported that M0 macrophage expression is elevated in bladder cancer and is closely associated with poor clinical prognosis, although this has not yet been reported in pancreatic cancer. CD8+ T cells are key players in the anti-tumor immune surveillance system, possessing strong cytotoxicity that can directly kill tumor cells (Schreiber et al., 2011). CD4+ T cells have a complex role in anti-tumor immunity (Ostroumov et al., 2018); on one hand, they can exert anti-tumor effects by assisting B cells, NK cells, and CD8+ T cells, while on the other hand, they can also transform into immunosuppressive regulatory T cells (Tregs) that promote tumor growth (Reina-Campos et al., 2021). Therefore, the upregulation of EFNA5 may influence the infiltration of M0 macrophages, CD8+ T cells, and activated CD4+ memory T cells in tumor tissues, thereby altering the tumor immune microenvironment and promoting tumor progression.
Tumor mutational burden (TMB) reflects the extent of mutations in malignant tumors and is clinically associated with better immunotherapy outcomes. After analyzing TMB between high and low EFNA5 expression groups using bioinformatics algorithms, we found that the high EFNA5 expression group had a higher TMB (Huseynov et al., 2024). Therefore, we hypothesize that if immune checkpoint inhibitors are to be used in the future treatment of pancreatic cancer patients, EFNA5 expression levels could be considered as a reference, which might help predict treatment efficacy, though this hypothesis requires validation through clinical research (Jardim et al., 2021).
The “Gemcitabine + Paclitaxel” regimen and the “FOLFIRINOX” regimen are classic first-line chemotherapy options for patients with advanced pancreatic cancer (Tempero et al., 2021). The “FOLFIRINOX” regimen, consisting of 5-fluorouracil, leucovorin, irinotecan, and oxaliplatin, has significantly better median progression-free survival and overall survival compared to the “Gemcitabine + Paclitaxel” regimen (Shroff et al., 2019), though it is associated with greater toxicity and requires higher physical fitness, necessitating a comprehensive consideration of the patient's individual condition when choosing a treatment regimen. To explore whether EFNA5 expression levels influence treatment choice, we analyzed the relationship between EFNA5 and drug sensitivity using the “OncoPredict” package based on the GDSC database. The results showed that the high EFNA5 expression group had lower sensitivity to gemcitabine, paclitaxel, oxaliplatin, and irinotecan, and a trend towards reduced sensitivity to 5-FU, although the difference was not statistically significant. These findings suggest that patients with high EFNA5 expression may have relatively poor therapeutic outcomes when using first-line chemotherapy drugs, and also hint that targeting EFNA5 may help overcome resistance to first-line treatment in pancreatic cancer.
Nevertheless, our study has some limitations. Due to the limited availability of clinical specimens, we were unable to provide more clinical data to validate the relationship between EFNA5 and prognosis. Therefore, more clinical trials are needed to confirm the prognostic value of EFNA5.
5 Conclusion
In summary, EFNA5 mRNA and protein are highly expressed in pancreatic cancer tissues, and high EFNA5 expression is associated with poor prognosis of pancreatic cancer patients. Based on the biosignature algorithm, we found that EFNA5 is involved in the development of pancreatic cancer through multiple mechanisms. Cellular phenotyping experiments showed that knockdown of EFNA5 expression reduced the proliferation, migration, and invasion ability of the pancreatic cancer cell line BxPC-3. Our study demonstrated that EFNA5 is closely associated with pancreatic cancer development, progression, prognosis, immune infiltration, drug sensitivity, and tumour mutational burden. EFNA5 is a potential diagnostic and prognostic marker and therapeutic target.
All authors have participated in (a) conception and design, or analysis and interpretation of the data; (b) drafting the article or revising it critically for important intellectual content; and (c) approval of the final version.
This manuscript has not been submitted to, nor is under review at, another journal or other publishing venue.
The authors have no affiliation with any organization with a direct or indirect financial interest in the subject matter discussed in the manuscript.
Funding
This work was supported by the Department of Science and Technology of Henan Province (Grant No. 232102310355), the Department of Education of Henan Province (Grant No. 23A350010), and the Henan Provincial Health Commission (Grant No. LHGJ20230362).
CRediT authorship contribution statement
Ze Hua and Rongshang Zhao contributed equally to this work. Ze Hua and Rongshang Zhao designed and conducted most of the experiments, analysed and interpreted the data, and edited the manuscript. Wenbo Guan, Siya Liu, Jurui Ge and Yiran Zhang assisted in completing the experiments. Jian Wang, Zhenjie Pan and Suliman Khan directed the experimental design and oversaw the manuscript editing. All authors have read and approved the content of the manuscript and agree to the publication of the manuscript.
Acknowledgements
This study were supported by The Second Affiliated Hospital of Zhengzhou University and the Institute of Clinical Pharmacology, Zhengzhou University.
Declaration of Competing Interest
The authors declare that they have no known competing financial interests or personal relationships that could have appeared to influence the work reported in this paper.
References
- Podocytopathy: The role of actin cytoskeleton[J] Biomed. Pharmacother.. 2022;156:113920
- [Google Scholar]
- Detection of breath acetone by semiconductor metal oxide nanostructures-based gas sensors: A review[J] Mater. Sci. Semicond. Process.. 2022;149:106897
- [Google Scholar]
- CA19-9 and CEA biosensors in pancreatic cancer[J] Clin. Chim. Acta. 2024;554:117788
- [Google Scholar]
- Combined gene expression analysis of whole-tissue and microdissected pancreatic ductal adenocarcinoma identifies genes specifically overexpressed in tumor epithelia[J] Hepatogastroenterology. 2008;55(88):2016-2027.
- [Google Scholar]
- Advances in the epidemiology of pancreatic cancer: Trends, risk factors, screening, and prognosis[J] Cancer Lett.. 2021;520:1-11.
- [Google Scholar]
- CuO/Cu/rGO nanocomposite anodic titania nanotubes for boosted non-enzymatic glucose biosensors[J] New J. Chem.. 2023;47(16):7890-7902.
- [Google Scholar]
- Molecular subtypes of pancreatic cancer[J] Nat. Rev. Gastroenterol. Hepatol.. 2019;16(4):207-220.
- [Google Scholar]
- Ephrin signalling controls brain size by regulating apoptosis of neural progenitors[J] Nature. 2005;435(7046):1244-1250.
- [Google Scholar]
- Catalytic ozonation process using modified activated carbon as a cataly s t for the removal of sarafloxacin antibiotic from aqueous solutions[J] Analytical Methods in Environmental Chemistry Journal. 2023;6(2):31-41.
- [Google Scholar]
- Catalytic ozonation process using ZnO/Fe2O3 nanocomposite for efficient removal of captopril from aqueous solution[J] Analytical Methods in Environmental Chemistry Journal. 2022;5:31-39.
- [Google Scholar]
- Catalytic electrodes’ characterization study serving polluted water treatment: environmental healthcare and ecological risk assessment[J] J. Environ. Sci. Health B. 2023;58(9):594-602.
- [Google Scholar]
- Cell junction proteins: Crossing the glomerular filtration barrier in diabetic nephropathy[J] Int. J. Biol. Macromol.. 2020;148:475-482.
- [Google Scholar]
- Focal adhesion signaling and therapy resistance in cancer[J] Semin. Cancer Biol.. 2015;31:65-75.
- [Google Scholar]
- Garcia M A, Nelson W J, Chavez N. Cell-Cell Junctions Organize Structural and Signaling Networks[J]. Cold Spring Harb Perspect Biol, 2018, 10(4).
- Base excision repair and its implications to cancer therapy[J] Essays Biochem.. 2020;64(5):831-843.
- [Google Scholar]
- Hsa-miR-3178/RhoB/PI3K/Akt, a novel signaling pathway regulates ABC transporters to reverse gemcitabine resistance in pancreatic cancer[J] Mol. Cancer. 2022;21(1):112.
- [Google Scholar]
- Targeting PI3K/Akt signal transduction for cancer therapy[J] Signal Transduct. Target. Ther.. 2021;6(1):425.
- [Google Scholar]
- Novel nanomaterials for hepatobiliary diseases treatment and future perspectives[J]. Advances in Biology & Earth. Sciences. 2024;9(Special Issue):81-91.
- [Google Scholar]
- Eph/Ephrin Signaling in the Tumor Microenvironment[J] Advances in Experimental Medicine and Biology. 2021;1270:45-56.
- [Google Scholar]
- The Challenges of Tumor Mutational Burden as an Immunotherapy Biomarker[J] Cancer Cell. 2021;39(2):154-173.
- [Google Scholar]
- Axon Guidance Molecules Promote Perineural Invasion and Metastasis of Orthotopic Pancreatic Tumors in Mice[J] Gastroenterology. 2019;157(3):838-850.e6.
- [Google Scholar]
- Mechanisms of ephrin-Eph signalling in development, physiology and disease[J] Nat. Rev. Mol. Cell Biol.. 2016;17(4):240-256.
- [Google Scholar]
- MiR-645 promotes invasiveness, metastasis and tumor growth in colorectal cancer by targeting EFNA5[J] Biomed Pharmacother. 2020;125:109889
- [Google Scholar]
- Governing epidermal homeostasis by coupling cell-cell adhesion to integrin and growth factor signaling, proliferation, and apoptosis[J] PNAS. 2012;109(13):4886-4891.
- [Google Scholar]
- Maeser D, Gruener R F, Huang R S. oncoPredict: an R package for predicting in vivo or cancer patient drug response and biomarkers from cell line screening data[J]. Brief Bioinform, 2021, 22(6).
- Tumoral drug metabolism: overview and its implications for cancer therapy[J] J. Clin. Oncol.. 2005;23(1):205-229.
- [Google Scholar]
- Neoadjuvant therapy alters the collagen architecture of pancreatic cancer tissue via Ephrin-A5[J] Br. J. Cancer. 2022;126(4):628-639.
- [Google Scholar]
- Robust enumeration of cell subsets from tissue expression profiles[J] Nat. Methods. 2015;12(5):453-457.
- [Google Scholar]
- CD4 and CD8 T lymphocyte interplay in controlling tumor growth[J] Cell. Mol. Life Sci.. 2018;75(4):689-713.
- [Google Scholar]
- Papadakos S P, Petrogiannopoulos L, Pergaris A, et al. The EPH/Ephrin System in Colorectal Cancer[J]. Int J Mol Sci, 2022, 23(5).
- CD8(+) T cell metabolism in infection and cancer[J] Nat. Rev. Immunol.. 2021;21(11):718-738.
- [Google Scholar]
- Polycomb-mediated repression of EphrinA5 promotes growth and invasion of glioblastoma[J] Oncogene. 2020;39(12):2523-2538.
- [Google Scholar]
- Cancer immunoediting: integrating immunity's roles in cancer suppression and promotion[J] Science. 2011;331(6024):1565-1570.
- [Google Scholar]
- Gemcitabine, Cisplatin, and nab-Paclitaxel for the Treatment of Advanced Biliary Tract Cancers: A Phase 2 Clinical Trial[J] JAMA Oncol.. 2019;5(6):824-830.
- [Google Scholar]
- Lifting the Veil: Characteristics, Clinical Significance, and Application of β-2-Microglobulin as Biomarkers and Its Detection with Biosensors[J] ACS Biomater Sci. Eng.. 2022;8(8):3142-3161.
- [Google Scholar]
- Pancreatic Cancer: Changing Epidemiology and New Approaches to Risk Assessment, Early Detection, and Prevention[J] Gastroenterology. 2023;164(5):752-765.
- [Google Scholar]
- Gene set enrichment analysis: a knowledge-based approach for interpreting genome-wide expression profiles[J] PNAS. 2005;102(43):15545-15550.
- [Google Scholar]
- Tumor-infiltrating regulatory T cells as targets of cancer immunotherapy[J] Cancer Cell. 2023;41(3):450-465.
- [Google Scholar]
- Pancreatic Adenocarcinoma, Version 2.2021, NCCN Clinical Practice Guidelines in Oncology[J] J. Natl. Compr. Canc. Netw.. 2021;19(4):439-457.
- [Google Scholar]
- MUC13 promotes intrahepatic cholangiocarcinoma progression via EGFR/PI3K/AKT pathways[J] J. Hepatol.. 2020;72(4):761-773.
- [Google Scholar]
- PIWIL1 interacting RNA piR-017061 inhibits pancreatic cancer growth via regulating EFNA5[J] Hum. Cell. 2021;34(2):550-563.
- [Google Scholar]
- Yang W, Soares J, Greninger P, et al. Genomics of Drug Sensitivity in Cancer (GDSC): a resource for therapeutic biomarker discovery in cancer cells[J]. Nucleic Acids Res, 2013, 41(Database issue): D955-61.
- Dysregulation of HNF1B/Clusterin axis enhances disease progression in a highly aggressive subset of pancreatic cancer patients[J] Carcinogenesis. 2022;43(12):1198-1210.
- [Google Scholar]
- clusterProfiler: an R package for comparing biological themes among gene clusters[J] OMICS. 2012;16(5):284-287.
- [Google Scholar]
- Overexpression of LINC00607 inhibits cell growth and aggressiveness by regulating the miR-1289/EFNA5 axis in non-small-cell lung cancer[J] Open Med (wars). 2023;18(1):20230649.
- [Google Scholar]


