

Translate this page into:
Biomarkers charge-transfer complexes of melamine with quinol and picric acid: Synthesis, spectroscopic, thermal, kinetic and biological studies
⁎Corresponding author at: Department of Chemistry, Faculty of Science, Taif University, 888 Taif, Saudi Arabia. Tel.: +966 551352497. msrefat@yahoo.com (Moamen S. Refat)
-
Received: ,
Accepted: ,
This article was originally published by Elsevier and was migrated to Scientific Scholar after the change of Publisher.
Peer review under responsibility of King Saud University.

Abstract
Two new melamine (MA) charge transfer complexes with quinol and picric acid in aqua media have been synthesized and structurally characterized. The obtained complexes with the general formula [(MA)(acceptor)2] with a 2:1 acceptor:donor molar ratio. Elemental analysis (CHN), electronic spectra, photometric titration, mid infrared spectra, 1H NMR spectra and thermogravimetric analysis (TG) were used to predict the position of the charge transfer interaction between the donating and accepting sites. The MA CT-complexes were antimicrobial assessment against two kinds of bacterial and fungal species.
Keywords
Charge transfer complexes
Melamine
TG
Biological evaluation

1 Introduction
Melamine (MA; 1,3,5-triazine-2,4,6-triamine) is a kind of triazine analog with three amino groups and it can also be described as a trimer of cyanamide, three cyanamide units joined in a ring. Melamine has the chemical formula C3H6N6 with molecular mass of just over 126, forms a white crystalline powder, and is only slightly soluble in water. It has been widely used as a raw material in the chemical industry. It is commonly used in the production of melamine resins, laminates, glues, adhesives, and combined with formaldehyde in the molding of plastics (Venkatasami and Sowa, 2010). Because of its high nitrogen content (66% nitrogen by mass), melamine shows the analytical characteristics of protein molecules when the Kjeldahl method is used for protein analysis in food (Xiang et al., 2011). Thus, melamine is unethically added to food products to have more protein content than they actually have. Melamine is a toxic compound to both animals and human beings (Lam et al., 2009). Unfortunately, it is possible that melamine accumulates in the body that causes toxicity problems, which may lead to reproductive damages. It has been reported that the combination of melamine with cyanuric acid leads to the formation of insoluble melamine cyanurate crystals (Puschner et al., 2007), causing bladder or kidney stones, which can lead to renal failure (Brown et al., 2007) or bladder cancer (Heck and Tyl, 1985). Recently many young children have suffered from renal stone caused by melamine in the milk powder, and the contamination of milk with melamine in China likely caused 300 000 cases of renal complications in children in 2008, directly resulting from the consumption of tainted product (Mauer et al., 2009; Chan et al., 2008). As a result, governments around the world have enacted regulations that have set maximum acceptable limits for melamine in food products. Consequently, there is a demand for analytical techniques that can reliably monitor melamine in food products.
Currently, several analytical methods have been employed and developed for the determination of melamine in infant formula and milk-based products, including high-performance liquid chromatography (HPLC) (Kim et al., 2008; Sun et al., 2010; He et al., 2008), liquid chromatography/mass spectrometry (LC/MS) (Filigenzi et al., 2007; Ibanez et al., 2009; Sancho et al., 2005; Ehling et al., 2007), gas chromatography (GC) (Yokley et al., 2000), gas chromatography/mass spectrometry (GC/MS) (Li et al., 2009), thin layer chromatography (Rao et al., 2008), capillary electrophoresis (CE) (Tsai et al., 2009; Xia et al., 2010; Cook et al., 2005; Broszat et al., 2008), surface enhanced Raman spectroscopy (Lin et al., 2008), flow injection analysis based on chemiluminescence system (FI-CL) Zeng et al., 2011, electrochemical methods (Cao et al., 2009; Attia et al., 2011; Liu et al., 2011; Ma et al., 2011) and Matrix assisted laser desorption/ionization methods (MALDI) (Singh and Panchagnula, 2011).
Charge transfer (CT) interactions within a molecular complex forming an electron donor and electron acceptor involving a resonance with a transfer of charge from donor to acceptor were showed firstly by Mulliken (Mulliken, 1950, 1952; Mulliken and Pearson, 1969; Gutmann et al., 1997), and discussed widely by Foster (Foster, 1969). Formation of charge transfer complexes (CTC) is based on the interaction of energetically high lying HOMO of the donor with a low energy LUMO of the acceptor. In general, the charge transfer complexation occurs as an ionic band in a simple ion–radical pair interaction (Arslan et al., 2007). Molecular charge transfer materials become an attractive and realistic target for materials science to research for molecular CT systems accompanied with the changes in magnetic, transport optical, dielectrically properties and structural changes. CT complexes, which exhibit interesting optical, electrical and photoelectrical properties, play an important role in many electro physical and optical processes (Bortchagousky et al., 2004).
Charge transfer complexation is currently achieving the great importance in biochemical, bioelectrochemical energy transfer process (Roy et al., 2005), biological systems, and drug–receptor binding mechanism, for examples, drug action, enzyme catalysis, ion transfers through lipophilic membranes (Dozal et al., 2000), and certain π-acceptors have successfully been utilized in pharmaceutical analysis of some drugs in their pure form or in pharmaceutical preparations (Pandeeswaran et al., 2009; Pandeeswaran and Elango, 2010). Recently, many studies have been widely reported about the rapid interactions between different kinds of drugs and related compounds as donors with several types of σ and π-electron acceptors (Refat et al., 2010a,b, 2011b,c; Refat, 2011; Refat and El-Zayat, 2010). On the other hand, electron donor–acceptor (EDA) interaction has a great importance in many application topics and fields, like in non-liner optical materials and electrical conductivities (Yakuphanoglu et al., 2005), second order non-liner optical activity (Krishnamurthy et al., 1988), micro emulsion, surface chemistry (Andrade et al., 2000), photo catalysts (Dabestani et al., 1998), dendrimers (Jakubiak et al., 2000), solar energy storage (Takahasi et al., 1993), organic semiconductors (Eychmuller and Rogach, 2000), as well as in studying redox processes (Brueggermann et al., 1992).
The charge transfer complexes of melamine have not been reported in the literature, therefore the aim of this paper is directed to investigate these complexes. For this purpose, two new CT-complexes formed between melamine (MA) as the donor with quinol (QL) and picric acid (PA) as π-acceptors have been studied spectrophotometrically. These complexes are readily prepared from the reaction of MA with QL and PA in aqua media. The synthesized MA CT-complexes were structurally characterized to interpret the behavior of interactions using IR, 1H NMR, UV–Vis techniques and elemental analyses (CHN). Benesi–Hildebrand and its modification methods were applied for the determination of the spectroscopic physical data such as formation constant (KCT), molar extinction coefficient (εCT), standard free energy (ΔG°), oscillator strength (f), transition dipole moment (μ), resonance energy (RN) and ionization potential (ID). The thermal behavior of the obtained complexes as well as kinetic thermodynamic parameters (E∗, ΔS∗, ΔH∗ and ΔG∗) have also been investigated. Finally, antimicrobial activity of MA complexes was tested against different Gram (+) and Gram (−)bacterial species such as, Staphylococcus aureus (S. aureus), Bacillus subtilis, Escherichia coli (E. coli) and Pseudomonas aeruginosa (P. aeruginosa), and antifungal screening was studied against two species, Aspergillus flavus and Candida albicans.
2 Experimental
2.1 Materials
Pure melamine (MA, MF = C3H6N6), quinol (QL) and picric acid (PA) were obtained from Merck and were used without further purification.
2.2 Synthesis of MA CT-complexes
The solid CT-complexes of MA with QL and PA acceptors were prepared by adding 0.1 mmol of the MA (12.6 mg) to 50 ml boiled water, and the suspension was heated to 100 °C with stirring for 1 h until all MA content dissolved. 0.2 mmol of acceptor dissolved in 10 ml of water was added to the MA solution, and the mixture was then allowed to stir for 30 min. at room temperature. The suspended solid was collected by means of filtration, washed several times with hot water, and then dried under vacuum over anhydrous calcium chloride.
2.3 Photometric titration measurements
The photometric titration measurements were performed for the reactions of the MA donor with QL and PA acceptors at 295 and 354 nm, respectively. A 0.25, 0.50, 0.75, 1.00, 1.50, 2.0, 2.50, 3.00, 3.50 and 4.00 mL aliquots of a standard solution (5.0 × 10⁻⁴ M) of the appropriate acceptor in H2O were added to 1.00 ml of 5.0 × 10⁻⁴ M MA also in H2O. The total volume of the mixture was 5 mL. The concentration of MA ( ) in the reaction mixture was kept fixed at 5.0 × 10⁻⁴ M while the concentration of the π-acceptors ( ) changed over a wide range of concentrations from 0.25 × 10⁻⁴ M to 4.00 × 10⁻⁴ M, to produce solution in each case of donor:acceptor molar reaction varying from 4:1 to 1:4. The stoichiometry of the molecular CT-complexes was determined by the application of the conventional spectrophotometric molar ratio according to the known methods (Skoog, 1985) through the plot of the absorbance of each CT-complex as a function with the ratio of ( ):( ). The modified Benesi–Hildebrand plots were obtained (Benesi and Hildebrand, 1949; Abu-Eittah and Al-Sugeir, 1976) in order to calculate the formation constant, KCT, and the absorptivity, εCT, values for each CT-complex resulted from this study.
2.4 Instrumentation and physical measurements
The electronic absorption spectra of the donor, acceptors and the resulted CT-complexes were recorded in the region of (800–200 nm) by using a Perkin-Elmer Lambda 25 spectrophotometer with a 1 cm quartz cell. The mid infrared spectra (IR) measurements (KBr discs) of the solid CT-complexes were carried out on a Genesis II FT-IR spectrophotometer in the υ = 4000–400 cm−1 range. 1H NMR spectra were obtained on a Bruker DRX-250 spectrometer, operating at 250.13 MHz using a dual 5 mm probe head. The measurements were carried out at ambient temperature using DMSO-d6 as the solvent and TMS as an internal reference. 1H NMR data are expressed in parts per million (ppm), referenced internally to the residual proton impurity in DMSO solvent. Thermogravimetric measurements (TGA) were carried out in the temperature range 25–800 °C in air atmosphere using a Shimadzu TGA – 50H thermal analyzer. The elemental analyses of carbon, hydrogen and nitrogen contents were performed by the microanalysis unit at the Cairo University, Egypt, using a Perkin–Elmer CHN 2400 (USA). The data of the elemental analyses (CHN) of the reaction products, the CT-complexes, were matched with the molar ratio results from the photometric titrations.
2.5 Antimicrobial investigation
Antimicrobial activity of the MA CT-complexes as well as the pure solvent was determined using a modified Bauer–Kirby disc diffusion method (Bauer et al., 1966), against different Gram (+) and Gram (−)bacterial species; S. aureus, B. subtilis, E. coli and P. aeruginosa, and antifungal screening was studied against two species, A. flavus and C. albicans. The microanalysis unit at the Cairo University, Egypt, performed the investigations. For these investigations, briefly, 100 μl of the test bacteria/fungi was grown in 10 ml of fresh media until they reached a count of approximately 108 cells/ml for bacteria or 105 cells/ml for fungi (Pfaller et al., 1988). 100 μl of microbial suspension was spread on agar plates. Isolated colonies of each organism that might be playing a pathogenic role were selected from primary agar plates and tested for susceptibility. After incubation for 48 h, inhibition (sterile) zone diameters (including disc) were measured and expressed in mm. Standard discs of Tetracycline (Antibacterial agent) and Amphotericin B (Antifungal agent) served as positive controls for antimicrobial activity, where filter discs impregnated with 10 μl of DMSO solvent were used as a negative control. The concentration of each solution was 1.0 × 10⁻³ mol dm−3. Commercial DMSO was employed to dissolve the tested samples.
3 Results and discussion
3.1 Elemental analysis
The elemental analysis data (C, H, and N) of the MA CT-complexes were performed and the obtained results are as follows;
[MA (QL)2]; C15H18O4N6; Mol. wt. = 346.22; Calc.: %C, 52.02; %H, 5.20; %N, 24.28, Found: %C, 52.17; %H, 5.12; %N, 24.21.
[MA (PA)2]; C15H12O14N12; Mol. wt. = 584.20; Calc.: %C, 30.82; %H, 2.06; %N, 28.77, Found: %C, 31.06; %H, 2.11; %N, 28.69.
It can be seen that the resulted values agree quite well with the calculated values, and the suggested values are matched with the molar ratio introduced from the photometric titration curves.
3.2 Electronic absorption spectra of the MA/QL and MA/PA complexes
In the case of the MA/QL system, once beginning the addition of QL to a solution of MA in water, the color of the solution changes in four steps until it is constant: colorless → light yellow → pink → red. On the other hand, in the case of the MA/PA system, upon addition of PA to the MA donor dissolved in water, a yellow precipitate was formed immediately. The electronic absorption spectra of the MA, π-acceptors and the resultant charge transfer complexes are shown in Fig. 1. The spectra revealed new strong absorption bands assigned to the CT interaction at 295 and 354 nm for MA/QL and MA/PA complexes, respectively. The photometric titration measurements between MA and the defined acceptors QL and PA in water based on the characteristic absorption bands with reference to the CT-complexes, Fig. 2), proved that the molar ratio of the resultant complexes is 1:2 donor:acceptor. The formation of 1:2 complexes was supported by both elemental analysis and thermal measurements. It was necessary to calculate the values of the equilibrium constant (K) and the extinction coefficient (ε) of the MA complexes. For this purpose, the 1:2 modified Benesi–Hildebrand equation was used in the calculations;

Electronic absorption spectra of MA CT-complexes coupled with titration spectra of each system at the detectable peak.
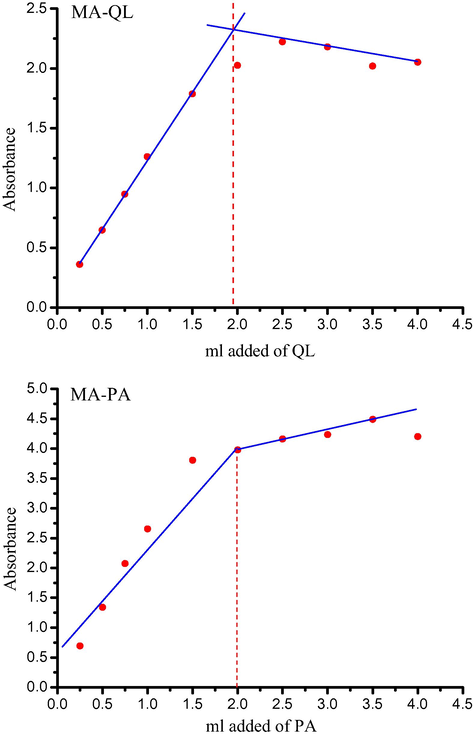
Photometric titration curves for MA/QL and MA/PA systems at detectable peaks of 295 and 354 nm, respectively.
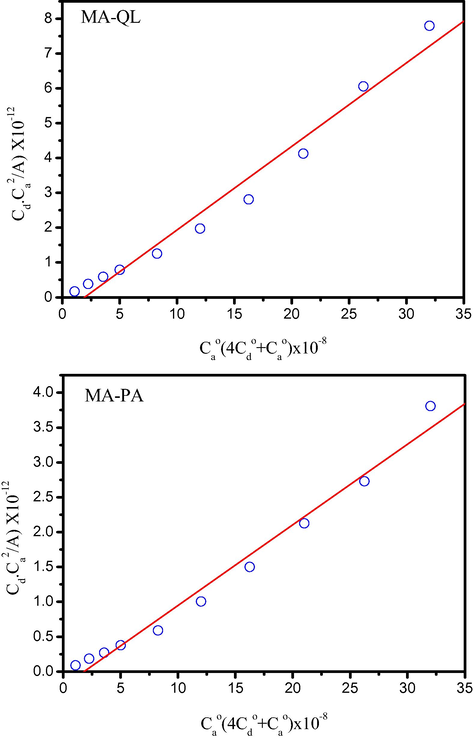
The modified Benesi–Hildebrand plots of MA/QL and MA/PA systems at detectable peaks of 295 and 354 nm, respectively.
The values of both K and ε associated with these complexes are given in Table 1. The data resulted (Table 1) show that the MA/QL and MA/PA systems give high values of both formation constant (KCT) and molar absorptivity (εCT). The high values of both K and ε of the resultant CT-complexes caused high stabilities of the formed CT-complexes to be expected as a result of the expected high donation of the MA nucleus. The value of ε for [MA (QL)2] is about twice higher than that of [MA (PA)2].
Complex
λmax (nm)
ECT (eV)
K (L mol−1)
εmax (L mol−1 cm−1)
f
μ
Ip
D
RN
ΔG° (25 °C) (kJ mol−1)
MA/QL
295
4.22
5.18 × 10⁷
4.17 × 10⁴
60.04
61.35
10.95
32.70
0.79
44,013
MA/PA
354
3.52
5.57 × 10⁷
8.65 × 10⁴
37.34
53.00
10.08
32.70
0.80
44,192
3.3 Determination of the spectroscopic and physical data of the MA CT-complexes
The spectroscopic and physical data such as standard free energy (ΔG°), oscillator strength (f), transition dipole moment (μ), resonance energy (RN), and ionization potential (IP), were estimated in water at 25 °C. The calculations can be summarized as follows;
The oscillator strength (f), which is a dimensionless quantity used to express the transition probability of the CT band, can be estimated by using the approximate formula (Tsubomura and Lang, 1964);
3.4 IR and 1H NMR spectra
Infrared spectral studies shed light on the place of donation in donor species and the differences occur in the spectra of both QL and PA charge transfer complexes. The full infrared absorption bands of MA charge transfer complexes are recorded in Tables 2 and 3. The band assignments between 4000 and 400 cm−1 show the main characteristic absorption bands of the NH3+ group. For example the ν(NH), νdef(NH3+), δsym(NH3+) and ρ(NH3+) vibration of [MA (QL)2] complex occurs at about 3260, 1500, 1350 and 830 cm−1, respectively. The corresponding values for [MA (PA)2] complex are 3150, 1560, 1330 and 740 cm−1, respectively. The presence of these bands confirmed the proton transfer phenomena from the acidic center of each acceptor to the lone pair of electron of the —NH2 group to form NH3+ ammonium ion upon complexation (Refat et al., 2011a). Also, the values characteristic of both —OH and the —NH2 groups happened to shift to lower values and also decreased for the intensities of vibration motions, which indicates the interactions placed among the —OH group of each of QL and PA and the —NH2 group of MA through the hydrogen bonding (region 3000–2000 cm−1). There is some small changes in comparison between the spectra of the CT-complexes, those of the reactants, could also be notable from the expected changes in the symmetry, and electronic configurations of both reactants upon charge transfer complexation. According to these observations, the suggested structures of MA/QL and MA/PA complexes are presented in Formula 1 and 2, respectively. s, strong; w, weak; m, medium; sh, shoulder; v, very; vs very strong; br, broad. ν, stretching; νs, symmetrical stretching; νas, asymmetrical stretching; δ, bending. s, strong; w, weak; m, medium; sh, shoulder; v, very; vs very strong; br, broad. ν, stretching; νs, symmetrical stretching; νas, asymmetrical stretching; δ, bending.
MA
QL
Complex [MA (QL)2]
Assignments
3470 s
3262 br
3261 s, br
ν(N—H); MA, complex
3420 s
ν(O—H); QL, complex
3334 s
3134 vs
–
3031 m
3031 s
ν(C—H); aromatic rings
2831 w
2857 m
2720 m
νs(C—H) + νas(C—H); QL, complex
2685 w
2836 m
2607 m
2716 m
2203 w
2590 w
2362 ms
ν(C⚌N); MA
2467 vw
2337 m, sh
Hydrogen bonding
–
1866 m
1859 w
Overtone of δ(C—H)
1855 m
1666 vs
1628 w
1515 vs
δ(N—H); MA, complex
1641 sh, s
1609 w
δ(NH3+)def, complex
1532 vs, br
ν(C⚌C) (in-ring), aromatic; QL
–
1518 vs
–
ν(C⚌O) + ν(C⚌C); QL
1470 vs
1477 vs
1472 vs
ν(C⚌N); MA
1442 vs
ν(C⚌C) (in-ring), aromatic; QL
–
1366 ms
1352 ms
δ(NH3+)sym, complex ν(C—C) + ν(C—O)
1200 m
1244 vs
1210 s
ν(C—N); MA, complex
1031 ms
1222 vs
1097 m
ν(C—O); QL
1210 vs
–
1164 ms
–
CH, in plane bend; QL
1097 m
814 s
827 s
829 s
ρ(NH3+), complex
773 m
N—H wag
736 m
–
759 vs
761 s
C—H out of plane bending
693 m
616 ms
616 m
613 m
N—H wag
580 ms
525 ms
519 m
CH out of plane bend
494 ms, br
Skeletal vibrations
MA
PA
Complex [MA (PA)2]
Assignments
3470 s
3416 br
3574 m
ν(N—H); MA, complex
3420 s
3419 s, sh
ν(O—H); PA, complex
3334 s
3375 s
3134 vs
3255 m s, br
3157 ms, br
–
3103 ms
–
ν(C—H); aromatic rings; PA
2831 w
2980 sh
–
νs(C—H) + νas(C—H); PA
2685 w
2872 w
–
2203 w
–
2363 m
ν(C⚌N); MA
2338 m, sh
Hydrogen bonding
–
1861 ms
–
νas(NO2); PA
1666 vs
1632 vs
1646 vs
δ(N—H); MA, complex
1641 sh, s
1608 vs
1605 s, sh
δ(NH3+)def, complex
1532 vs br
1564 vs
ν(C⚌O) + ν(C⚌N)
1546 s, sh
–
1529 vs
1495 ms
ν(C⚌C), (in-ring) aromatic
ν(C⚌O) + ν(C⚌C)
1470 vs
1432 s
1428 m
ν(C⚌N); MA
1442 vs
ν(C—C) (in-ting), aromatic
–
1343 ms
1365 ms
ν(C—C) + ν(C—O)
1312 w
1332 vs
δ(NH3+)sym, complex ν
1271 s
sNO2
νas(C—N)
1200 m
1263 w
1194 w
ν(C—N); MA, complex
1031 ms
1150 ms
1162 ms
CH, in plane bend
–
1086 s
1081 ms
ν(C—O)
νs(C—N)
814 s
917 vs
980 mw
N—H wag
773 m
936 w
δ(C—H) in plane bending
736 m
912 mw
–
829 w
818 w
δrock, CH2 rock skeletal vibrations
C—H out of plane bending
–
781 s
786 ms
C—H out of plane bending
732 s
744 m
ρ(NH3+), complex
703 s
711 ms
Skeletal vibration
616 ms
652 sh
615 mw
N—H wag
580 ms
522 ms
546 w
CH out of plane bend
494 ms, br
522 w
Skeletal vibrations
δ(ONO); PA
![Suggested structure of [MA (QL)2] complex.](/content/184/2017/10/2_suppl/img/10.1016_j.arabjc.2014.02.012-fig4.png)
Suggested structure of [MA (QL)2] complex.
![Suggested structure of [MA (PA)2] complex.](/content/184/2017/10/2_suppl/img/10.1016_j.arabjc.2014.02.012-fig5.png)
Suggested structure of [MA (PA)2] complex.
1H NMR (DMSO-d6, δ ppm) data for symmetrical 6-amino-1,3,5-triazine-2,4-diaminium-4-hydroxyphenolate is δ = 4.70–4.76 (s, 6H, 2NH3+), 7.70 (s, 2H, NH2), 7.83 (d, 4H, 2(Ar—H, C-2, C-6)), 8.25 (d, 4H, 2(Ar—H, C-3, C-5)), 8.75 (s, 2H, Ar—OH, phenolic protons). The 1H NMR of melamine with quinol revealed 5 different bands at; δ = 4.70–4.76 which attributed to the ammonium ion protons which are more deshielded, δ = 7.70 for the NH2 protons which becomes more deshielded due to the presence of two ammonium groups attached to the ring, δ = 7.83 attributed for the quinol aromatic protons at C-2 and C-6 are more shielded due to their location ortho to the negative oxygen, while the band at δ = 8.25 attributed to aromatic protons at C-3, and C-5 are ortho to the phenolic groups and considered more deshielded than the previous one, and the band at δ = 8.75 is attributed to the phenolic protons of quinol. The reaction was expected to carry out through the 1:3 melamine to quinol, ratio but experimentally it was found that the reaction was carried out through the 1:2 melamine to quinol, ratio and this may be attributed to the fact that the formation of two ammonium ions attached to the ring decreases the ionic strength of the lone pair of electron of the third amino group and let them more delocalized and tends to be resonating to the triazine ring.
The reaction of MA as donor with PA as acceptor gave a new charge transfer complex named by 6-amino-1,3,5-triazine-2,4-diaminium-2,4,6-trinitrophenolate (Formula 2). 1H NMR (DMSO-d6, δ ppm): δ = 5.16 (s, 6H, 2NH3+), 7.65 (s, 2H, NH2), 8.10 (s, 2H, 2Ar—H, picrate protons). The presence of three nitro groups in the CT-complex led to the down field shift for the NH3+ band that appeared in the 1H NMR if compared to the quinol complex and this attributed to the withdrawing effect of these nitro groups. In addition, the ratio of the complex formation 1:2 melamine to picric acid was attributed to the same reason mentioned above.
3.5 Thermal analysis and kinetic measurements
The thermo analytical results of two MA complexes are listed in Table 4. The kinetic thermodynamic diagrams of the released MA CT-complexes of both QL and PA acceptors during the non-isothermal process (ΔT ≠ 0) heating in air atmospheres are shown in Fig. 4. The TG-DTG curve of MA-QL complex shows mass loss in three weak steps between 63 and 134 °C, 191 and 275 °C, 346 and 571 °C corresponding to endothermic peaks at 95 °C, 233 °C, and 476 °C, attributed to the fusion and evaporation of two molecules of 1,4-dihydroxybenzene (QL) then melamine moiety, respectively. The total mass loss found is 78.935% with few carbon atoms remaining as a final residual. For the [MA (PA)2] charge transfer complex, the TG-DTG curve in O2 atmosphere shows mass loss in three steps one of them has sharp event and thermal events corresponding to these losses or due to physical nature. The first mass loss between 247 and 349 °C, corresponding to an endothermic peak at 326 °C with mass loss 23.201% is due to decomposition of first picric acid molecule. The second stage of endothermic peak at 358 °C with mass loss 38.254% in TG curve is due to fusion of second picric acid molecule. In case of MA-PA charge transfer complex, it is thermally stable up to 247 °C and above this temperature, the mass loss exhibited between 349–393 °C and 393–707 °C with weight loss of 38.254% and 33.951%, corresponding to endothermic peaks at 358 °C and 576 °C attributed to the decomposition of picric acid and melamine molecules accompanied by carbonaceous residue.
Samples
Stage
TG results temp. peak (°C)
Max. temp. (°C)
Weight loss (%)
Evolved moiety
MA/QL
I
63–134
95
27.218
2QL + MA
(C15H18N6O4)
II
191–275
233
38.579
III
346–571
476
13.138
MA/PA
I
247–349
326
23.201
2PA + MA
(C15H12N12O14)
II
349–393
358
38.254
III
393–707
576
33.951
![Plots of Coats–Redfern (CR) and Horowitz–Metzger (HM) relations for [MA (QL)2] and [MA (PA)2] charge transfer complexes.](/content/184/2017/10/2_suppl/img/10.1016_j.arabjc.2014.02.012-fig6.png)
Plots of Coats–Redfern (CR) and Horowitz–Metzger (HM) relations for [MA (QL)2] and [MA (PA)2] charge transfer complexes.
The thermodynamic parameters of decomposition processes of both QL and PA melamine charge transfer complexes, called, activation energy (Ea), enthalpy (ΔH∗), entropy (ΔS∗), and Gibbs free energy change of (ΔG∗) were evaluated graphically by employing the Coats–Redfern and Horowitz–Metzger methods (Coats and Redfern, 1964; Horowitz and Metzger, 1963). These methods are integral methods assuming various orders of reaction and comparing the linearity in each case to select the correct order by using;
3.5.1 Coats–Redfern equation
3.5.2 Horowitz–Metzger equation
A plot of ln [−ln (1 − α)] against Θ, was found to be linear, from the slope of which E, was calculated and Z can be deduced from the relation:
The kinetic data obtained from the non-isothermal decomposition of the complexes are given in Table 5. The activation energy of the complexes is expected to increase with increasing thermal stability of complexes. Hence, the ΔE∗ value in the main stages for the [MA (PA)2] complex is higher than [MA (QL)2] complex. The calculated ΔE∗ values using Coats–Redfern and Horowitz–Metzger methods for the main decomposition stage of the complexes are found to be Ea [MA (PA)2] = 375.5 kJ mol−1 > Ea [MA (QL)2] = 51.55 kJ mol−1. The negative values of ΔS∗ seen in Table 5, indicate that the reaction rates are slower than normal (Frost and Pearson, 1961). Furthermore, these data indicate that the activated complexes have more ordered structure than the reactants.
Complexes
Stage
Method
Parameters a
r
E∗
A
ΔS∗
ΔH∗
ΔG∗
[MA (QL)2]
1st
CR
4.81E+04
1.89E+02
−2.06E+02
4.37E+04
1.53E+05
0.9932
HM
5.50E+04
1.62E+03
−1.88E+02
5.06E+04
1.50E+05
0.9889
[MA (PA)2]
1st
CR
1.49E+05
1.60E+10
−5.57E+01
1.43E+05
1.78E+05
0.9976
HM
6.02E+05
7.66E+48
−6.85E+02
5.97E+05
1.68E+05
0.9935
3.6 Scanning (SEM) and transmission (TEM) electron microscopy
Scanning and transmission electron microscopy techniques give a general perception about microstructure, surface morphology, particle size and chemical composition of the respective picric acid and 1,4-dihydroxybenzene melamine charge transfer, [MA (PA)2] and [MA (QL)2] complexes. Figs. 5–7 designed the SEM and TEM photographs of the QL and PA CT-complexes. The uniformity and similarity between the particle forms of synthesized melamine complexes indicate that the existence of morphological phases of QL and PA complexes have a homogeneous matrix. A homogeneous phase formation of [MA (QL)2] complex having ice, crack morphologies in the form of a dispersed with particle size 0.6 μm is exhibited in Fig. 5. The picric acid melamine CT-complex has a single-phase formation of straight bundle of sticks with particle size 2.5 μm, Fig. 6. The [MA (QL)2] charge transfer complex nanoparticles were characterized with TEM technique. Transmission electron microscopy studies of [MA (QL)2] nanoparticles were carried out to understand the shape and size of particles. The transmission electron photography for the nanoparticles of QL complex obtained in a neutral aqueous media with about 100 nm in diameter with spherical shape is shown in Fig. 7.![SEM image of [MA (QL)2] complex.](/content/184/2017/10/2_suppl/img/10.1016_j.arabjc.2014.02.012-fig7.png)
SEM image of [MA (QL)2] complex.
![SEM image of [MA (PA)2] complex.](/content/184/2017/10/2_suppl/img/10.1016_j.arabjc.2014.02.012-fig8.png)
SEM image of [MA (PA)2] complex.
![TEM image of [MA (QL)2] complex in aqueous media.](/content/184/2017/10/2_suppl/img/10.1016_j.arabjc.2014.02.012-fig9.png)
TEM image of [MA (QL)2] complex in aqueous media.
3.7 Biological assessments
Biological assessments were observed in terms of antimicrobial activities of target MA charge transfer complexes against Gram-positive (B. subtilis and S. aureus) and Gram-negative (E. coli and P. aeruginosa) bacterial species and two strains of fungus (A. flavus and C. albicans). Results from the agar disc diffusion tests for antimicrobial activities of target complexes are presented in Table 6, and illustrated in Fig. 8. G: Gram reaction.
Sample
Inhibition zone diameter (mm/mg sample)
Bacteria
Fungi
Bacillus subtilis, (G+)
Escherichia coli, (G−)
Pseudomonas aeruginosa, (G−)
Staphylococcus aureus, (G+)
Aspergillus flavus
Candida albicans
Control: DMSO
0.0
0.0
0.0
0.0
0.0
0.0
Standard
Tetracycline (Antibacterial agent)
34.0
32.0
34.0
30.0
–
–
Amphotericin B (Antifungal agent)
–
–
–
–
18.0
19.0
[MA (QL)2]
22.0
11.0
8.0
28.0
25.0
12.0
[MA (PA)2]
9.0
14.0
5.0
19.0
11.0
7.0
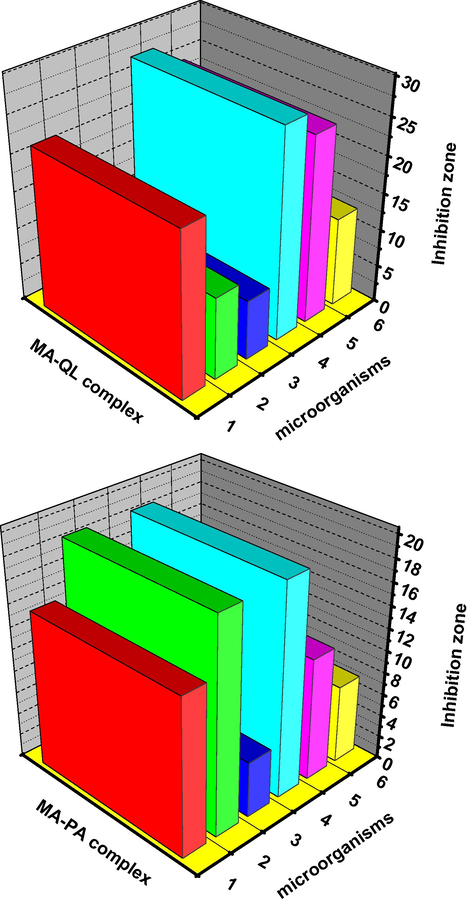
Inhabitation zone diameter of melamine CT-complexes toward some kind of bacteria and fungi; 1, B. subtilis; 2, E. coli; 3, P. aeruginosa; 4, S. aureus; 5, Aspergillus flavus and 6, Candida albicans.
Both [MA (QL)2] and [MA (PA)2] tested charge transfer complexes displayed a different degree of antimicrobial effect that [MA (QL)2] in nano spherical shape displayed a degree of antimicrobial activities greater than [MA (PA)2] against all organisms tested with bacteria of gram (G+) and gram (G−) types and A. flavus fungus strain. Regarding the inhibition zone diameter, [MA (QL)2] complex in nano type has the highest antimicrobial activity against all target organisms compared to other [MA (PA)2] tested complex. In addition, [MA (QL)2] complex in nano type gained approximately 65% of activity of antibacterial agent (Tetracycline) and Antifungal agent (Amphotericin B). The biomarker activity of [MA (QL)2] complex in nano type may be due to the outer membrane of all target organisms (bacteria or fungus) more permeable for [MA (QL)2] complex in nano type structure. The most reasons for lethal action of tested compounds may be due to their interactions with critical interacellular sites causing the death of cells. The variety of antimicrobial activities of tested compounds may be due to a different degree of tested complexes penetration through cell membrane structure of target organism. In conclusion, the interactions between the melamine and 1,4-dihydroxybenzene (QL) acceptor in nano-structural form result in the development of the effectiveness of biological characters of melamine antibiotics.
References
- Can. J. Chem.. 1976;54:3705.
- J. Chem. Soc. Faraday Trans.. 1972;69:534.
- J. Colloid Interface Sci.. 2000;226:260.
- Opt. Mater.. 2007;29:516.
- Talanta. 2011;84:27.
- Am. J. Clin. Pathol.. 1966;45:493.
- J. Am. Chem. Soc.. 1949;71:2703.
- Thin Solid Films. 2004;460:269.
- Z. Angew. Chem.. 1960;72:401.
- Z. Angew. Chem.. 1964;76:326.
- Z. Physikchem. Frankfurt. 1960;24:237.
- M. Broszat, R. Brämer, B. Spangenberg, J. Planar Chromatogr. – Mod. TLC 21 (2008) 469.
- J. Vet. Diagn. Invest.. 2007;19:525.
- J. Phys. Chem.. 1992;96:4405.
- Talanta. 2009;80:484.
- Lancet. 2008;372:1444.
- Nature. 1964;201:68.
- Electrophoresis. 2005;26:1576.
- J. Photochem. Photobiol. A. 1998;117:223.
- Int. J. Antimicrob. Agent. 2000;14:261.
- Food Addit. Contam.. 2007;24:1319.
- Pure Appl. Chem.. 2000;72:179.
- Rapid Commun. Mass Spectrom.. 2007;21:4027.
- Charge Transfer Complexes. London: Academic press; 1969.
- Kinetics and Mechanism. New York, NY, USA: Wiley; 1961.
- Charge Transfer Complexes in Biological Systems. New York: Marcel Dekker Publishing Company; 1997.
- Chin. J. Chromatogr.. 2008;26:752.
- Regul. Toxicol. Pharmacol.. 1985;5:294.
- Anal. Chem.. 1963;35:1464.
- Anal. Chim. Acta. 2009;649:91.
- Synth. Met.. 2000;114:61.
- J. AOAC Int.. 2008;91:408.
- Indian J. Chem.
- Clin. Chim. Acta. 2009;402:150.
- J. Chromatogr. A. 2009;1216:5467.
- J. Food Sci.. 2008;73:1129.
- Analyst. 2011;136:374.
- Analyst. 2011;136:4192.
- Physical Pharmacy (third ed.). Philadelphia, PA: Lee and Febiger; 1969. p. 344
- J. Agric. Food Chem.. 2009;57:3974.
- J. Am. Chem. Soc.. 1950;72:600.
- J. Am. Chem. Soc.. 1952;74:811.
- Molecular Complexes. New York: Wiley Publishers; 1969.
- Spectrochim. Acta A. 2010;75:1462.
- Int. J. Chem. Kinet.. 2009;41:787.
- J. Clin. Microbiol.. 1988;26:1437.
- J. Vet. Diagn. Invest.. 2007;19:616.
- Chin. J. Chromatogr.. 2008;26:755.
- J. Am. Chem. Soc.. 1997;119:9393.
- J. Mol. Struct.. 2011;985:380.
- Bull. Korean Chem. Soc.. 2010;31(6):1535.
- J. Mol. Struct.. 2010;980:124.
- J. Mol. Struct.. 2011;995:116.
- Spectrochim. Acta A. 2011;78:1356.
- J. Mol. Struct.. 2011;990:217.
- Spectrochim. Acta A. 2005;61:2017.
- Anal. Chim. Acta. 2005;530:237.
- Anal. Methods. 2011;3:2360.
- Principle of Instrumental Analysis (third ed.). New York, USA: Saunders; 1985. (Chapter 7)
- Food Control. 2010;21:686.
- Bull. Chem. Soc. Jpn.. 1993;66:733.
- J. Chromatogr. A. 2009;1216:8296.
- J. Am. Chem. Soc.. 1964;86:3930.
- Anal. Chim. Acta. 2010;665:227.
- Food Control. 2010;21:912.
- Analyst. 2011;136:2837.
- Sol. Energy. 2005;79:96.
- J. Agric. Food Chem.. 2000;48:3352.
- Food Chem.. 2011;127:842.


