Translate this page into:
Biosynthesis of silver and gold nanoparticles using Sargassum horneri extract as catalyst for industrial dye degradation
⁎Corresponding authors. sundeng99@pusan.ac.kr (Sun Young Park), gtpark@pusan.ac.kr (Geuntae Park), ojw@pusan.ac.kr (Jin-Woo Oh)
-
Received: ,
Accepted: ,
This article was originally published by Elsevier and was migrated to Scientific Scholar after the change of Publisher.
Peer review under responsibility of King Saud University.
Abstract
This study focuses on the green synthesis of silver and gold nanoparticles using the marine algae extract, Sargassum horneri, as well as the degradation of organic dyes using biosynthesized nanoparticles as catalysts. The phytochemicals of the brown algae Sargassum horneri acted as reducing and capping agents for nanoparticle synthesis. Ultraviolet–visible absorption spectroscopy, dynamic light scattering, high-resolution transmission electron microscopy, selected area electron diffraction, energy dispersive X-ray spectroscopy, X-ray powder diffraction, and Fourier transform infrared spectroscopy were used to characterize the biosynthesized nanoparticles. The green-synthesized SH-AgNPs and SH-AuNPs exhibited high catalytic activity for degradation of organic dyes, such as methylene blue, rhodamine B, and methyl orange. The reduction reactions of dyes are based on pseudo-first-order kinetics.
Keywords
Green synthesis
Silver nanoparticles
Gold nanoparticles
Sargassum horneri
Catalytic activity
Dye degradation
- NPs
-
nanoparticles
- AgNPs
-
silver nanoparticles
- AuNPs
-
gold nanoparticles
- SH
-
Sargassum horneri
- UV-Vis
-
ultraviolet-visible spectroscopy
- DLS
-
dynamic light scattering
- HRTEM
-
high-resolution transmission electron microscopy
- SAED
-
selected area electron diffraction
- EDX
-
energy-dispersive X-ray spectroscopy
- XRD
-
X-ray powder diffraction
- FTIR
-
Fourier transform infrared spectroscopy
- MB
-
methylene blue
- RB
-
rhodamine B
- MO
-
methyl orange
Abbreviations
1 Introduction
Dyes are used in a wide variety of industries, including textiles, cosmetics, pharmaceuticals, food, and plastics. Each year, several hundred thousand tons of dyes are produced, and over 10% of this ends up in water systems as wastewater (Angelova et al., 2016), resulting in water pollution. Exposure of the natural environment to these synthetic dyes is hazardous due to their toxic, mutagenic, and carcinogenic properties (Tabrizi Hafez Moghaddas et al., 2020). Therefore, it is critical to properly decompose and safely dispose of the dyes after use. Among the existing methods for removing dyes from industrial wastewater are biological (adsorption by microbial biomass, algae degradation, and aerobic-anaerobic combination), chemical (oxidation, ozonation, electrochemical destruction, and photochemical), and physical (ion exchange, membrane filtration, reverse osmosis, nanofiltration, and ultrafiltration) methods. However, these technologies have a number of disadvantages, including the formation of hazardous by-products, high costs, operational difficulties, high energy requirements, and secondary pollution of the environment (Katheresan et al., 2018; Gupta and Suhas, 2009).
Many studies in recent years have reported the degradation of dyes using transition metals or their oxide nanoparticles with excellent catalytic ability, indicating that photocatalytic decomposition is environmentally friendly and does not produce secondary pollution (Rafiq et al., 2021; Liu et al., 2021; Ajmal et al., 2014; Marimuthu et al., 2020; Reddy et al., 2019). Nanoparticles with a high surface area ratio exhibit unique physical, chemical, and optical properties. Therefore, nanoparticles are used in a variety of applications such as electronics, optoelectronics, optics, electrochemistry, biomedical, food, textiles, catalysts, sensors, energy, and the environment (Dhand et al., 2015). Physical, chemical, and mechanical methods are commonly used to synthesize NPs. These synthesis methods, however, are time-, money-, and energy-intensive, and require the use of toxic chemicals (Ealia and Saravanakumar, 2017). Many studies on the green synthesis of nanoparticles with antibacterial, anticancer, antioxidant, and photocatalytic activities have been published to overcome these drawbacks. The biosynthesis of NPs using plant extracts and microorganisms is both cost-effective and eco-friendly, as they act as reducing and capping agents (Rambabu et al., 2021; Kumar et al., 2016; Bonigala et al., 2018; Umamaheswari et al., 2018; Ping et al., 2018; Choudhary et al., 2018; Thomas et al., 2019). Furthermore, the absence of toxic chemicals has increased their use in a variety of fields (Roy et al., 2013; Nadaroğlu et al., 2017; Bibi et al., 2019).
Marine algae are a rich source of dietary fiber, minerals, and vitamins, which are used in traditional medicine in East Asia, as well as a versatile and savory food to maintain good health. Sargassum horneri (SH) is an ocean current-floating species found in Korea, Japan, China, and the eastern Pacific Ocean. SH is easy to obtain due to its abundance and rapid growth rate (Kim et al., 2018; Umezaki, 1984; Hu et al., 2019). SH is a brown alga that contains high levels of polyphenols, polysaccharides, and chromene compounds. It has a variety of biological and physiological properties, including antioxidant, anti-allergic, anti-inflammatory, anti-cancer, anti-coagulant, and anti-tumor properties (Herath et al., 2021; Shao et al., 2014). An earlier study found that a hot water extract of SH has antiviral activity (Preeprame et al., 2001). SH’s properties can be used in a variety of fields, including functional foods, cosmetics, and pharmaceuticals.
In this study, SH was used to synthesize Ag and Au nanoparticles. Ultraviolet–visible spectroscopy (UV–Vis), dynamic light scattering (DLS), high-resolution transmission electron microscopy (HRTEM), selected area electron diffraction (SAED), energy-dispersive X-ray spectroscopy (EDS), X-ray powder diffraction (XRD), and Fourier transform infrared spectroscopy (FTIR) were used to characterize the biosynthesized nanoparticles. The catalytic activity of nanoparticles was studied using the three dyes (methylene blue, rhodamine B, and methyl orange) that are widely used in the dye industry.
2 Materials and methods
2.1 Chemicals and reagents
JEJU TECHNOPARK Inc. (Jeju, Korea) provided the S. horneri extract. The following items were purchased from Sigma-Aldrich (St. Louis, MO): silver nitrate, AgNO3, hydrogen tetrachloroaurate (III) trihydrate, HAuCl4·3H2O, methylene blue (MB), rhodamine B (RB), methyl orange (MO), and sodium borohydride (NaBH4).
2.2 Preparation of Sargassum horneri extract
The SH extract was obtained from Jeju Island in Korea’s Jeju Province. Using an electric mixer, SH was dehydrated and uniformed into a fine powder (HMF-3100S, Hanil Electric, Seoul, Korea). To prepare SH solution, the powder was dissolved in 80% ethanol at room temperature. The solution was filtered and concentrated using a rotary vacuum evaporator (Buchi Rotavapor R-144, Buchi Labortechnik, Flawil, Switzerland) and 50 mL of SH was freeze-dried. The powder was preserved at −75 °C until it was needed. Algae powder was dissolved in an aqueous solution at a concentration of 4 mg/mL for the synthesis of NPs. The solution was then filtered and sterilized with a 0.2 µm syringe filter.
2.3 Green synthesis procedure of AgNPs and AuNPs
The concentration, temperature, and reaction time of the SH extract and metal precursor were optimized to synthesize AgNPs and AuNPs. First, 1 µL of AgNO3 (1 M) aqueous solution was added to 1 mL of the filtered SH extract (2 mg/mL) and incubated for 15 min at 80 °C in water. After 15 min, the tubes containing the colloid were placed on ice for 5 min. The color of the suspensions changed to dark orange, indicating that the synthesis of SH-AgNPs was successful. Similarly, 1 mL of filtered SH extract (2 mg/mL) was added to 1 µL of HAuCl4·3H2O (1 M) solution for the synthesis of SH-AuNPs. The transformation of the color of the suspension to dark purple confirmed the successful synthesis of SH-AuNPs (Fig. 1).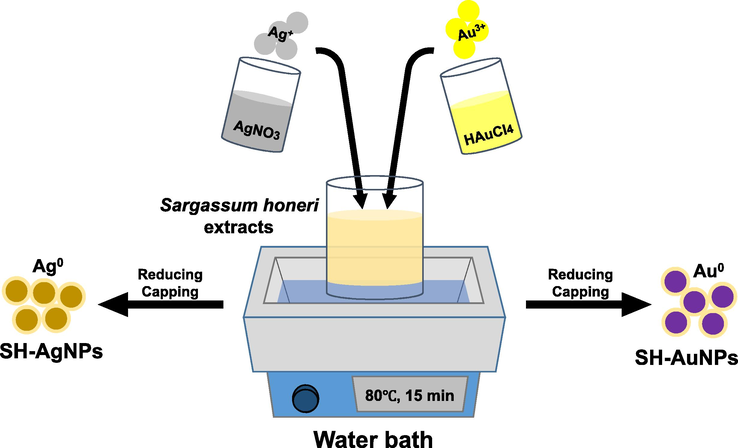
Schematic diagram of green-synthesis of AgNPs and AuNPs.
2.4 Characterization of SH-AgNPs and SH-AuNPs
The formation of biosynthesized NPs using SH was recorded using an Ultrospec 6300 pro UV–Vis spectrophotometer (Amersham Biosciences, Buckinghamshire, UK) operating in the 300–800 nm wavelength range. A Zetasizer Nano-ZS90 (Malvern Panalytical, Malvern, UK) was used to analyze the size and zeta potential of the NPs. HRTEM (TALOS F200X (Thermo Scientific, Oregon, USA) with EDX) operating at a potential of 200 kV was used to determine the morphology and particle size distribution of the NPs. The AgNPs and AuNPs were immobilized on a Formvar/Carbon 200 mesh (Electron Microscopy Sciences, Oregon, USA) copper grid. The structural information of the NPs was determined using an X-ray diffractometer, X’Pert3 Powder (XRD Empyrean series 2, PANalytical, Almelo, Netherlands). The XRD patterns and crystal structures were investigated by X-ray diffraction using Cu Kα radiation (1.540 Å) at 40 kV and 30 mA over a 2θ range of 20–80°. The FTIR spectra of the NPs were recorded at 4000–400 cm−1 using a Spectrum GX spectrometer (Perkin Elmer Inc., Boston, MA, USA) equipped with potassium bromide pellets. The biosynthesized NPs were lyophilized for FTIR analysis and ground in a mortar and pestle with KBr powder. During the formation of SH-NPs, various functional groups in the SH extract acted as reducing and capping agents.
2.5 Evaluation of catalytic activity of AgNPs and AuNPs
At room temperature, the catalytic potential of NPs for dye reduction was studied using a UV–visible spectrophotometer. NaBH4 was prepared ice-cold prior to the analysis. Then, 2 mL of aqueous solutions of MB (0.08 mM), RB (0.05 mM), and MO (0.1 mM) were blended with 1 mL NaBH4 (10 mM), and the NP solution, SH-AuNP or SH-AgNP, was added as a catalyst. SH-AgNPs (100, 50, and 50 µL) were added to MB, RB, and MO solutions, respectively. The volume of the SH-AuNP solution added to the mixture was 20 µL. The amount of green-synthesized NPs (AgNPs and AuNPs) and the concentrations of NaBH4 and dyes were optimized to determine the catalytic activity. The kinetics of the catalytic reaction were determined by assuming that the reaction process followed the pseudo-first-order law, which is stated as follows:
The rate constant , was obtained from the absorbance at time ( ) and the initial absorbance of the dyes .
3 Results
3.1 Green synthesis of SH-AgNPs and SH-AuNPs
SH extract served as both a reducing and capping agent for the reduction and formation of metal salts during the synthesis of AgNPs and AuNPs. Following that, the AgNO3 solution was added to the SH extract. Within 15 min, as the reaction progressed, the color gradually changed to dark orange (Fig. 2b). Localized surface plasmon resonance (LSPR) was used to observe the color change of the solution. UV–Vis spectroscopy in the range of 300–800 nm also confirmed the formation of SH-AgNPs. The maximum LSPR peak at 420 nm indicated the biosynthesis of SH-AgNPs. Similarly, a HAuCl4·3H2O solution was added to the SH extract. Within 15 min of being placed in the water bath, the color of the colloid changed to violet, indicating the formation of SH-AuNPs (Fig. 2c). As indicated in the spectrum, SH-AuNPs exhibited a strong LSPR band at 528 nm. In earlier studies, AgNPs biosynthesized using Sargassum muticum exhibited an LSPR peak at 420 nm, while AuNPs biosynthesized using algae exhibited an LSPR peak at 540 nm (Azizi et al., 2013; Castro et al., 2013). Both studies demonstrated that algae can be successfully used as reducing agents for the synthesis of inorganic nanoparticles.
Formation of green-synthesized AgNPs and AuNPs. Ultraviolet–visible (UV–Vis) absorption spectra of (a) Sargassum horneri (SH) extract, (b) SH-silver nanoparticles (SH-AgNPs), and (c) SH-gold nanoparticles (SH-AuNPs).
3.2 DLS analysis
Table 1 and Fig. 3 show the size and zeta potential of the SH-AgNPs and SH-AuNPs as measured by dynamic light scattering (DLS). SH-AgNPs had an average size of 90.1 ± 8.38 nm when measured by DLS at room temperature, while SH-AuNPs had an average size of 21.0 ± 2.74 nm. SH-AgNPs and SH-AuNPs had polydiversity indices of 0.384 and 0.360, respectively. The determination of zeta potential confirmed the stability of the nanoparticles. The zeta potentials of SH-AgNPs and SH-AuNPs were −43.49 ± 2.74 and −34.57 ± 4.43 mV, respectively, indicating that the synthesized SH-AgNPs and SH-AuNPs (with large negative values of the measured zeta potential) were stable.
Sample
Synthesis temperature, °C
Reaction Time (min)
Zeta potential (mV)
Average size (nm)
Polydispersity index
SH-AgNPs
80 °C
15 min
−43.49 ± 2.74
90.1 ± 8.38
0.384
SH-AuNPs
−34.57 ± 4.43
21.0 ± 2.74
0.360
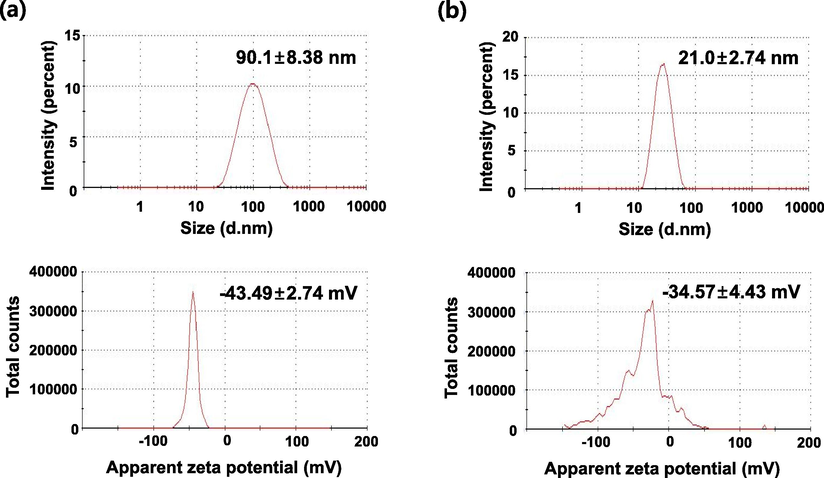
The size distribution and zeta potential of (a) SH-AgNPs and (b) SH-AuNPs determined by Dynamic light scattering (DLS).
3.3 HRTEM analysis
High-resolution transmission electron microscopy (HRTEM) was used to observe the morphology, shape, form, and dispersion of the biosynthesized SH-AgNPs and SH-AuNPs. TEM images of the nanoparticles are shown in Figs. 4 and 5. The average sizes of SH-AgNPs and SH-AuNPs shown in the TEM image (Figs. 4a and 5a) are about 22.72 nm and 13.21 nm, respectively. The sizes of the nanoparticles determined using DLS and TEM images did not agree. This can be attributed to the aggregation of the NPs, which reduces the accuracy of the DLS analysis due to the presence of large particles, increasing light scattering and thus shifting the measured particle size to larger values (Souza et al., 2016). The TEM images revealed that, in addition to other shapes, such as pentagons, hexagons, and octagons, the majority of the nanoparticles had a spherical shape. The SAED patterns shown in Figs. 4c and 5c demonstrate that the synthesized nanoparticles have a crystalline structure. The bright rings correspond to the (1 1 1), (2 0 0), (2 2 0), and (3 1 1) lattice planes, indicating that the structure is face-centered cubic (FCC). The EDX spectra of the nanoparticles are shown in Figs. 4f and 5f. SH-AgNPs exhibited the highest light absorption peak at 3 keV. Similarly, SH-AuNPs had peaks at 2–2.5 and 9.5–10 keV.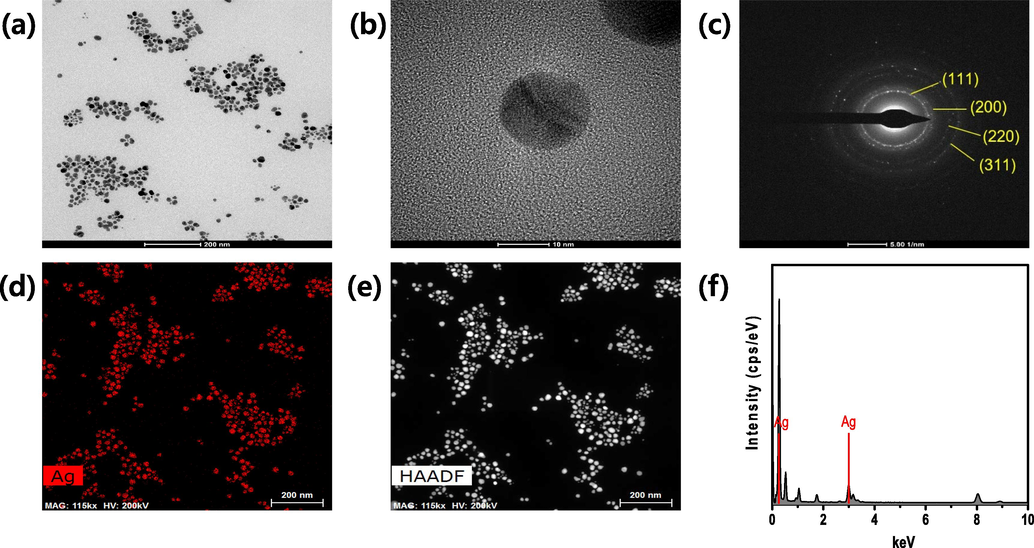
High resolution transmission electron microscopy (HRTEM) images of SH-AgNPs at various magnifications: the scale bar corresponds to (a) 200 nm, (b) 10 nm, (c) selected area electron diffraction (SAED) patterns, (d)–(e) High-angle annular dark-field (HAADF) images, and (f) energy-dispersive X-ray spectroscopy (EDX) spectra of SH-AgNPs. (a) 58 k, (b) 630 k, and (d)–(e) 115 k.
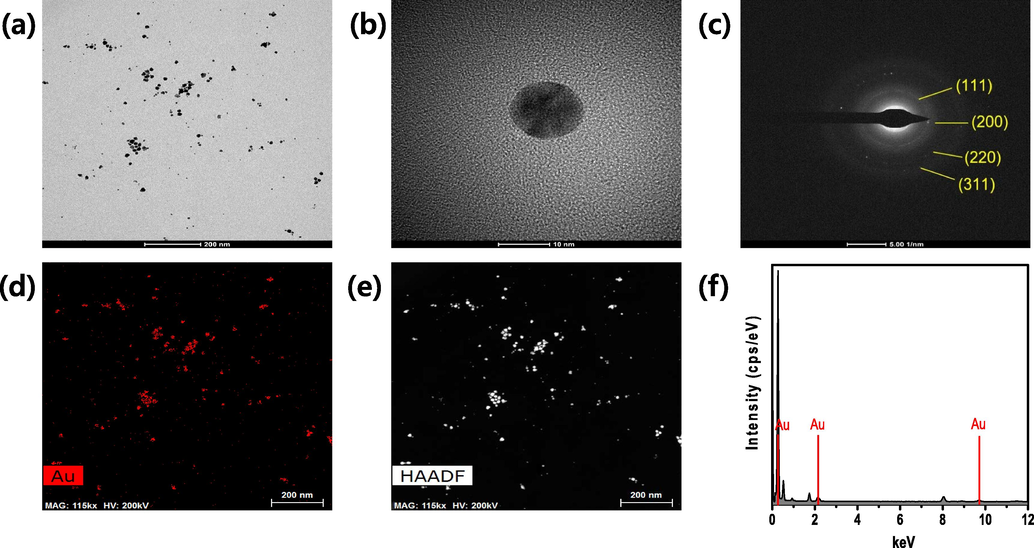
HRTEM images of SH-AuNPs at various magnifications: the scale bar corresponds to (a) 200 nm, (b) 10 nm, (c) SAED patterns, (d)–(e) HAADF images, and (f) EDX spectra of SH-AuNPs. (a) 58 k, (b) 630 k, and (d)–(e) 115 k.
3.4 XRD analysis
XRD analysis was used to confirm the crystalline phases of the green-synthesized AgNPs and AuNPs. The XRD patterns of the biosynthesized NPs are shown in Fig. 6. Four distinct peaks were observed at 2θ values of 38.2°, 44.2°, 64.6°, and 77.3° for the Bragg reflection peak of SH-AgNPs, which were indexed to the (1 1 1), (2 0 0), (2 2 0), and (3 1 1) planes of the FCC structure, respectively. Similarly, the peaks of SH-AuNPs at 38.5°, 44.7°, 64.8°, and 77.9° correspond to the same planes as that of SH-AgNPs. We compared these diffraction peaks to the standards (JCPDS card no. 04-0783 and JCPDS card no. 04-0784).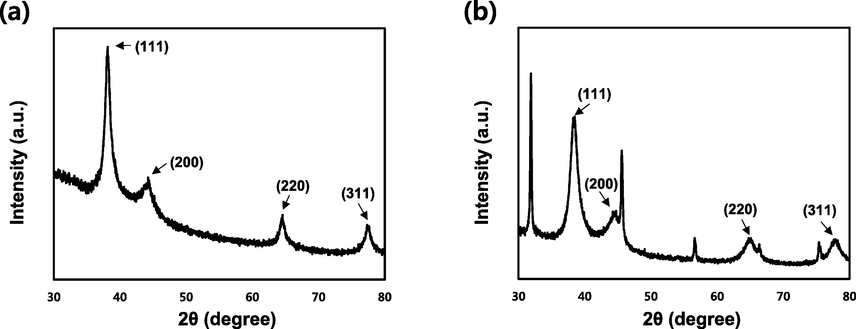
X-ray diffraction (XRD) pattern of bio-synthesized nanoparticles. (a) SH-AgNPs and (b) SH-AuNPs.
3.5 FTIR spectral analysis
The FTIR analysis was used to determine the function of the SH extract as a reducing and capping agent. The FTIR spectrum confirmed the presence of SH chemical compounds on the surface of the biosynthesized NPs. The FTIR spectra of SH extract, SH-AgNPs, and SH-AuNPs are shown in Fig. 7. On analyzing the SH extract, the peaks at 3411 and 1396 cm−1 corresponded to the stretching of —OH bonds in polyphenols or alcohols, which are chemicals found in algae. The peak at 1587 cm−1 corresponds to the N—H stretching vibration of the amine groups. The peak at 1078 cm−1 is attributed to the C—O stretching of alcohols. The peaks at 3412, 1590, 1385, and 1078 cm−1 and peaks at 3423, 1595, 1398, and 1079 cm−1, respectively correspond to the functional components of SH when the SH-AgNPs and SH-AuNPs are analyzed. This suggests that the phytochemicals present in SH act as capping and reducing agents in the synthesis of NPs.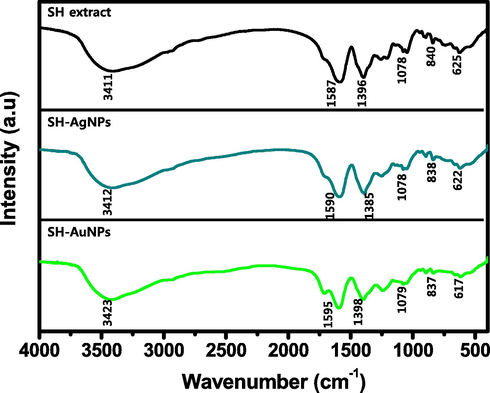
Fourier transform infrared (FTIR) spectra of SH extract, SH-AgNPs, and SH-AuNPs.
3.6 Catalytic activity of SH-AgNPs and SH-AuNPs in reduction of organic dyes
The catalytic activity of the biosynthesized AgNPs and AuNPs was assessed by the degradation of three dyes, methylene blue (MB), rhodamine B (RB), and methyl orange (MO) at room temperature. Double-distilled water was used as a control agent. The degradation reactions of these three dyes were monitored and are shown. A UV–Vis spectrophotometer was used to analyze all reactions. Furthermore, we assumed that the catalytic reaction followed pseudo-first-order kinetics, and calculated the rate constant, k, which is the slope of the graph obtained from the experiment.
MB is a heterocyclic aromatic dye that is used in textiles as well as the medical field and has been the subject of extensive research. It is primarily used to treat methemoglobinemia and malaria (Schirmer et al., 2003). Additionally, it has been reported to have an effect on AD (Oz et al., 2009). Methylene blue, on the other hand, is toxic, and its accumulation in the body, can result in carcinogenicity and biomutation (Payra et al., 2019) as well as serious central nervous system toxicity (Gillman, 2011; Sultan et al., 2018). Fig. 8 shows the UV–VIS spectra of reduced MB in the presence of catalysts (SH-AgNPs and SH-AuNPs) and NaBH4 or distilled water (control agent) and NaBH4. Prior to reduction, the UV–Vis spectrum of MB exhibited a maximum absorbance peak at 662 nm and appeared dark blue. After reduction, there was no peak observed at 662 nm, and the solution became colorless. Fig. 8a shows the spectra of MB with NaBH4 and distilled water without a catalyst. The maximum peak intensity decreased after 40 min. Despite the fact that NaBH4 is a strong reducing agent, no significant difference was observed. On the other hand, when 100 µL of SH-AgNP (Fig. 8b) or 20 µL of SH-AuNP (Fig. 8c) as a catalyst, the maximum peak intensity of the methylene blue solution was almost completely reduced, and both solutions became transparent after 9 and 3 min, respectively. The natural logarithm of the initial maximum absorbance and the time-varying maximum absorbance are plotted in Fig. 9. The slope of the plot was used to calculate the rate constant,
. Table 2 presents the detailed values.
Methylene blue (MB) dye reduction. UV–Vis absorption spectra of MB Reduction by NaBH4 (a) in the absence of catalyst and in presence of (b) SH-AgNPs or (c) SH-AuNPs.
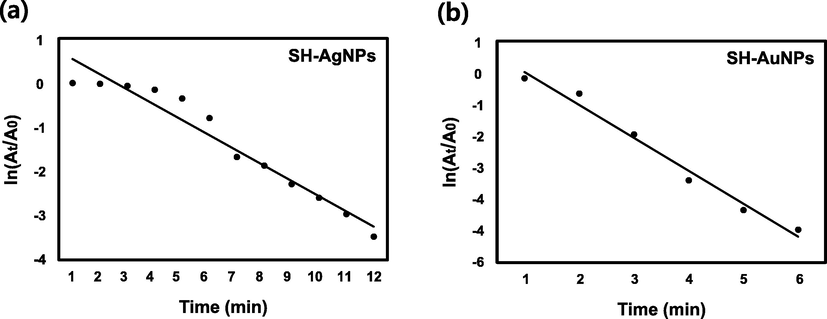
Kinetics of catalytic reaction. Plot of
versus time during MB degradation by (a) SH-AgNPs and (b) SH-AuNPs.
is the maximum absorbance of MB at time
and
is the maximum absorbance at
.
Dye
Catalyst
Rate Constant,
(min−1)
Reaction Time (min)
Correlation Coefficient, R2
Methylene blue
SH-AgNPs
0.3440
12 min
0.9477
SH-AuNPs
1.0407
6 min
0.9813
RB is commonly used in water as a tracer to measure the velocity and direction of water movement, and is widely used as a colorant in the textile and food industries (Sharma et al., 2019; Le and Tran, 2020). However, RB is a potent carcinogen and also exhibits other forms of toxicity, including reproductive and neurotoxic effects (Ahmad et al., 2021). RB had a maximum absorbance of 553 nm and lends a pink color to the solution. Fig. 10a displays the UV–Vis absorption spectra of RB in the presence of NaBH4 and distilled water without catalysts. For 20 min, the maximum absorbance of RB decreased slightly. The absorbance of RB was measured at regular time intervals using SH-AgNPs (50 µL) and SH-AuNPs (20 µL) as catalysts as shown in Fig. 10b and c. The maximum absorbance peak at 553 nm was completely lost within 15 and 3 min respectively, as the solution became colorless. A plot of
against time is shown in Fig. 11. The alternative detailed values, including the RB degradation rate constant, are listed in Table 2.
Rhodamine B (RB) dye reduction. (a) UV–Vis absorption spectra of RB Reduction by only NaBH4 without catalyst, reduction by NaBH4 in presence of (b) SH-AgNPs or (c) SH-AuNPs.
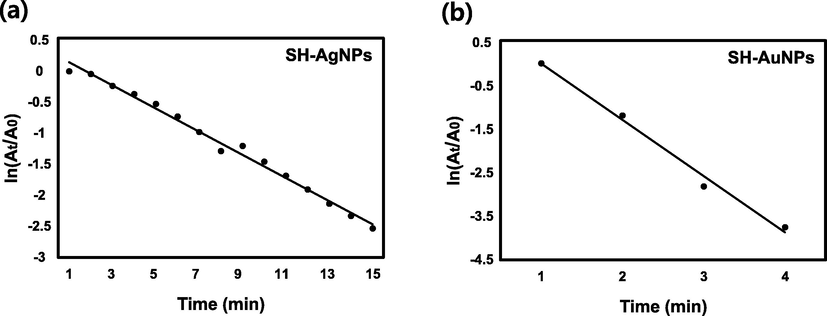
Kinetics of catalytic reaction. Plot of
versus time during RB degradation by (a) SH-AgNPs and (b) SH-AuNPs.
is the maximum absorbance of RB at time
and
is the maximum absorbance at
.
MO is an azo dye characterized by chromogenic azo bonds (-N = N-) that is used in textiles, laboratories, and commercial products (Martínez-Huitle and Brillas, 2009; Chaukura et al., 2016). However, methyl orange is a known carcinogen (Azami et al., 2012; Gong et al., 2013; Hildenbrand et al., 1999). Additionally, it degrades the photosynthetic efficiency of aquatic organisms and is toxic (Huang et al., 2008). MO is orange in color. At 464 nm, the maximum absorbance was determined. The UV–Vis absorption spectra of MO, which was stable for 50 min in the absence of the catalyst is shown in Fig. 12a. However, the maximum absorbance of MO at 464 nm when SH-AgNPs (50 µL) and SH-AuNPs (20 µL) were used as catalysts decreased significantly within 12 and 15 min, respectively, and the MO became colorless (Fig. 12b, c). Graphs of
versus time for the catalytic reduction of MO are shown in Fig. 13, and additional details, including the rate constant, are listed in Table 3.
Methyl orange (MO) dye reduction. UV–Vis absorption spectra of MO Reduction by NaBH4 (a) in the absence of catalyst and in the presence of (b) SH-AgNPs or (c) SH-AuNPs.
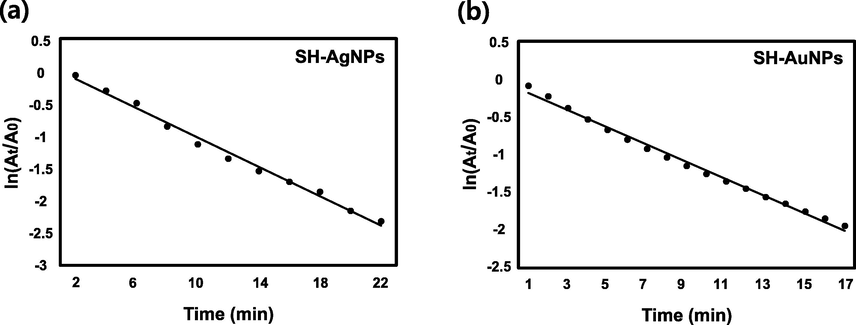
Kinetics of catalytic reaction. Plot of
versus time during MO degradation by (a) SH-AgNPs and (b) SH-AuNPs.
is the maximum absorbance of MO at time
and
is the maximum absorbance at
.
Dye
Catalyst
Rate Constant,
(min−1)
Reaction Time (min)
Correlation Coefficient, R2
Rhodamine B
SH-AgNPs
0.1847
15 min
0.9913
SH-AuNPs
1.2818
4 min
0.9905
4 Discussion
Numerous prior studies have concentrated on the bio-formation of noble metal nanoparticles. We believe this is the first report on the green synthesis of noble metal nanoparticles using Sargassum horneri. Our experimental results demonstrated the biosynthesis of NPs using SH. These biosynthesized NPs have several environmental and economic advantages.
The three dyes were reduced with and without catalysts. In the presence of a catalyst, all dyes were significantly reduced in a short time, and the solution became colorless. The green-synthesized metal NPs facilitated the transfer of electrons from the donor to the acceptor. In the photocatalytic reduction reaction, light energy is used to excite the electrons in the nanoparticles. Additionally, it reacts with the oxygen and hydrogen atoms in NaBH4 to form active radicals such as superoxide anions (O2•−) and hydroxyl radicals (OH•), which attack and break the bonds of the dyes (Huang et al., 2010; Martínez-de la Cruz and Pérez, 2010; He et al., 2011).
We assumed that the degradation process of the dye was a pseudo-first-order reaction; however, the graph of MB is not a straight line. This initial induction period was noted during three independent replications of the experiments to ensure reproducibility. This is because the initial reaction requires more energy to break the bond that represents the dye’s color change; thus, the reaction proceeds slowly until the bond is broken (Huang et al., 2010; Lin et al., 2018). After the bonds were broken, the rate of reaction remained nearly constant. As a result, the reaction was classified as pseudo-first-order. It was anticipated that as the catalyst concentration increased, the initial reaction time would decrease, and the overall reaction rate would increase and become constant. The degradation reaction of RB is divided into two steps: deethylation and cleavage of the conjugated structure. As the deethylation reaction progressed leading to decomposition, the maximum absorbance of RB shifted to a shorter wavelength than previously. This is not the case, however, in conjugated structure cleavage reactions (Zhuang et al., 2010). According to HE et al. (2009) both deethylation and cleavage of the chromophore conjugated structure occur during the degradation reaction of RB, but disruption of the conjugated structure is the predominant pathway. The dye degradation reaction with SH-AgNPs and AgNPs proceeded without altering the peak intensity of the maximum absorbance, indicating that the deethylation reaction can be ignored. Therefore, the primary pathway is the cleavage of the conjugated structure. In addition, there was no significant decrease in the maximum absorbance in the first minute of the RB decomposition reaction using gold nanoparticles as a catalyst (Fig. 8c). The reproducibility experiments confirmed that this initial interval was reproducible. To explain this phenomenon, we concluded that the absorbance peak, which was nearly stable for the initial 1 min, was caused by the deethylation reaction destroying the chromophore-conjugated structure. An azo bond (—N⚌N—) was used to stabilize the MO dye. This nitrogen-to-nitrogen double bond is referred to as a chromophore bond, and breaking it requires more energy and time (Guo et al., 2011).
The initial rate varies with the amount of catalyst used. According to a previous study, Rambabu et al. (2021) demonstrated that the initial induction period of the dye decomposition reaction was brief and that the subsequent secondary reaction was slow. Initially, the reaction occurred due to the abundance of the surfaces of the nanoparticles used as catalysts. Following that, as the concentration gradient decreased, the surface area of the reacting nanoparticles was reduced. In addition, despite the fact that silver nanoparticles are more frequently used as catalysts than gold nanoparticles, the MB and RB dyes degraded more rapidly in the presence of AuNPs than in the presence of AgNPs. The MO dyes reacted similarly to both NPs. This is because the size of the biosynthesized AuNPs is smaller than that of AgNPs; consequently, AuNPs have a higher catalytic ability than AgNPs. Furthermore, it has been reported that the greater the electronegativity of a transition metal, the greater is its catalytic ability (Nwosu, 2012). This demonstrates that AuNPs with a higher electronegativity perform better as catalysts than AgNPs. Therefore, by synthesizing nanoparticles using algae or microorganisms and controlling the synthesis time and temperature, the size of the nanoparticles can be decreased while increasing their dispersion. Furthermore, excellent catalytic ability is observed when metal nanoparticles with a high electronegativity are used to degrade dyes (Table 4).
Dye
Catalyst
Rate Constant,
(min−1)
Reaction Time (min)
Correlation Coefficient, R2
Methyl orange
SH-AgNPs
0.2266
22 min
0.9915
SH-AuNPs
0.1140
17 min
0.9929
5 Conclusion
We demonstrated the eco-friendly synthesis of AgNPs and AuNPs in this study by employing Sargassum horneri extracts as reducing and capping agents. UV–Vis and EDX techniques were used to analyze the formation of biosynthesized SH-AgNPs and SH-AuNPs. DLS and HRTEM were used to determine the size, zeta potential, and morphology of the NPs. The XRD and SAED patterns revealed that the SH-AgNPs and SH-AuNPs crystal structures were FCC. The FTIR analysis of synthesized nanoparticles and extracts of the brown algae Sargassum horneri confirmed that it acts as a reducing and capping agent. At room temperature, NaBH4 was used to degrade MB, RB, and MO using green synthetic nanoparticles. The catalytic capacities of silver and gold nanoparticles were found to be extremely effective, and a comparative study was conducted between the two particles. The dye reduction reaction was found to be pseudo-first-order, and a rate constant was determined. Therefore, marine-algae-based nanoparticles can effectively decompose a variety of harmful dyes and exhibit excellent activity and reactivity as catalysts. The synthesized nanoparticles have the potential to be used to prevent water pollution and to treat wastewater in a variety of industries that use dyes.
CRediT authorship contribution statement
Woo Chang Song: Data curation, Methodology, Formal analysis, Validation, Visualization, Writing – original draft. Beomjin Kim: Data curation, Methodology, Validation. Sun Young Park: Conceptualization, Formal analysis, Funding acquisition, Project administration, Writing – review & editing. Geuntae Park: Conceptualization, Resources, Supervision, Writing – review & editing. Jin-Woo Oh: Supervision, Writing – review & editing.
Acknowledgements
This work was supported by a 2-Year Research Grant of Pusan National University.
Declaration of Competing Interest
The authors declare that they have no known competing financial interests or personal relationships that could have appeared to influence the work reported in this paper.
References
- Phytogenic fabrication of ZnO and gold decorated ZnO nanoparticles for photocatalytic degradation of Rhodamine B. J. Environ. Chem. Eng.. 2021;9(1):104725.
- [CrossRef] [Google Scholar]
- Principles and mechanisms of photocatalytic dye degradation on TiO2based photocatalysts: a comparative overview. RSC Adv.. 2014;4(70):37003-37026.
- [CrossRef] [Google Scholar]
- Magnetically modified Sargassum horneri biomass as an adsorbent for organic dye removal. J. Cleaner Prod.. 2016;137:189-194.
- [CrossRef] [Google Scholar]
- A review on the classification, characterisation, synthesis of nanoparticles and their application. IOP Conf. Ser.: Mater. Sci. Eng.. 2017;263(3):32019.
- [CrossRef] [Google Scholar]
- Central composite design for the optimization of removal of the azo dye, methyl orange, from waste water using fenton reaction. J. Serb. Chem. Soc.. 2012;77(2):235-246.
- [CrossRef] [Google Scholar]
- Biosynthesis of Silver Nanoparticles Using Brown Marine Macroalga, Sargassum Muticum Aqueous Extract. Materials. 2013;6:5942-5950.
- [CrossRef] [Google Scholar]
- Green synthesis of iron oxide nanoparticles using pomegranate seeds extract and photocatalytic activity evaluation for the degradation of textile dye. J. Mater. Res. Technol.. 2019;8(6):6115-6124.
- [CrossRef] [Google Scholar]
- Green synthesis of silver and gold nanoparticles using Stemona tuberosa Lour and screening for their catalytic activity in the degradation of toxic chemicals. Environ. Sci. Pollut. Res.. 2018;25(32):32540-32548.
- [CrossRef] [Google Scholar]
- Biological synthesis of metallic nanoparticles using algae. IET Nanobiotechnol.. 2013;7(3):109-116.
- [CrossRef] [Google Scholar]
- Synthesis, characterisation and methyl orange adsorption capacity of ferric oxide–biochar nano-composites derived from pulp and paper sludge. Appl. Water Sci.. 2016;7(5):2175-2186.
- [CrossRef] [Google Scholar]
- Evaluation of the kinetic and catalytic properties of biogenically synthesized silver nanoparticles. J. Cleaner Prod.. 2018;198:882-890.
- [CrossRef] [Google Scholar]
- Methods and strategies for the synthesis of diverse nanoparticles and their applications: a comprehensive overview. RSC Adv.. 2015;5(127):153-1537.
- [CrossRef] [Google Scholar]
- CNS toxicity involving methylene blue: the exemplar for understanding and predicting drug interactions that precipitate serotonin toxicity. J. Psychopharmacol.. 2011;25(3):429-436.
- [CrossRef] [Google Scholar]
- Adsorptive Removal of Methyl Orange and Methylene Blue from Aqueous Solution with Finger-Citron-Residue-Based Activated Carbon. Ind. Eng. Chem. Res.. 2013;52(39):14297-14303.
- [CrossRef] [Google Scholar]
- Photodegradation of rhodamine B and methyl orange over one-dimensional TiO2 catalysts under simulated solar irradiation. Appl. Surf. Sci.. 2011;257(8):3798-3803.
- [CrossRef] [Google Scholar]
- Application of low-cost adsorbents for dye removal – A review. J. Environ. Manage.. 2009;90(8):2313-2342.
- [CrossRef] [Google Scholar]
- The mechanism of sonophotocatalytic degradation of methyl orange and its products in aqueous solutions. Ultrason. Sonochem.. 2011;18(5):974-980.
- [CrossRef] [Google Scholar]
- Microwave photocatalytic degradation of Rhodamine B using TiO2 supported on activated carbon: Mechanism implication. J. Environ. Sci.. 2009;21:268-272.
- [CrossRef] [Google Scholar]
- Sargassum horneri (Turner) C. Agardh containing polyphenols attenuates particulate matter-induced inflammatory response by blocking TLR-mediated MYD88-dependent MAPK signaling pathway in MLE-12 cells. J. Ethnopharmacol.. 2021;265:113340.
- [CrossRef] [Google Scholar]
- Azo dyes and carcinogenic aromatic amines in cell cultures. Int. Arch. Occup. Environ. Health. 1999;72(S3):M052-M56.
- [CrossRef] [Google Scholar]
- Algal sorbent derived from Sargassum horneri for adsorption of cesium and strontium ions: equilibrium, kinetics, and mass transfer. Appl. Microbiol. Biotechnol.. 2019;103(6):2833-2843.
- [CrossRef] [Google Scholar]
- Analysis of the degradation mechanism of methylene blue by atmospheric pressure dielectric barrier discharge plasma. Chem. Eng. J.. 2010;162(1):250-256.
- [CrossRef] [Google Scholar]
- Adsorption of Rhodamine B and methyl orange on a hypercrosslinked polymeric adsorbent in aqueous solution. Colloids Surf., A. 2008;330(1):55-61.
- [CrossRef] [Google Scholar]
- Efficiency of various recent wastewater dye removal methods: A review. J. Environ. Chem. Eng.. 2018;6(4):4676-4697.
- [CrossRef] [Google Scholar]
- A comparative study of Sargassum horneri Korea and China strains collected along the coast of Jeju Island South Korea: its components and bioactive properties. Algae. 2018;33(4):341-349.
- [CrossRef] [Google Scholar]
- Synthesis of nanoparticles composed of silver and silver chloride for a plasmonic photocatalyst using an extract from a weed Solidago altissima (goldenrod) Adv. Nat. Sci.: Nanosci. Nanotechnol.. 2016;7:015002.
- [CrossRef] [Google Scholar]
- Photocatalytic Degradation of Rhodamine B by C and N Codoped TiO2 Nanoparticles under Visible-Light Irradiation. Journal of chemistry. 2020;2020:1-8.
- [CrossRef] [Google Scholar]
- Photocatalytic degradation of methylene blue in aqueous solution by using ZnO-SnO2 nanocomposites. Mater. Sci. Semicond. Process.. 2018;87:24-31.
- [CrossRef] [Google Scholar]
- Mechanism and Purification Effect of Photocatalytic Wastewater Treatment Using Graphene Oxide-Doped Titanium Dioxide Composite Nanomaterials. Water. 2021;13(14):1915.
- [CrossRef] [Google Scholar]
- Silver nanoparticles in dye effluent treatment: A review on synthesis, treatment methods, mechanisms, photocatalytic degradation, toxic effects and mitigation of toxicity. J. Photochem. Photobiol., B. 2020;205:111823.
- [CrossRef] [Google Scholar]
- Photocatalytic properties of BiVO4 prepared by the co-precipitation method: Degradation of rhodamine B and possible reaction mechanisms under visible irradiation. Mater. Res. Bull.. 2010;45(2):135-141.
- [CrossRef] [Google Scholar]
- Decontamination of wastewaters containing synthetic organic dyes by electrochemical methods: A general review. Appl. Catal., B. 2009;87(3):105-145.
- [CrossRef] [Google Scholar]
- Synthesis of Nanoparticles by Green Synthesis Method. Int. J. Innov. Res. Rev.. 2017;1:6-9.
- [Google Scholar]
- An electronegativity approach to catalytic performance. JTST. 2012;1:25-28.
- [CrossRef] [Google Scholar]
- Methylene blue and Alzheimer’s disease. Biochem. Pharmacol.. 2009;78(8):927-932.
- [CrossRef] [Google Scholar]
- Probing the photo- and electro-catalytic degradation mechanism of methylene blue dye over ZIF-derived ZnO. J. Hazard. Mater.. 2019;373:377-388.
- [CrossRef] [Google Scholar]
- Green synthesis of silver nanoparticles using grape seed extract and their application for reductive catalysis of Direct Orange 26. J. Ind. Eng. Chem.. 2018;58:74-79.
- [CrossRef] [Google Scholar]
- A Novel Antivirally Active Fucan Sulfate Derived from an Edible Brown Alga, Sargassum horneri. Chem. Pharm. Bull.. 2001;49(4):484-485.
- [CrossRef] [Google Scholar]
- Photocatalytic degradation of dyes using semiconductor photocatalysts to clean industrial water pollution. J. Ind. Eng. Chem.. 2021;97:111-128.
- [CrossRef] [Google Scholar]
- Green synthesis of zinc oxide nanoparticles using Phoenix dactylifera waste as bioreductant for effective dye degradation and antibacterial performance in wastewater treatment. J. Hazard. Mater.. 2021;402:123560.
- [CrossRef] [Google Scholar]
- Mn-doped ZrO2 nanoparticles prepared by a template-free method for electrochemical energy storage and abatement of dye degradation. Ceram. Int.. 2019;45(12):15298-15306.
- [CrossRef] [Google Scholar]
- Green synthesis of silver nanoparticles: An approach to overcome toxicity. Environ. Toxicol. Pharmacol.. 2013;36(3):807-812.
- [CrossRef] [Google Scholar]
- Chemical Characterization, Antioxidant and Antitumor Activity of Sulfated Polysaccharide from Sargassum Horneri. Carbohydr. Polym.. 2014;105:260-269.
- [CrossRef] [Google Scholar]
- Highly efficient Sr/Ce/activated carbon bimetallic nanocomposite for photoinduced degradation of rhodamine B. Catal. Today. 2019;335:437-451.
- [CrossRef] [Google Scholar]
- A comparison of TEM and DLS methods to characterize size distribution of ceramic nanoparticles. J. Phys.: Conf. Ser.. 2016;733(1):12039.
- [CrossRef] [Google Scholar]
- Linear and crosslinked Polyurethanes based catalysts for reduction of methylene blue. J. Hazard. Mater.. 2018;344:210-219.
- [CrossRef] [Google Scholar]
- Biosynthesis of pure zinc oxide nanoparticles using Quince seed mucilage for photocatalytic dye degradation. J. Alloys Compd.. 2020;821:153519.
- [CrossRef] [Google Scholar]
- Antioxidant and Photocatalytic Activity of Aqueous Leaf Extract Mediated Green Synthesis of Silver Nanoparticles Using Passiflora edulis f. flavicarpa. J. Nanosci. Nanotechnol.. 2019;19(5):2640-2648.
- [CrossRef] [Google Scholar]
- Green synthesis, characterization and catalytic degradation studies of gold nanoparticles against congo red and methyl orange. J. Photochem. Photobiol.. 2018;178:33-39.
- [CrossRef] [Google Scholar]
- Ecological studies of Sargassum horneri (Turner) C. Agardh in Obama Bay, Japan Sea. Nippon Suisan Gakkaishi. 1984;50(7):1193-1200.
- [CrossRef] [Google Scholar]
- Photocatalytic Degradation of RhB over TiO2 Bilayer Films: Effect of Defects and Their Location. Langmuir. 2010;26(12):9686-9694.
- [CrossRef] [Google Scholar]


