

Translate this page into:
Catalytic reduction of NOx and oxidation of dichloroethane over α-MnO2 catalysts: Properties-Reactivity relationship
⁎Corresponding authors. panhua@zjsru.edu.cn (Hua Pan), zhipingye@zjut.edu.cn (Zhiping Ye)
-
Received: ,
Accepted: ,
This article was originally published by Elsevier and was migrated to Scientific Scholar after the change of Publisher.
Abstract
Abstract
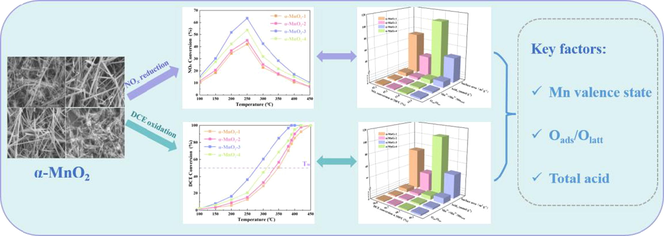
The reduction ability of NO to N2 and the oxidation performance of 1,2-dichloroethane (DCE) over α-MnO2 catalysts were investigated. The results show that α-MnO2-3 exhibited the highest catalytic activity in 63.5 % conversion of NOx reduction by C3H8 at 250 °C, and 80 % conversion of DCE combustion by O2 at 338 °C. It is revealed the active phase of α-MnO2-3 is tetragonal α-MnO2 with the selectively exposed plane of (2 1 1). It was proposed the high DCE decomposition of α-MnO2-3 was ascribed to the redox properties. The overall characterization results revealed that α-MnO2-3 catalyst preserves more active sites of low valence Mn and higher surface adsorbed oxygen (Oads) /lattice oxygen (Olatt) at the outermost layers, and lower reduction temperature in H2-TPR profiles than that of other catalysts. Meanwhile, NH3-TPD profile of α-MnO2-3 also shows a large number of acid sites promote NOx reduction.
Keywords
α-MnO2
NOx reduction
DCE oxidation
Properties-reactivity relationship

1 Introduction
Waste incineration is developing rapidly in China, since this process can reduce waste volume as well as generate heat energy (Zhu et al., 2018). However, it cannot be avoidable to have pollutants, such as NOx and chlorine-containing volatile organic compounds (CVOCs) from flue gas of municipal solid waste incinerators, and the emissions are increasing in recent years in China (Kulkarni et al., 2008; Wu et al., 2016; Li et al., 2017; Shao et al., 2021). Meanwhile, NOx and CVOCs are the critical precursors of PM2.5 and O3 (Ni et al., 2009; Wu et al., 2016; Ye et al., 2022), which can cause severe environmental problems (Alzaky and Li, 2021). Therefore, how to effectively control emissions of NOx and CVOCs has been a focus of air pollution control.
Selective catalytic reduction of NOx by hydrocarbons (HC‐SCR) has attracted much attention over the past two decades (More et al., 2018; Xu et al., 2020). The transition metal oxides display the good reactivity with inexpensive costs, which are becoming potential catalysts in HC-SCR, especially Mn-based catalysts. For example, Liu et.al. (Liu et al., 2019a) obtained up to 100 % NO conversion at 130℃ with MnOx/AC in C2H4-SCR.
In the last few decades, it has been emerging various strategies for VOCs elimination, such as adsorption (Zhao et al., 2022), plasma (Yu et al., 2020), biodegradation (Khan et al., 2018), catalysis (Chen et al., 2022), photocatalysis (Chen et al., 2022), Photothermal Catalysis (Yang et al., 2022b). Catalytic oxidation is recognized as one of the most efficient technologies for low concentration CVOCs removal due to high removal efficiency and mineralization rate (Fang et al., 2019; He et al., 2019; Liu et al., 2019c). Interestingly, transition metal oxides-based (MnOx) catalysts with variable valance states also exhibit the potential of high reactivity in CVOCs decomposition (Kim and Shim, 2010; Santos et al., 2010; Piumetti et al., 2015; Ye et al., 2021). Sphere-Shaped Mn3O4 exhibited a complete conversion of methyl − ethyl − ketone to CO2 at 200 °C (Pan et al., 2017). Cheng et. al. (Cheng et al., 2017) also obtained 90 % dimethyl ether conversion at 238 °C on α-MnO2.
Hence, MnOx catalysts shows the bifunctional ability to reduce NOx and oxidize CVOCs. However, to the best of our knowledge, the promising catalyst of α-MnO2 in these two different reaction mechanisms was seldom reported when applying for NOx reduction in HC‐SCR and CVOCs oxidation separately. It is worthy investigating the relationship between structure properties and reactivity of α-MnO2, and to discuss the physicochemical characterizations. In this present work, a series of α-MnO2 catalysts with the different physical–chemical characteristics were prepared and applied for the catalytic removal of both NOx and DCE (as the typical pollutant of CVOCs). Catalyst characterization and reactivity were investigated to illustrate the relation between properties and reactivity of α-MnO2 catalysts.
2 Materials and methods
2.1 Catalyst preparation
All α-MnO2 samples were synthesized by hydrothermal method using Potassium permanganate (KMnO4) and Manganous acetate ((CH3COO)2Mn) as precursors. For α-MnO2-1, 1.5 g (CH3COO)2Mn and 2.5 g KMnO4 were added into 160 mL distilled water with magnetic stirring for 30 min at room temperature. Next, the mixed solution was poured into two Teflon-lined stainless-steel autoclave (100 mL), and then heated at 160 °C for 12 h. The obtained colloids were washed with deionized water and ethanol, then dried in vacuum at 80 °C for 12 h. The dried samples were calcined at 450 °C for 4 h. Finally, the catalyst was pelleted, crushed, and sieved to 40 ∼ 60 mesh granules before use.
To modify the physical–chemical characteristics of α-MnO2 catalysts, the mass ratio of (CH3COO)2Mn and KMnO4 was 4.9:3.2, and the temperature of hydrothermal treatment was 140 °C. The obtained product was donated as α-MnO2-2. Also, according to the synthesis plan of α-MnO2-1, the mass ratio of (CH3COO)2Mn and KMnO4 was 9.7:6.3, and the temperature of hydrothermal treatment was 90 °C. The obtained product was donated as α-MnO2-3. To obtain α-MnO2-4, the mass ratio of (CH3COO)2Mn and KMnO4 was 0.8:3.0, and the hydrothermal treatment was carried out at 240 °C.
2.2 Catalytic activity test
2.2.1 HC-SCR
The catalytic activity test of HC-SCR was carried out in a stainless-steel tubular (i.d.10 mm). 600 mg catalyst was evaluated under a typical feed gas included 800 ppm NO, 600 ppm C3H8, 6.5 vol% O2, and N2 as balance. The reaction temperature was conducted from 150 to 550 °C at a total flow rate of 450 mL/min, corresponding to a weigh hourly space velocity of 19 000 mL·g−1·h−1. The NOx concentration of the inlet and outlet were continuously measured by an infrared gas analyzer (Xi’an Juneng Corporation, China). NOx conversion was evaluated by Eq. (1):
where [NOx]in and [NOx]out are the inlet and outlet concentration of NOx, respectively.
2.2.2 Catalytic oxidation of DCE
The catalytic activity of DCE combustion was measured using a stainless-steel tubular (i.d.10 nm). 500 mg catalyst was selected for activity test. The reaction was conducted from 100 to 450 °C at a flow rate of 400 mL/min of feeding gases with 500 ppm DCE and 21 vol% O2, corresponding to a gas hourly space velocity (GHSV) of 48 000 mL·g−1·h−1. DCE and products (CO and CO2) were measured by an on-line gas chromatograph (GC9890) with ECD and FID. An on-line Cl2 and HCl detectors (PN–2000, China) was used to analyse the concentrations of Cl2 and HCl. DCE conversion, COx (CO2 and CO) yield, HCl yield and Cl2 yield were evaluated by the following Eqs. (2) to (6), respectively.
where [DCE]in is the DCE inlet concentration of DCE. [DCE]out, [CO]out, [CO2]out, [HCl]out and [Cl2]out are the outlet concentration of DCE, CO, CO2, HCl and Cl2, respectively.
2.3 Catalyst characterization
Fourier infrared spectrum (FT-IR) spectra was recorded in the range 400 ∼ 2000 cm−1 with a resolution of 4 cm−1 on a thermo scientific nicolet iS20 using the KBr pellet technique.
X-ray powder diffraction patterns (XRD) were obtained by Panalytical X'Pert'3 Powder diffractometer, equipped with Cu Kα X-ray radiation (λ = 0.15406 nm). All the catalysts were scanned at 2θ range between 10° to 80° (rate of 2°/min).
The surface areas of the synthesized materials were determined by the Brunauer − Emmett − Teller (BET) method using ASAP 2460 3.01 instrument. Nitrogen physisorption experiments were carried out at 77 K after initial pretreatment of the samples by degassing at 300 °C for 2 h.
Scanning electron microscopy (SEM) images have been studied using Schottky (ZEISS Gemini 300) equipment with a resolution of 10 kV and 50 kV.
Transmission electron microscopy (TEM) images were obtained from JEM-F200 electron field emission transmission electron microscope (JEOL, Japan) under 200 kV acceleration voltage.
X-ray photoelectron spectra (XPS) were carried out on thermo scientific system with Al Kα radiation. The binding energy scale was corrected for surface charging by use of the C 1 s peak of contaminant carbon as reference at 284.8 eV.
Hydrogen temperature programmed reduction (H2-TPR) experiment was conducted on an AutoChem1 II 2920 instrument equipped with a thermal conductivity detector (TCD) to measure the consumption of H2. Before detection by the TCD, a 50 mg sample was pretreated under N2 stream (40 mL·min−1) at 300℃ for 1 h, and then cooled to 50 °C. A mixed stream with a 10 vol% H2/Ar mixture (50 mL·min−1) was introduced into the sample, and the sample was heated from room temperature to 800 °C.
The NH3 temperature-programmed desorption (NH3-TPD) was performed on an AutoChem1 II 2920 instrument. The catalyst was (100 mg) was pretreated in a N2 (50 mL∙min−1) of at 300℃ for 1 h, and then cooled to 50℃. Sample was treated with 10 % NH3 diluted in N2 (30–50 mL∙min−1) for 1 h to achieve adsorption saturation. The gas was switched back to He (30 mL∙min−1) for 1 h to purge the physically adsorbed species. Finally, the catalyst was heated from 50℃ to 800℃ at a rate of 10 °C∙min−1 in high purified N2 (30 mL∙min−1).
3 Results and discussion
3.1 Catalytic performance
Fig. 1 showed the different catalytic performance of α-MnO2 samples for NOx reduction and DCE oxidation at the range of 100 ∼ 450 °C. For NOx reduction, activity performance decreased as follows: α-MnO2-3 (63.5 %) > α-MnO2-4 (53.8 %) > α-MnO2-1 (45.2 %) ≈ α-MnO2-2 (42.1 %) at 250 °C. For DCE oxidation, T50 was chosen to compare the activity of these samples. T50 of DCE oxidation follows the order of α-MnO2-3 (276.4 °C) < α-MnO2-4 (310.9 °C) < α-MnO2-2 (337.3 °C) ≈ α-MnO2-1 (348.6 °C). Thus, α-MnO2-3 exhibited the highest catalytic activity for both NOx reduction and DCE oxidation.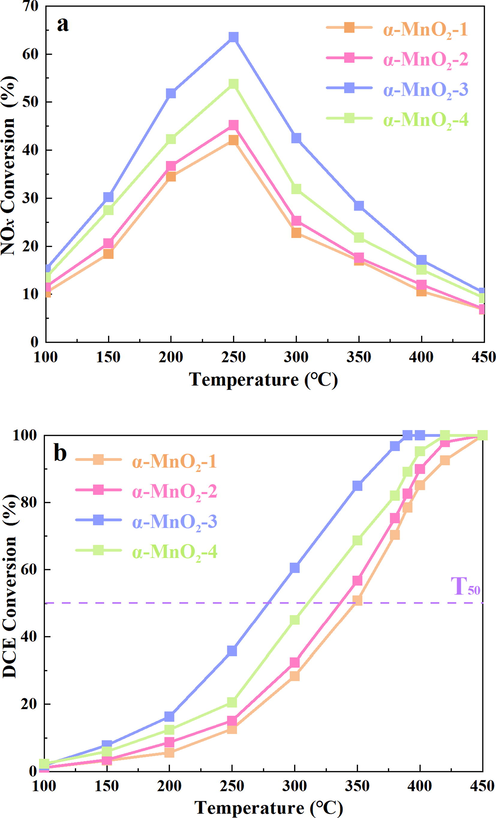
NOx (a) and DCE (b) conversion efficiencies as a function of temperature over a series of α-MnO2 samples.
As exhibited in Fig. 2, in yield of CO2 and CO, for α-MnO2-3, it is remarkable to reveal 84.4 % of C3H8 was decomposed into COx. While for α-MnO2-1, α-MnO2-2 and α-MnO2-4, C element in C3H8 was about 36.8 %, 41.6 % and 51.6 % converted to CO2, and about 12.8 %, 14.6 % and 15.9 % converted to CO, respectively. In yield of HCl and Cl2, for α-MnO2-3, 53.8 % of HCl and 22.7 % of Cl2 were observed. That is, 76.5 % of DCE was total oxidized into inorganic chlorine products using α-MnO2-3. However, for α-MnO2-1, α-MnO2-2 and α-MnO2-4, Cl element in DCE were about 10.0 %, 8.6 % and 17.7 % converted to Cl2, and about 29.9 %, 34.2 % and 34.9 % converted to HCl, respectively. There are about 60.0 %, 57.1 % and 47.4 % of chlorine remained as organic chlorine. Above all, α-MnO2-3 displayed the best products selectivity.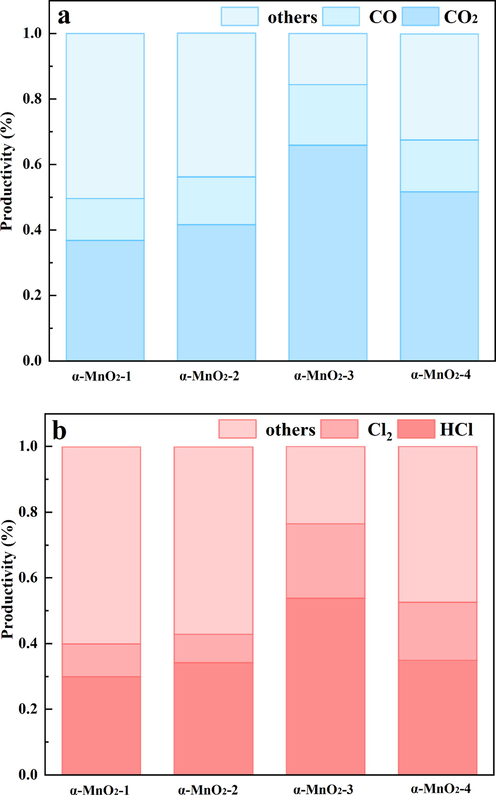
The (a) carbon balance and (b) chlorine balance of different α-MnO2 samples at 350 °C.
3.2 Properties-reactivity relationship
3.2.1 Physical properties
FT-IR spectra of the synthesized materials are shown in Fig. 3a. The peaks in low wavenumbers between 800 cm−1 and 400 cm−1 are assigned to Mn-O lattice vibration (Yuan et al., 2009; Wang et al., 2019). Our samples showed the well-defined absorption peaks of MnO2 at 469 cm−1, 526 cm−1, and 720 cm−1 as well as the weak defined shoulder at 597 cm−1 (King'ondu et al., 2011; Chen et al., 2015; Liu et al., 2019b). Fig. 3b shows the XRD patterns of the as-prepared manganese oxide samples. Comparing to the XRD patterns of the standard α-MnO2 (JCPDS 44–0141) (Cheng et al., 2017; Gao et al., 2017), it can deduce that all of the four samples could be well corresponding to the tetragonal α-MnO2 phase. The diffraction peaks at 2θ = 12.9°, 18.2°, 25.8°, 28.9°, 37.6·°, 42.0°, 49.9°, 56.4°, 60.3°, 65.1°, and 69.7 °could be attributed to the (1 1 0), (2 0 0), (2 2 0), (3 1 0), (2 1 1), (3 0 1), (4 1 1), (6 0 0), (5 2 1), (0 0 2) and (5 4 1) plane, respectively. α-MnO2 presented three main peaks at 12.9°, 28.9° and 37.6°, which were assigned to the (1 1 0), (3 1 0) and (2 1 1) planes of α-MnO2 (JCPDS 44–0141). The peak intensity of (1 1 0) plane order decreased as follows: α-MnO2-3 > α-MnO2-2 > α-MnO2-4 > α-MnO2-1. The intensity order of (3 1 0) plane is as follows: α-MnO2-2 > α-MnO2-3 > α-MnO2-1 > α-MnO2-4. Interestingly, the peak intensity of (2 1 1) plane follows the order as α-MnO2-3 > α-MnO2-4 > α-MnO2-2 > α-MnO2-1, which is similar with the activity order of four samples. It indicates that (1 1 0) plane, (3 1 0) plane and (2 1 1) plane may be exposed active planes, in agreement with the findings of TEM. Besides, no diffraction peaks of other phases, such as β-MnO2 and γ-MnO2, are detected, implying that each catalyst is composed of α-MnO2 phase. This result is consistent with the result of FT-IR.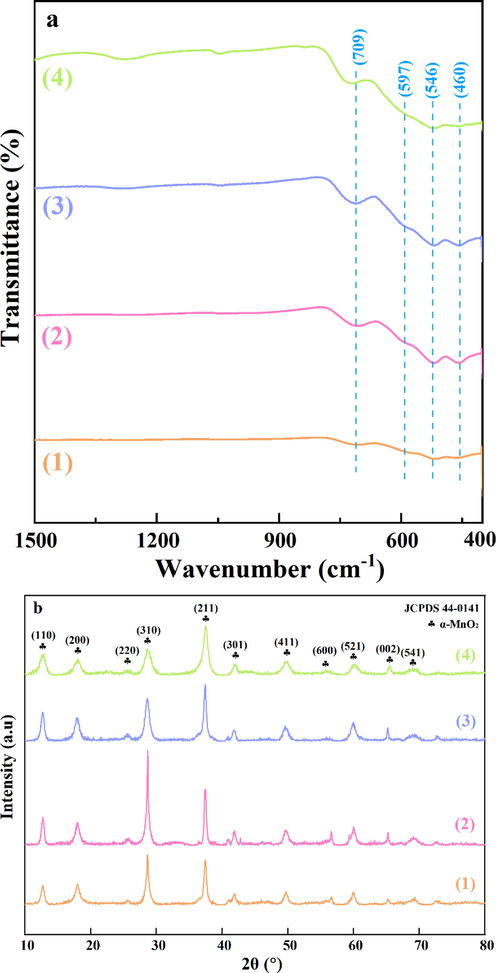
(a) FT-IR spectra and (b) XRD patterns of (1) α-MnO2-1, (2) α-MnO2-2, (3) α-MnO2-3 and (4) α-MnO2-4.
The average pore size, pore volume and specific surface area of catalysts were measured by N2 adsorption–desorption, and the results are presented in Fig. 4 and Table 1. N2 adsorption–desorption isotherms of the samples type II characteristics with well-developed H3 type hysteresis loops, confirming that the samples have mesoporous characteristics (Fig. 4a) (Sing, 1982). The samples possessed a mesopore distribution in the range of 2 ∼ 35 nm in Fig. 4b. α-MnO2-1 and α-MnO2-4 presented a wide peak centered at from 5 nm to 35 nm, while α-MnO2-2 and α-MnO2-3 presented the peak centered at ca. 2.5 nm. In Table 1, the surface area order decreased as follows: α-MnO2-4 (104.6 m2·g−1) > α-MnO2-1 (72.6 m2·g−1) > α-MnO2-3 (44.1 m2·g−1) > α-MnO2-2 (34.6 m2·g−1). The pore volume of order was as follows: α-MnO2-4 (0.6 cm3·g−1) > α-MnO2-1 (0.2 cm3·g−1) > α-MnO2-3 (0.1 cm3·g−1) = α-MnO2-2 (0.1 cm3·g−1). The difference in preparation condition leads to a big difference in surface area of the α-MnO2 samples.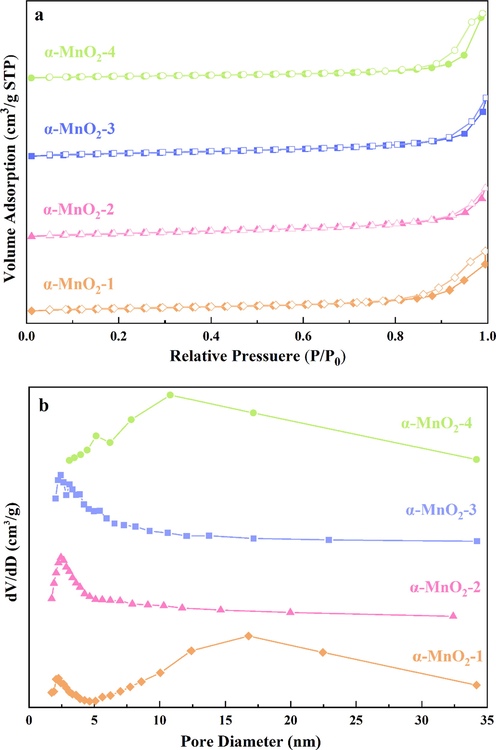
N2 adsorption/desorption curves (a) and BJH isotherms (b) of a series of α-MnO2 samples.
Catalyst
SBET(m2/g)
Vtotal
(cm3/g)DP(nm)
(Mn2++Mn3+)/
MnT
Oads/Olatt
Acid
amount
(mmol/g)AcidT (mmol/g)
Ⅰ
Ⅱ
α-MnO2-1
72.6
0.2
10.1
0.5
0.4
0.8
0.6
1.4
α-MnO2-2
34.6
0.1
10.0
0.5
0.4
0.5
0.4
0.9
α-MnO2-3
44.1
0.1
12.6
0.7
0.6
1.1
1.2
2.3
α-MnO2-4
104.6
0.6
30.1
0.6
0.5
0.8
0.8
1.6
To further analyze the morphologies and surface structures of the catalysts, the SEM and TEM images of four samples are shown in Fig. 5. It should be noted that the wire-like morphology can be differentiated from the rod-like morphology in terms of the bending or straight shape (Wang et al., 2012). Fig. 5 (a) and (d) showed that both α-MnO2-1 and α-MnO2-4 are presented as stacking-nanowires, while Fig. 5 (b) and (c) exhibited nanorod-like appearance of α-MnO2-2 and α-MnO2-3 with uniform distribution. It should be noted that the surface area of wire-like morphology can be much larger than the rod-like morphology. The well-identified periodic lattice fringes of 2.40 Å, 3.10 Å and 6.94 Å are corresponding to the interplanar distance of (2 1 1), (3 1 0) and (1 1 0) facets of α-MnO2, respectively. Whereas, severe blurring of the lattice fringes were also detected (highlighted by red rectangles) in α-MnO2-3. It is worth noting that large amount of point defects on α-MnO2 could obscure the distorted lattice fringes, which may result from the existence of oxygen vacancies on catalyst surfaces(Huang et al., 2018).The morphologies of samples are consistent with the findings of XRD.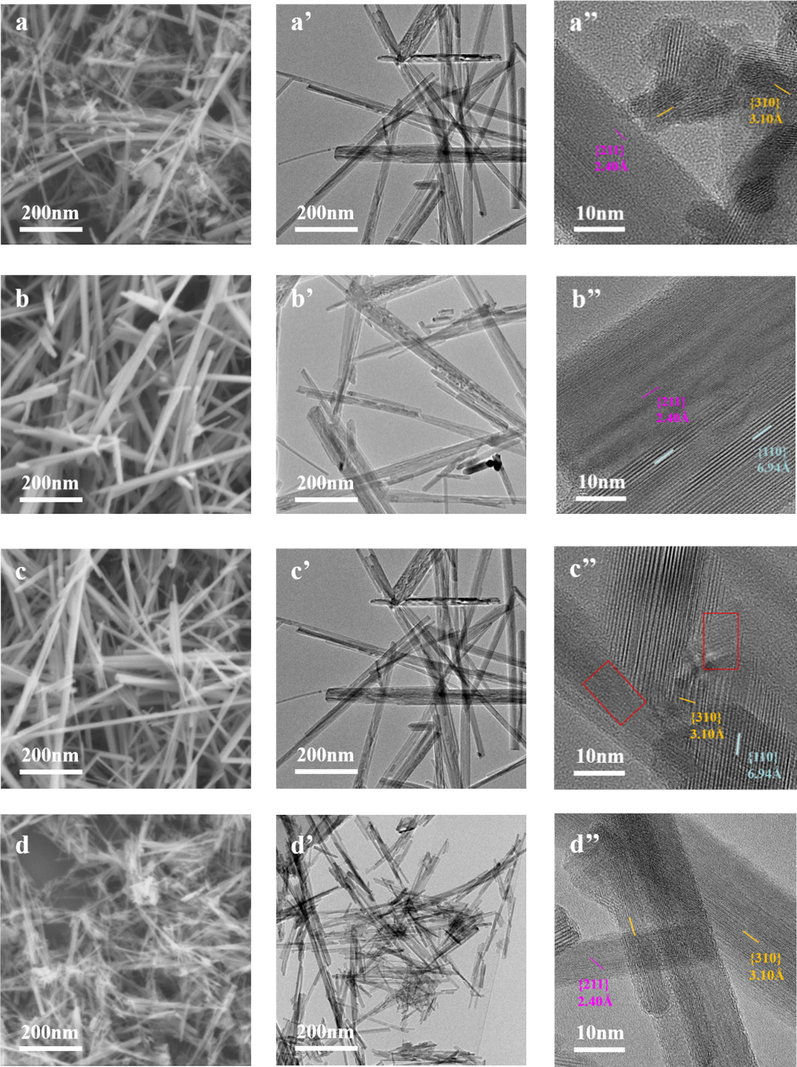
SEM and TEM images of a series of α-MnO2 samples under different magnifications. (a, a’) α-MnO2-1; (b, b’) α-MnO2-2; (c, c’) α-MnO2-3; (d, d’) α-MnO2-4.
3.2.2 Chemical properties
XPS measurements were carried out to identify the surface species of α-MnO2 samples. Fig. 6a illustrated Mn 2p spectra of four samples. Peaks at 642.7, 641.7 and 640.4 eV can be attributed to Mn4+, Mn3+ and Mn2+, respectively (Si et al., 2015; Ma et al., 2017; Zhang et al., 2022). In Table 1, the proportion of low valence Mn (Mn3+ and Mn2+) followed the order (Table 1): α-MnO2-3 (0.7) > α-MnO2-4 (0.6) > α-MnO2-2 (0.5) = α-MnO2-1 (0.5). Low valence Mn content is an indicator of surface oxygen vacancies (Yang et al., 2020). Additionally, Mn2+-O and Mn3+-O bonds are weaker than Mn4+-O (Zhang, 1982). Large proportion of low valence Mn results in longer and weaker Mn-O bonds on the surface of α-MnO2-3 (Yang et al., 2020). It suggests that oxygen atoms on its surface are more likely to be released to participate in oxidation. In addition, the existence of surface low valence Mn would promote dissociation and activation of circumambient oxygen atoms (Yang et al., 2020).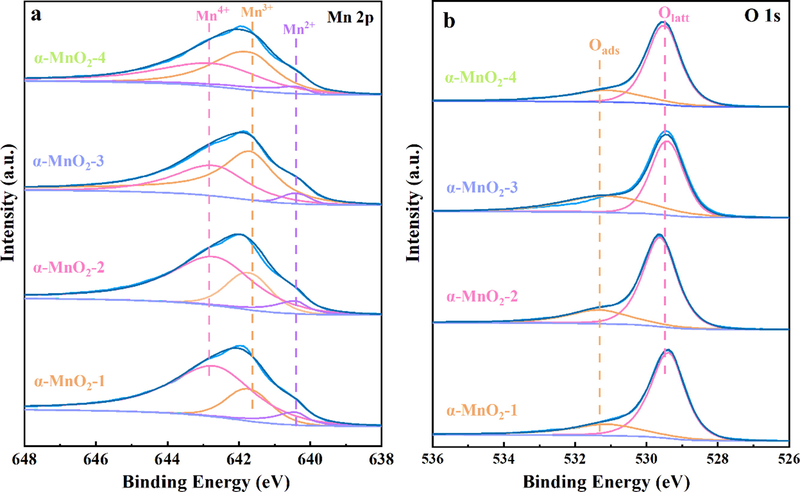
XPS spectra of (a) Mn 2p and (b) O 1 s regions for a series of α-MnO2 samples.
The XPS spectra of O 1 s of the samples are shown in Fig. 6b. As reported previously, the peak around 529.0 ∼ 530.0 eV is typical for Olatt in a coordinatively saturated environment, while the peak around 531.0 ∼ 532.0 eV can be attributed to the Oads in a low-coordinated environment (Tang et al., 2010; Wang et al., 2011; Yang et al., 2022a). As shown in Table 1, the Oads/Olatt molar ratio for all α-MnO2 catalysts follows the order of α-MnO2-3 (0.6) > α-MnO2-4 (0.5) > α-MnO2-2 (0.4) = α-MnO2-1 (0.4), which is consistent with the catalytic activity results. As we known that Oads performs high activities and makes an important impact in SCR reaction because of its higher mobility than Olatt (Zhang et al., 2020). On the basis of the Mars-van Krevelen mechanism, the emergence and annihilation of oxygen vacancies is the key step of VOC oxidation. Adsorbed oxygen species participate in the redox cycle of the vacancies from gaseous-adsorbed oxygen transformation (Huang et al., 2015). Surface adsorbed oxygen are relevant to the formation of Mn3+ and Mn2+ and are more active than lattice oxygen at low temperatures (Wang et al., 2012). Thus, α-MnO2-3 might be highly active in DCE oxidation owing to large numbers of low valence Mn cations and adsorbed oxygen species.
H2-TPR measurement is carried out to analyze the reducibility of different α-MnO2 samples and the results are presented in Fig. 7. As shown in Fig. 7a, Two reduction peaks (Ⅰ, Ⅱ) could be due to the reduction of Mn4+ to Mn3+ and Mn3+ to Mn2+, respectively (Yang et al., 2020). The initial H2 consumption rate was calculated to better evaluate the reducibility of these samples, as depicted in Fig. 7b. It was clearly seen that the initial H2 consumption rates of the samples decreased in the order of α-MnO2-3 > α-MnO2-4 > α-MnO2-1 > α-MnO2-2. The lower reduction temperature and the larger initial H2 consumption rate indicate a better low-temperature redox ability (Chen et al., 2017; Gong et al., 2017).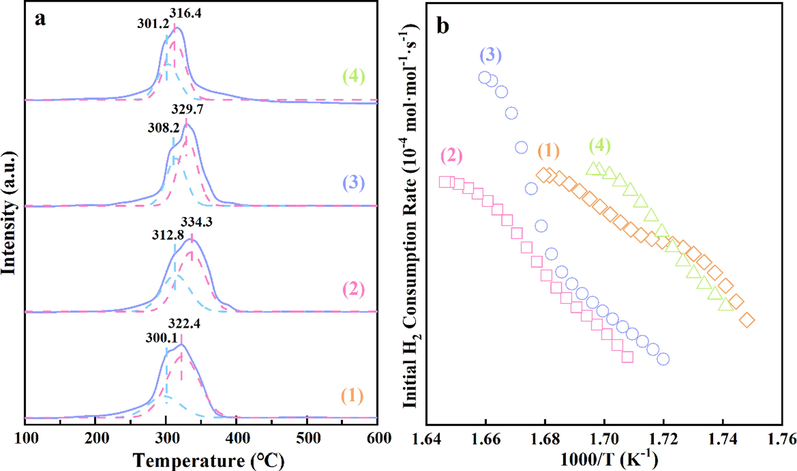
(a) H2-TPR profiles and (b) initial H2 consumption rates of (1) α -MnO2-1, (2) α -MnO2-2, (3) α -MnO2-3 and (4) α -MnO2-4.
NH3-TPD experiments are taken to analyze the acidities of the four types of α-MnO2 and the results are shown in Fig. 8 and Table 1. As shown in Fig. 8, NH3-TPD curves of α-MnO2 samples exhibited two desorption peaks (labeled as I and II). The desorption peak I at low temperature is attributed to the desorption of NH3 from weak acid sites and the desorption of physisorbed NH3, the desorption peak II at middle temperature is assigned to the desorption of NH3 from middle strong acid sites (Fang et al., 2013; Yao et al., 2017). It is worth noting that two desorption peaks of α-MnO2-3 and α-MnO2-4 belong to weak acid site and middle strong acid site at below 450℃. The quantitative analysis data of NH3-TPD was summarized in Table 1. It was reported that the quantity of the desorption peak was proportional to the strength of acid site (Zhang et al., 2020). Hence, as seen in Fig. 8, the quantity of peaks can be ranked by α-MnO2-3 > α-MnO2-4 > α-MnO2-1 > α-MnO2-2, implying the order of acid site numbers. α-MnO2-3 catalyst not only shows two acid sites at 145℃ and 350℃, but also presents the largest amount of acid sites among these catalysts, which is basically consistent with the activity test of NOx reduction.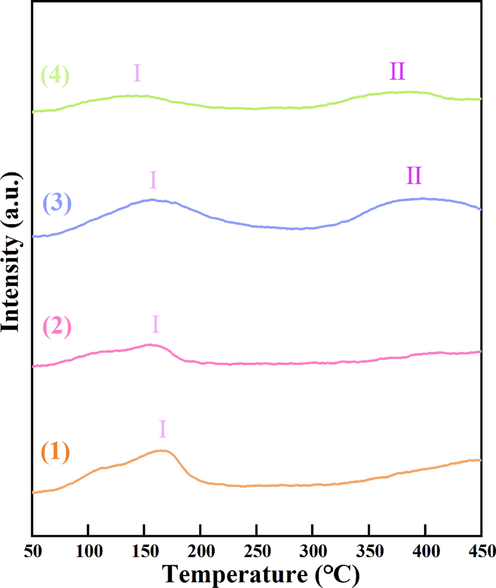
NH3-TPD profiles of (1) α-MnO2-1, (2) α-MnO2-2, (3) α-MnO2-3 and (4) α-MnO2-4.
The possible properties-reactivity relationship of four α-MnO2 samples was illustated in Fig. 9. In this work, Oads/Olatt, low valence Mn content and total acidity were positively related to activity of the samples. However, surface area, pore structure and redox properties are not the key factors in our study.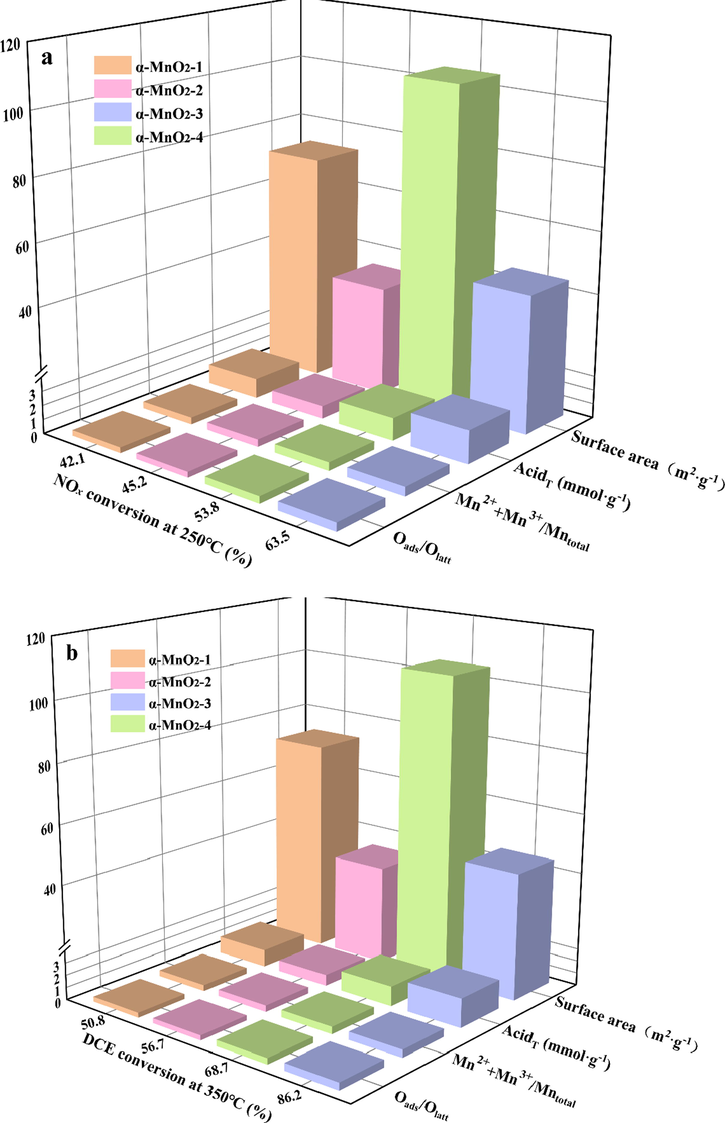
The relationship between catalytic activities for NOx reduction (a) and DCE oxidation (b).
4 Conclusion
α-MnO2-3 catalyst presented the best performance among a series of α-MnO2 for both the catalytic reduction of NOx reduction and DCE oxidation. The Oads/Olatt, the proportion of low valence Mn content and total acidity are the crucial factors for the activity of α-MnO2. The maximum conversion of NOx achieved 63.5 % at 250℃ and DCE achieved 80 % at 338℃ on α-MnO2-3 catalyst, respectively. As for the yield of carbon and chlorine, α-MnO2-3 also exhibits highest yield, which implies that α-MnO2-3 may be a potential catalyst for removal of NOx and VOCs.
Acknowledgments
This work was financially supported by Zhejiang Provincial Natural Science Foundation of China (LGF22B070005) and Innovation and Entrepreneurship Talent Project of Jiangsu Province (JSSCRC2021236).
Declaration of interests
The authors declare that they have no know competing financial interests or personal relationships that could have appeared to influence the work reported in this paper.
References
- Production of the complete fertilizer with simultaneously removing sulfur oxides and nitrogen oxides using yellow phosphorus. Arab. J. Chem.. 2021;14:4.
- [CrossRef] [Google Scholar]
- Hydrolysis driving redox reaction to synthesize Mn-Fe binary oxides as highly active catalysts for the removal of toluene. Chem. Eng. J.. 2017;330:281-293.
- [CrossRef] [Google Scholar]
- Structural distortion of molybdenum-doped manganese oxide octahedral molecular sieves for enhanced catalytic performance. Inorg. Chem.. 2015;54:10163-10171.
- [CrossRef] [Google Scholar]
- Stable Black Phosphorus Encapsulation in Porous Mesh-like UiO-66 Promoted Charge Transfer for Photocatalytic Oxidation of Toluene and o-Dichlorobenzene: Performance, Degradation Pathway, and Mechanism. ACS Catalysis. 2022;12:8069-8081.
- [CrossRef] [Google Scholar]
- Catalytic combustion of dimethyl ether over alpha-MnO2 nanostructures with different morphologies. Appl. Surf. Sci.. 2017;409:223-231.
- [CrossRef] [Google Scholar]
- Efficient MnOx/SiO2@AC catalyst for ozone-catalytic oxidation of gaseous benzene at ambient temperature. Appl. Surf. Sci.. 2019;470:439-447.
- [CrossRef] [Google Scholar]
- Low-temperature selective catalytic reduction of NO with NH3 over nanoflaky MnOx on carbon nanotubes in situ prepared via a chemical bath deposition route. Nanoscale. 2013;5:9199-9207.
- [CrossRef] [Google Scholar]
- In-situ DRIFTS for the mechanistic studies of NO oxidation over alpha-MnO2, beta-MnO2 and gamma-MnO2 catalysts. Chem. Eng. J.. 2017;322:525-537.
- [CrossRef] [Google Scholar]
- Effects of surface physicochemical properties on NH3-SCR activity of MnO2 catalysts with different crystal structures. Chin. J. Catal. 2017;38:1925-1934.
- [CrossRef] [Google Scholar]
- Recent advances in the catalytic oxidation of volatile organic compounds: a review based on pollutant sorts and sources. Chem. Rev.. 2019;119:4471-4568.
- [CrossRef] [Google Scholar]
- Superior performance of α@β-MnO2 for the toluene oxidation: Active interface and oxygen vacancy. Appl. Catal. A. 2018;560:195-205.
- [CrossRef] [Google Scholar]
- Low temperature catalytic oxidation of volatile organic compounds: a review. Catal. Sci. Technol.. 2015;5:2649-2669.
- [CrossRef] [Google Scholar]
- Applying the Rayleigh Approach for Stable Isotope-Based Analysis of VOC Biodegradation in Diffusion-Dominated Systems. Environ. Sci. Technol.. 2018;52:7785-7795.
- [CrossRef] [Google Scholar]
- Catalytic combustion of VOCs over a series of manganese oxide catalysts. Appl. Catal. B. 2010;98:180-185.
- [CrossRef] [Google Scholar]
- Manganese oxide octahedral molecular sieves (OMS-2) multiple framework substitutions: a new route to OMS-2 particle size and morphology control. Adv. Funct. Mater.. 2011;21:312-323.
- [CrossRef] [Google Scholar]
- Dioxins sources and current remediation technologies–a review. Environ. Int.. 2008;34:139-153.
- [CrossRef] [Google Scholar]
- Emission characteristic of polychlorinated dibenzo-p-dioxins and polychlorinated dibenzofurans (PCDD/Fs) from medical waste incinerators (MWIs) in China in 2016: A comparison between higher emission levels of MWIs and lower emission levels of MWIs. Environ. Pollut.. 2017;221:437-444.
- [CrossRef] [Google Scholar]
- Catalytic oxidation of chlorobenzene over noble metals (Pd, Pt, Ru, Rh) and the distributions of polychlorinated by-products. J. Hazard. Mater.. 2019;363:90-98.
- [CrossRef] [Google Scholar]
- Performance of C2H4 reductant in activated-carbon- supported MnOx-based SCR catalyst at low temperatures. Energies. 2019;12:123.
- [CrossRef] [Google Scholar]
- Construction of substrate-dependent 3D structured MnO2 catalysts for diesel soot elimination. Appl. Surf. Sci.. 2019;484:197-208.
- [CrossRef] [Google Scholar]
- δ-MnO2 with an ultrahigh Mn4+ fraction is highly active and stable for catalytic wet air oxidation of phenol under mild conditions. Catal. Sci. Technol.. 2017;7:3200-3204.
- [CrossRef] [Google Scholar]
- Bimetallic Au-Ag/Al2O3 as efficient catalysts for the hydrocarbon selective reduction of NOx from lean burn engine exhaust. Catal. Today. 2018;306:23-31.
- [CrossRef] [Google Scholar]
- Emissions of PCDD/Fs from municipal solid waste incinerators in China. Chemosphere. 2009;75:1153-1158.
- [CrossRef] [Google Scholar]
- Sphere-shaped Mn3O4 catalyst with remarkable low-temperature activity for Methyl–Ethyl–Ketone combustion. Environ. Sci. Technol.. 2017;51:6288-6297.
- [CrossRef] [Google Scholar]
- Mesoporous manganese oxides prepared by solution combustion synthesis as catalysts for the total oxidation of VOCs. Appl. Catal. B. 2015;163:277-287.
- [CrossRef] [Google Scholar]
- The role of lattice oxygen on the activity of manganese oxides towards the oxidation of volatile organic compounds. Appl. Catal. B. 2010;99:353-363.
- [CrossRef] [Google Scholar]
- Interplay effect on simultaneous catalytic oxidation of NO and toluene over different crystal types of MnO2 catalysts. P COMBUST INST. 2021;38:5433-5441.
- [CrossRef] [Google Scholar]
- Selective dissolution of a-site cations in ABO(3) perovskites: a new path to high-performance catalysts. Angew. Chem. Int. Ed. Engl.. 2015;54:7954-7957.
- [CrossRef] [Google Scholar]
- Reporting physisorption data for gas/solid systems with special reference to the determination of surface area and porosity (Provisional) Pure Appl. Chem.. 1982;54:2201-2218.
- [CrossRef] [Google Scholar]
- Tang, X., Li, J., Hao, J., 2010. Significant enhancement of catalytic activities of manganese oxide octahedral molecular sieve by marginal amount of doping vanadium.Catal.Commun.11,871875. https://doi.org/10.1016/j.catcom.2010.03.011.
- Manganese oxides with rod-, wire-, tube-, and flower-like morphologies: highly effective catalysts for the removal of toluene. Environ. Sci. Technol.. 2012;46:4034-4041.
- [CrossRef] [Google Scholar]
- Urea hydrolysis over α-MnO2 catalyst: preparation, characterizations and influencing factors. Catal. Lett.. 2019;149:2032-2042.
- [CrossRef] [Google Scholar]
- Surface structure sensitivity of manganese oxides for low-temperature selective catalytic reduction of NO with NH3. Appl. Catal. B. 2011;101:598-605.
- [CrossRef] [Google Scholar]
- Dioxin distribution characteristics and health risk assessment in different size particles of fly ash from MSWIs in China. Waste Manage. (Oxford). 2016;50:113-120.
- [CrossRef] [Google Scholar]
- Recent advances in copper-based zeolite catalysts with low-temperature activity for the selective catalytic reduction of NOx with hydrocarbons. New J. Chem.. 2020;44:817-831.
- [CrossRef] [Google Scholar]
- Comparative study of alpha-, beta-, gamma- and delta-MnO2 on toluene oxidation: Oxygen vacancies and reaction intermediates. Appl. Catal., B. 2020;260:118150
- [CrossRef] [Google Scholar]
- Highly efficient photothermal catalysis of toluene over Co3O4/TiO2 p-n heterojunction: The crucial roles of interface defects and band structure. Appl. Catal. B. 2022;315:121550
- [CrossRef] [Google Scholar]
- Recent advancement and future challenges of photothermal catalysis for VOCs elimination: From catalyst design to applications. Green Energy & Environ. https:// 2022
- [CrossRef] [Google Scholar]
- Influence of different supports on the physicochemical properties and denitration performance of the supported Mn-based catalysts for NH3-SCR at low temperature. Appl. Surf. Sci.. 2017;402:208-217.
- [CrossRef] [Google Scholar]
- Preferential dissolution of copper from Cu-Mn oxides in strong acid medium: Effect of the starting binary oxide to get new efficient copper doped MnO2 catalysts in toluene oxidation. Appl. Surf. Sci.. 2021;537:147993
- [CrossRef] [Google Scholar]
- Investigation of Cu-Mn catalytic ozonation of toluene: Crystal phase, intermediates and mechanism. J. Hazard. Mater.. 2022;424:127321
- [CrossRef] [Google Scholar]
- Enhanced Solar Photothermal Catalysis over Solution Plasma Activated TiO2. Adv. Sci.. 2020;7
- [CrossRef] [Google Scholar]
- Fabrication of MnO2-pillared layered manganese oxide through an exfoliation/reassembling and oxidation process. J. Power Sources. 2009;189:1278-1283.
- [CrossRef] [Google Scholar]
- Electronegativities of elements in valence states and their applications. Inorg. Chem.. 1982;21:3886-3889.
- [CrossRef] [Google Scholar]
- Selective catalytic reduction of NO with NH3 over high purity palygorskite-supported MnO2 with different crystal structures. Aerosol Air Qual. Res.. 2020;20:1155-1165.
- [CrossRef] [Google Scholar]
- Effect of calcination temperature on the structure and performance of rod-like MnCeOx derived from MOFs catalysts. Mol. Catal.. 2022;522:112226
- [CrossRef] [Google Scholar]
- Universitetet i Oslo-67 (UiO-67)/graphite oxide composites with high capacities of toluene: Synthesis strategy and adsorption mechanism insight. J. Colloid Interface Sci.. 2022;627:385-397.
- [CrossRef] [Google Scholar]
- Emission characteristics of PCDD/Fs in stack gas from municipal solid waste incineration plants in Northern China. Chemosphere. 2018;200:23-29.
- [CrossRef] [Google Scholar]


