

Translate this page into:
CeO2 nanofibers-CdS nanostructures n–n junction with enhanced visible-light photocatalytic activity
⁎Corresponding author. hakar@yu.ac.ir (Hajir Karimi),
⁎⁎Corresponding author. m_ghaedi@yu.ac.ir (Mehrorang Ghaedi)
-
Received: ,
Accepted: ,
This article was originally published by Elsevier and was migrated to Scientific Scholar after the change of Publisher.
Peer review under responsibility of King Saud University.
Abstract
In the present work, the n-cerium (IV) oxide (CeO2)/n-cadmium sulfide (CdS) composite nanofibers were successfully synthesized via a facile electrospinning and hydrothermal synthesis strategy. The physicochemical properties of the synthesized composite nanofibers were investigated by using X-ray diffraction (XRD), field emission scanning electron microscope (FESEM), energy Dispersive X-Ray Spectroscopy (EDS), diffuse Reflectance Spectroscopy (DRS), Fourier-transform infrared (FTIR), photoluminescence (PL), Brunauer–Emmett–Teller (BET) and Raman spectroscopy analysis. The activities of the CeO2/CdS were evaluated through the photocatalytic degradation of Rose Bengal (RB) in an aqueous solution under blue LED light radiation. CeO2/CdS composites exhibit higher photocurrent density in photocurrent response experiment and smaller charge-transfer resistance in electrochemical impedance spectroscopy (EIS). Overall, the results confirmed higher charge separation efficiency in CeO2/CdS composites compared to pristine CeO2 nanofibers, and CdS, which is related to intimately contact among the CeO2, and CdS. The present work provides a new approach to construct n-n heterojunction photocatalysts based on electrospinning and a deeper insight for the photocatalytic degradation activity. In addition, possible degradation mechanism and pathways were proposed according to the identified intermediates.
Keywords
CeO2 nanofibers
Electrospinning
Heterojunction
Degradation
Photocatalysis
Photocurrent

1 Introduction
Photocatalysis process has been considered as one of the most promising technologies to solve the environmental problem and energy issues. The photocatalytic wastewater degradation used to eliminate or reduce content of organic hazardous contaminants by directly converting the irradiation energy into chemical energy (Gaya and Abdullah, 2008). The photo-degradation efficiency of pollutants are typically determined by the photocatalyst, which is a core part of this green technology. According to this mind, the developing efficient, stable, and low-cost photocatalyst, is of importance to bring the method to the market (Liang et al., 2019). The common photocatalysts are primarily metal oxides or sulfides such as TiO2, ZnO, AgVO3, CeO2/Ag3PO4, Bi2O3/Bi2MoO6, CdS/Cu2O, ZnWO4 (Wang et al., 2018; Luo et al., 2018; Reddy et al., 2019). Among tremendous photocatalysts, n-type cerium oxide (CeO2) as an interesting rare earth substance, has attracted much attention due to activity oxide catalysts applications, structural and electronic promoters (Li et al., 2011; Trovarelli, 1996) and its as f0 metal oxide photocatalysts owing to unique 4f electron configuration used as catalyst in oxygen and hydrogen production and water splitting (Chen et al., 2010). According to the morphology and particle size, the band gap CeO2 is between 2.9 and 3.2 eV and also CeO2 has a relatively long lifetime span of photo-generated electron-hole pairs than TiO2 (Aslam et al., 2016; Lazar et al., 2012).
Multiple strategies have been effectively developed to increases the photocatalytic activity of CeO2 under visible light, for instance, combination of CeO2 with narrow-gap semiconductors such as cadmium sulfide (CdS). CdS as n-type semiconductor have a narrow band gap between 2.2 and 2.4 eV and sufficient flat-band potential (−0.5 V vs. NHE at pH 7) and conduction band overpotential for reduction of H+ to H2 (Xiang et al., 2013; Yong and Schoonen, 2000; Al Marzouqi et al., 2019) This semiconductor has shown great potential applications in gas sensors, solar cell and supercapacitor applications (Kumar et al., 2015; De Adhikari et al., 2018). Various morphologies of CdS such as nanoparticles, nanowires, nanorods and nanosheets influence the optical band gap structure and charge carrier transfer (Zhu et al., 2017). CdS suffers from photocorrosion phenomenon that occurs on oxygen and sulfur of photocatalyst during the light illumination. On the other hand, the induced electrons react with H+, while the induced holes will react with the negative part of photocatalysts (here S2−) more than the O2– from water (Xian et al., 2014). Recently, CdS based hybrid photocatalysts consist of binary (TiO2/CdS, ZnO/CdS, and Pt/CdS) and ternary compounds (ZnS/CuS/CdS) applied for different application (Zhao et al., 2015; Ma et al., 2015; Dong et al., 2018). Overall, the release of various dyes in water affects on the health and the environment issues and remediation potential of living organisms. Rose Bengal (RB) is anionic shape of a fluorescent dye derived from a polyhalogenated fluorescein that its widely used insecticides, dyeing substance and in printing industries (Miller, 2005; Ameen et al., 2012). Presence of RB dye in wastewater leads to several dangerous illness to the stomach and liver of humans (Mittal et al., 2009).
Several of strategies have been performed to improve the semiconductor photocatalysis such as defects engineering, tuning of morphology, doping and hybridization. Amongst, the tuning of morphology has been regarded as an effective approach to improve the photocatalytic activity (Yan and Zhu, 2008; Ghouri et al., 2018, 2015). Various types of photocatalyst structures including nanoparticle (Yang et al., 2017; Ghouri et al., 2019), nanorod (Barzegar et al., 2019), nanowire (You et al., 2017), core-shell (Arabzadeh and Salimi, 2016), yolk-shell (Liu et al., 2016), composite nanofiber (Lu et al., 2017) and hollow fiber (Kertèsz et al., 2014) are possible structure for several applications. Among these structures, One-dimensional (1D) nanofibers (NFs) have attracted much attention due to their high aspect ratios and ability of their possible modification by the formation of composite NFs which extensively improved their photocatalytic activity (Sahay et al., 2012; Al-Meer et al., 2017). The characters such as specific surface area, particle sizes, crystal structure, number of defective sites and electron-hole recombination rate, have main effects on the photocatalytic activity. The electrospinning process as an efficient technique was used to make nonwovens polymer NFs with sub-micron scale diameters (Huang et al., 2003; Deitzel et al., 2001; Ghouri et al., 2016). Fibers made by an electrospinning process with hierarchical structures provide a heterogeneous interface and high specific areas which are the important key factors for photocatalyst. Also, the photocatalyst morphology allows NFs to be comfortably separated from solution photo-degradation with sedimentation or filtration (Cao et al., 2010). Li et al. (2012) used the electrospinning technique to synthesize high‐porosity ZnO/CeO2 NFs for photo-degradation of rhodamine B under UV irradiation. Also, Cao et al. (2010) construct CeO2/TiO2 nanofibrous by the combination of electrospinning technique and hydrothermal methods for dye photo-degradation under UV light irradiation.
In the present work, CeO2/CdS composites have been synthesized by an electrospinning process. The photocatalytic performance was investigated in water purification by photocatalytic degradation of RB as targeted organic pollutants under visible light (LED) irradiation at room temperature. The central composite design (CCD) technique was used for optimization and evaluation of the influence of main variables (pH, irradiation time, RB concentration, photocatalyst dosage) in a batch mode. Analysis of variance (ANOVA) used to investigate the significance of model and extent of contribution of individual and interaction of factors. Additionally, photocatalytic kinetics of RB photo-degradation was investigated by the Langmuir–Hinshelwood kinetics model. Photocurrent studies revealed the photo-generated electrons and holes transfer between CeO2/CdS NFs and CdS within the composites. Moreover, the originality of this study is encompassed in the preparation method and photocatalytic activity of CeO2/CdS composite that the present photocatalyst synthesized based on CeO2 NFs from the electrospinning and hydrothermal technique. Therefore, the originality of this work is encompassed in the fabrication technique and photocatalytic activity of CeO2/CdS composite based on CeO2 NFs that fabricated from the electrospinning and precipitation approach.
2 Experimental
2.1 Materials and instrumental analysis
All reagents and chemicals including polyvinylpyrrolidone (PVP), cerium (III) nitrate hexahydrate (Ce (NO3)3·6H2O), cadmium nitrate tetrahydrate, thiourea and dimethylformamide (DMF) were obtained from Merck Company (Germany). The Rose Bengal dye (RB, molecular formula: C20H2Cl4I4Na2O5, Mw = 973.67 g/mol) was purchased from Sigma Aldrich Company and used without further purification. The absorption spectrum of dye was determined using UV–Vis spectrophotometry (model V-530, Jasco, Japan). FTIR spectra of as-spun PVP/Ce (NO3)3·6H2O, CeO2 and CeO2/CdS were characterized using a Perkin Elmer RX-IFTIR Spectrometer over a range of 500–4000 cm−1 (resolution = 1 cm−1). DRS spectra were obtained with a spectrophotometer (Avant Avaspec-2048-TEC). The morphology of samples and its average diameter were evaluated by field emission scanning electron microscope (FESEM, TESCAN MIRA3) and EDS analysis was performed by silicon drift detector oxford instruments. X-ray diffraction (Panalytical model X’ Pert Pro) was recorded using Cu kα radiation with Cu Ka radiation operated at 40 kV and 40 mA. MicroRaman measurements were performed with a Raman spectrophotometer (AvaSpec by Avantes Inc) equipped with a laser diode emitting at 785 nm. All photoluminescence (PL) spectra were obtained on a spectrofluorometer (Perkin-Elmer LS 55) exciting at 350 nm wavelengths.
2.2 Preparation of CeO2 nanofibers
CeO2 NFs were prepared via dissolving 2 g of Polyvinylpyrrolidone (PVP) in 10 mL ethanol and DMF (3:2 v/v) and stirred for 1 h which following the addition of 0.868 g Ce(NO3)3·6H2O and their mixing by magnetic starrier of the mixture for 1 h lead to the formation of light yellow transparent solution. The homogenous solution was transferred to a plastic syringe with a 0.7 mm diameter stainless steel needle in horizontal direction respect to the collector. A voltage of 18.5 kV was applied for the electrospinning process and the distance between the stainless steel needle and the collector was fixed at 13 cm with the flow rate of 0.4 mL/h. The NFs were collected on aluminum foil substrates that were stuck to the surface of the grounded aluminum plate. The as-spun NFs were calcined at 550 °C for 3 h in a furnace with a heating rate of 2 ◦C min−1.
2.3 Preparation of CeO2/CdS composite
CeO2/CdS were prepared by the hydrothermal method as followed: Firstly, 40 mg CeO2 NFs were put into a Teflon-lined stainless steel autoclave of 100 mL capacity. Then, 90 mg thiourea, 90 mg Cd (NO3)2·4H2O and 50 mL deionized water were added and autoclave was sealed and heated in furnace at 180 °C for 12 h cooling assembly to room temperature lead to formation of suspensions which were collected and the products were washed with deionized water and ethanol for three times and dried in oven at 70 °C for 4 h. The synthesis of CeO2/CdS products (denoted as CeO2/CdS-1) is given in Fig. 1. Subsequently, A series of CeO2/CdS composite photocatalysts could be obtained by controlling the amount of thiourea, Cd(NO3)2·4H2O and they were denoted as CeO2/CdS-1, CeO2/CdS-2 and CeO2/CdS-3 (molar ratio of CeO2 to CdS = 0.8, 1 and 1.2).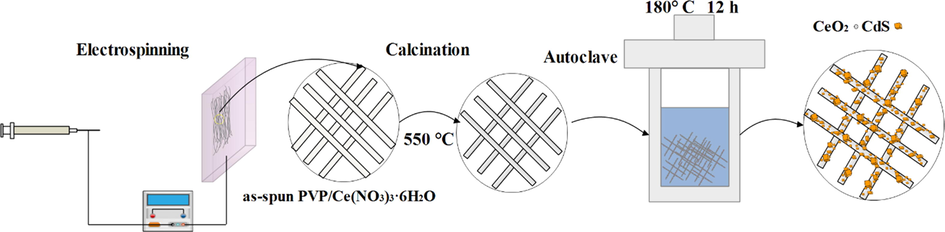
Scheme of the preparation of CeO2/CdS composite.
2.4 Experimental setup and procedure
The schematic of the batch reactor setup that mainly includes a strip blue LED lamp with wavelength 470 nm, the reaction glass tube, sparger (diffuser), flow meter, power source, and air pump is used. The stripped blue LED is installed in the periphery circle of the glass tube until uniform light distribution. All parts of the system were sealed in a box that was covered with aluminum foil to avoid visible light dispersion. In this work, RB was employed as a representative dye indicator to evaluate the visible light irradiation photocatalytic activity of CeO2/CdS composite NFs. For each run, the amount of CeO2/CdS was dispersed in 20 mL of RB aqueous solution of known initial concentration at a specific pH, which was adjusted by 0.1 mol L−1 HCl or NaOH were taken in a glass tube. The glass tube was transferred into the photoreactor and the strip blue LED is installed in the periphery circle of the glass tube until uniform light distribution for activation of photocatalyst NFs is supplied and the air was distributed in aqueous media at a certain flow rate. Before switching the LED lamp and oxygen distribution, the solution in the reactor was put in the dark for 30 min to make sure to establish the magnitude of adsorption and desorption equilibrium of RB dye over the photocatalyst surface. After each runs, the sample was brought out from the solution at a determined time and centrifuged at 3000 rpm for 5 min to separate the photocatalyst and subsequently analyzed by UV–Vis spectrophotometer. The photocatalytic degradation efficiency percentage was calculated using the following equation:
Where PDE is the photo-degradation efficiency (%), C0 (mg L−1) and Ct (mg L−1) are the concentration of RB dye at initial and after time, respectively. Typical UV–Vis absorption spectra changes during the photocatalytic processes for RB and CeO2/CdS of photocatalyst are shown in Fig. 2 and that indicates that an increase in irradiation time leads to RB photo-degradation in aqueous solution.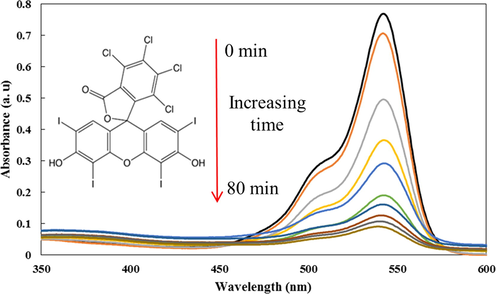
UV–Vis absorption spectra for 4 mg.L−1 at pH of 6 in presence of 1 g/L of CeO2/CdS-1 photocatalyst dosage.
2.5 Central composite design (CCD)
CCD used to calculate the quadratic model with five levels and four variables to recognize variables and interactions with a minimum number of runs and cost using a short time (Sabzehmeidani et al., 2020; Dehgani et al., 2020). The CCD matrix (Table 1) is composed of some replicate at central point in addition of other general points to calculate and estimate the effect of variables including pH (X1), photocatalyst mass (g L−1, X2), irradiation time (min, X3), RB concentration (mg. L−1, X4) which mainly affect the RB photo-degradation (Design-Expert 7.0.0). The design indicates 22 individual experimental runs and 2 blocks based on small CCD experiments. The fitted quadratic polynomial equation (
) used for the mathematical relationship among independent parameters (Sabzehmeidani et al., 2019; Abbasi et al., 2020).
Factors
Levels
Low (−1)
Central (0)
High (+1)
−α
α
X1: pH
6
7
8
5
9
X2: Photocatalyst Dosage (g L−1)
0.75
1.00
1.25
0.50
1.50
X3: Irradiation time (min)
30
50
70
10
90
X4: Dye Concentration RB (mg L−1)
8
12
16
4
20
Run
Block
X1
X2
X3
X4
PDE%RB
1
1
6
1.25
70
16
82.47
2
1
7
1.00
50
12
77.21
3
1
7
1.00
50
12
74.21
4
1
7
1.00
50
12
75.22
5
1
8
0.75
30
16
48.59
6
1
6
0.75
70
8
81.54
7
1
6
0.75
30
8
58.41
8
1
8
0.75
70
16
59.21
9
1
8
1.25
30
8
39.18
10
1
7
1.00
50
12
74.87
11
1
8
1.25
70
8
67.05
12
1
6
1.25
30
16
70.51
13
2
7
1.00
50
4
47.91
14
2
7
1.5
50
12
71.73
15
2
7
1.00
50
20
64.29
16
2
7
1.00
50
12
75.81
17
2
7
1.00
90
12
87.29
18
2
7
1.00
10
12
39.11
19
2
7
0.5
50
12
64.64
20
2
5
1.00
50
12
75.46
21
2
9
1.00
50
12
35.68
22
2
7
1.00
50
12
73.75
2.6 Photoelectrochemical measurements
The photocurrent and electrochemical impedance spectroscopy (EIS) test were performed under the irradiation of blue light using an electrochemical workstation (302-N, Netherlands) in a standard three-electrode cell equipped with a working electrode, a platinum sheet as the counter electrode and an Ag/AgCl (saturated KCl) electrode as the reference electrode. The working electrode with an active area of ca. 0.75 cm × 0.75 cm prepared as followed: 10 mg of as-prepared photocatalyst were suspended in 2 mL deionized water with 0.1 mL Nafion dispersion, and then the mixture was sonicated for 30 min and spread onto the FTO glass. FTO glass was heated at 120 °C for 2 h. The electrochemical impedance spectroscopy (EIS) was measured at 0.5 V (vs. RHE) in 1.0 mmol L−1 [Fe(CN)6]3−/4− (1:1) solution containing 0.1 mol L−1 KCl with the frequency ranged from 0.1 Hz to 100 kHz. The photocurrent was measured in 0.1 M Na2SO4 aqueous solution as the electrolyte.
3 Result and discussion
3.1 Characterization
The morphology and microstructure of samples were investigated by SEM. Fig. 3 shows the SEM image of CdS, CeO2 and CeO2/CdS-1 samples. The as-prepared CdS sample consists of agglomerated particles (Fig. 3a). Fig. 3b illustrates the SEM image of CeO2 NFs as non-woven forms after which are made by electrospinning method. Histogram of diameters distribution of the CeO2 NFs (Fig. 3c) represents the approximate magnitude of 73.83 ± 15.78 nm which following hydrothermal reaction leads to the formation of CeO2/CdS-1 composite (Fig. 3d and e). CdS are implanted onto CeO2 fibers and bonds in combination with each other and result confirm that CdS well coated on the surface of CeO2 fibers. EDS spectrum of the CeO2/CdS-1 composite (Fig. 3f) confirms the presence of Ce, Cd, S, C and O element in the sample. Overall, the presence of carbon from the decomposition of organic part lead to fast electron transfer and enhanced visible light photocatalytic activity.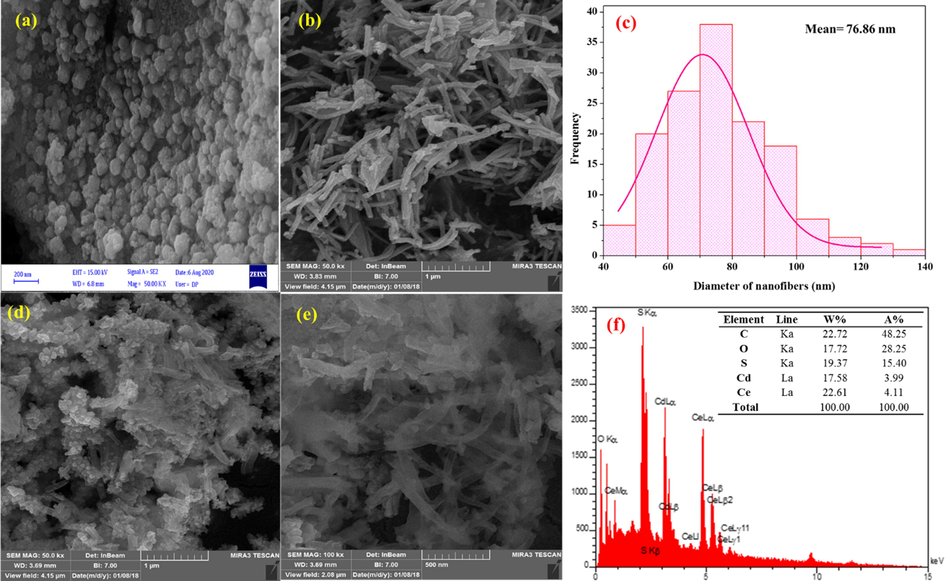
SEM images of CdS nanoparticles (a), CeO2 NFs (b), Histograms of diameters distribution of CeO2 (c), SEM images of CeO2/CdS-1composite (d, e) and EDS spectrum of composite (f).
XRD pattern of CeO2 NFs, CdS and CeO2/CdS-1 as catalyst (Fig. 4a) and reflections of CeO2 phase based on 2θ values of 28.549 (1 1 1), 33.084 (0 0 2), 47.488 (0 2 2), 56.348 (1 1 3), 59.095 (2 2 2), 69.421 (0 0 4), 76.709 (1 3 3), 79.084 (0 2 4) and 88.439 (2 2 4) which ascribed to cubic phase with good agreement with reference code (JCPDS PDF No 96–900-9009). The CeO2 NFs exhibit a strong reflection peak at 2θ = 28.549° at (1 1 1) plane and accordingly based on Bragg’s diffraction equation 2dsinθ = nλ, the interplanar spacing was 3.09299 Å. XRD reflections CdS phase in CeO2/CdS at 2theta values 26.55 (1 1 1), 30.75 (0 0 2), 44.04 (0 2 2), 52.17 (1 1 3) and 54.68 (2 2 2) (reference code: JCPDS PDF No 96–101-1252) are ascribed to Cubic phase. The average crystallite size of the CeO2/CdS photocatalyst was estimated at about 12.03 nm based on the Debye–Scherrer formula (D = 0.9λ/β cosβ). Raman spectra of CeO2/CdS-1 photocatalyst is shown in Fig. 4b. The Raman peak at 598 cm−1 (D-band) is considerable that could be related to the presence of oxygen vacancies and the associated charge imbalance caused by Ce3+ ions in CeO2 (Liu et al., 2018; Mittal et al., 2018). The oxygen vacancies help in achieving good oxygen mobility and an enhancement of the defect sites that has an almost direct relationship with the rate of degradation. Thus, CeO2/CdS photocatalyst could be provided the optimum number of oxygen vacancies for the better photocatalytic activity.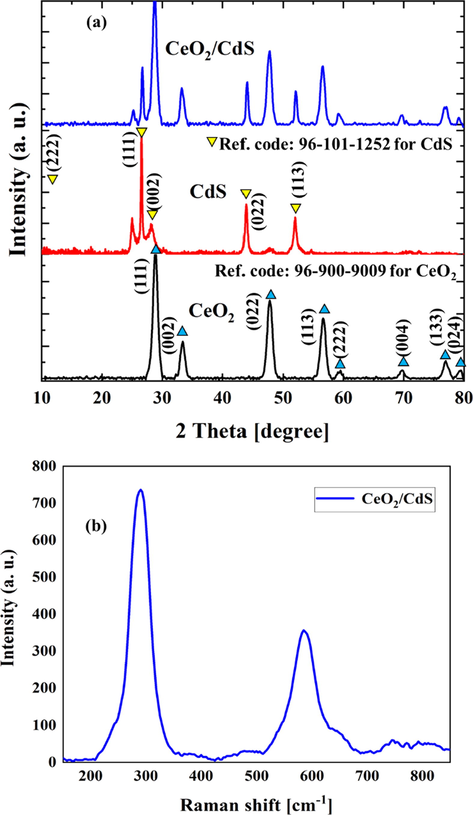
XRD pattern of CeO2, CdS and CeO2/CdS-1 (a) and Raman spectra of CeO2/CdS-1 composite (b).
Diffuse reflectance spectra (DRS) analysis which based on the Kubelka-Munk model obtained during an absorbing test of photocatalyst as follows:
R is the absolute reflectance of the sample hν (eV) and its relationship to the wavelength λ (nm) becomes hν = 1239.7/λ. For indirect transition, the (F(R).hν) 0.5 was plotted against the hν by using the Kubelka-Munk function. The comparison of the solid-state absorption spectra of CeO2 NFs, CdS and CeO2/CdS-1 composite are shown in Fig. 5a. Compared to other samples, the CeO2/CdS composite possess higher absorption in the visible region. The intercept of the plot between (F(R).hν)0.5 vs hν gives the bandgap energy of photocatalyst (Fig. 5a). The absorption spectrum of bare CeO2 and CdS show absorption edge corresponding to a band gap of 3.1 and 2.24 eV, respectively. The CeO2/CdS composite photocatalysts indicates a shift in the visible region and its bandgap is around 2.3 eV. Fig. 5b illustrates the N2 adsorption–desorption isotherms and the pore size distribution curves of CeO2/CdS-1 composite. The BET specific surface areas of CeO2/CdS composite calculated from the results of N2 adsorption–desorption is 38.32 m2/g. The mesoporosity of this composite was studied by N2 adsorption at 77 K (Fig. 5b). The result exhibited the existence of mesoporous structure formed by the aggregation of both NF and particles by the aggregation of small particles.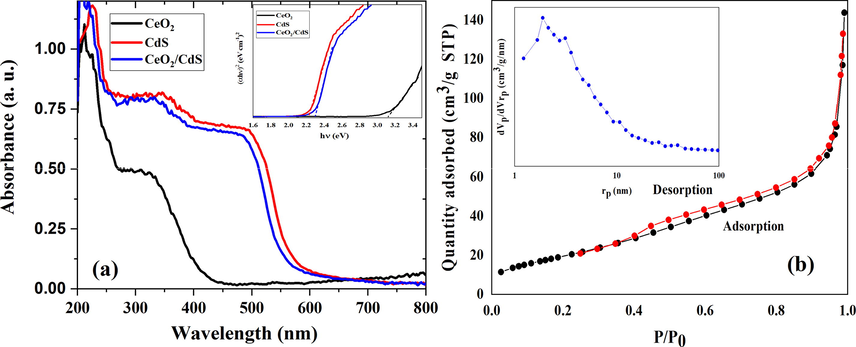
DRS of CeO2, CdS and CeO2/CdS-1 (F(R). hυ)0.5 of samples by Kubelka-Munk function for allowed indirect transitions (a) the BET surface area from N2 adsorption–desorption isotherms and the pore size distribution (b).
The FT-IR spectrum of the prepared NF in the range of 300–4000 cm−1 (Fig. 6a) reveals the presence of functional groups and organic compounds in as-spun, CeO2 and CeO2/CdS-1 composite, respectively. As shown in Fig. 6a, absorbance peaks at near 3400 cm−1 are due to the stretching mode of the hydroxyl part of the physically adsorbed water or in the coverage of hydrogen-bonded surface OH groups (Chen et al., 2003). Organic groups related to C–C and C–O bonds are in the range 800 to 1800 cm−1 and are owing to PVP (Yang et al., 2004; Khorami et al., 2011). Calcination leads to a decrease in peak intensities around 1600. The peaks at 1800 and 3000 cm−1are owing to the vibration of the carbonyl group (-C = O) and methylene group (–CH2-), respectively. As seen in Fig. 6a, the absorption band near 538 and 1380 cm−1 corresponds to the vibrational mode of Ce–O and Ce–O–Ce, respectively (Yan and Zhu, 2008; Sabzehmeidani et al., 2019). The FT-IR spectrum of CeO2/CdS shown in Fig. 6a consists of C = S stretching vibration of thiourea at near 650 cm−1 and band at around 506 cm−1 corresponds to the Cd-S stretching frequency (Ivanda et al., 2007). The photoluminescence (PL) spectrum was used to further evaluate the ability of charge transition and separation (Zhu et al., 2017). PL spectroscopy was carried out an excitation wavelength of 350 nm to check the separation of photogenerated carriers in the photocatalysts. As shown in Fig. 6b, CeO2 NFs illustrated high PL intensity owing to the quick recombination of photo-generated electrons and holes. CeO2 NFs illustrated a wide PL spectrum in the wavelength range of 350–550 nm, which could be ascribed to surface oxygen vacancies and defects (Murugan et al., 2016). The emission intensity of CeO2/CdS composite is much lower than CeO2 and CdS. The intense quenching of the emission illustrates the structure of the CeO2/CdS composite is reasonable and could efficiently suppress the recombination of charges.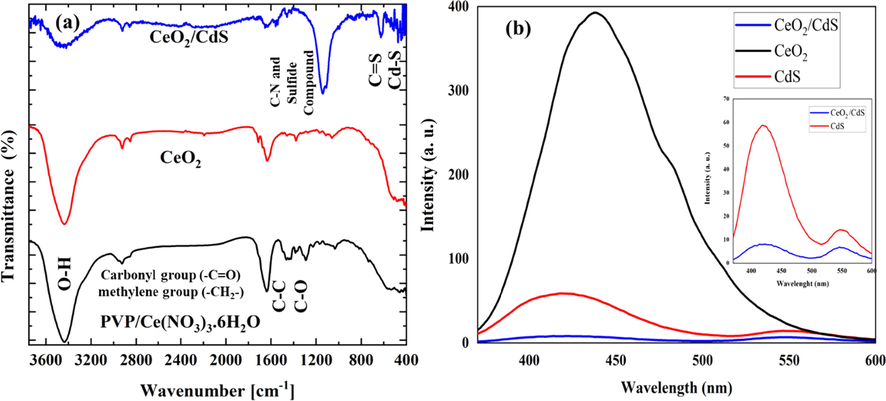
FTIR of as-spun NF PVP/ Ce(NO3)3·6H2O, CeO2 and CeO2/CdS-1 (a), PL of , CeO2 NF, CdS and CeO2/CdS-1 (b).
3.2 Photocatalytic studies
3.2.1 Experimental design and quadratic model
The experimental results correspond to RB photo-degradation in aqueous solutions with CeO2/CdS-1 composite as photocatalyst are presented in Table 2. The response surface model corresponding to the degradation percentage with independent variables made to fit the experimental data. Analysis of variance method was applied to detect the main factors and the interactions among them (Noorimotlagh et al., 2014) while ANOVA is a reliable approach to calculate the quality of the fitted model and judgment about the significance of variable and such term is done based on p-value and F-value (Asfaram et al., 2015). The validity of the model demonstrates the significant value of the quadratic model and non-significant value for lack of fit. Table. 2 indicate the “Model F-value” for RB photo-degradation with CeO2/CdS is 69.52, while its lack-of-fit (LOF) is not significant and equals 0.0699 and “Lack of Fit F-value” is 5.18. The adjusted and predicted R2 were 0.9762 and 0.7451 for RB due to the good relationship between the observed data and predicted values. The adequate precisions (signal to noise ratio) for RB was found to be 25.99. The equation model in terms of coded factors is demonstrated in the following equations:
Source
SSa
DFb
MSc
F -Value
p-value
Block
78.9918
1
78.9918
Model
4597.482
12
383.1235
69.52766
<0.0001
significant
X1
1569.348
1
1569.348
284.7988
<0.0001
X2
41.0881
1
41.0881
7.456498
0.0258
X3
1804.975
1
1804.975
327.5594
<0.0001
X4
134.1522
1
134.1522
24.34538
0.0011
X1X2
20.6116
1
20.6116
3.740508
0.0892
X1X3
1.445
1
1.445
0.262233
0.6224
X2X3
4.6208
1
4.6208
0.838564
0.3866
X3X4
100.9621
1
100.9621
18.32217
0.0027
X12
529.0095
1
529.0095
96.00245
<0.0001
X22
46.78662
1
46.78662
8.490641
0.0195
X32
174.9267
1
174.9267
31.74497
0.0005
X42
498.2388
1
498.2388
90.41831
<0.0001
Residual
44.083
8
5.510375
Lack of Fit
36.95773
4
9.239432
5.186849
0.0699
not significant
Pure Error
7.125275
4
1.781319
Cor Total
4720.557
21
Std. Dev.
Mean
C.V. %
PRESS
R2
Adj R2
Pred R2
Adeq Precision
RB
2.3474
65.6427
3.5760
1755.057
0.990
0.976
0.745
25.9960
Where PDE is the photo-degradation efficiency (%). Fig. 7a illustrates the factor standardized effect on the photocatalytic response in the Pareto chart using the length of each bar in the chart. The negative or positive sign reveals that the response to variables (PDE% RB) responded direction of signal change. In Fig. 7a, the irradiation time has the most remarkable contribution to RB photo-degradation efficiency and it extends beyond the red line that demonstrates confidence level within 95%. The results confirm that the factors of X1 and X3, as well as the quadratic effects of X12 and X42, are the most effective factors. Fig. 7b shows the predicted results vs. actual RB photo-degradation percentage by CeO2/CdS-1 that confirm actual data have good agreement with the predicted results using the polynomial equations.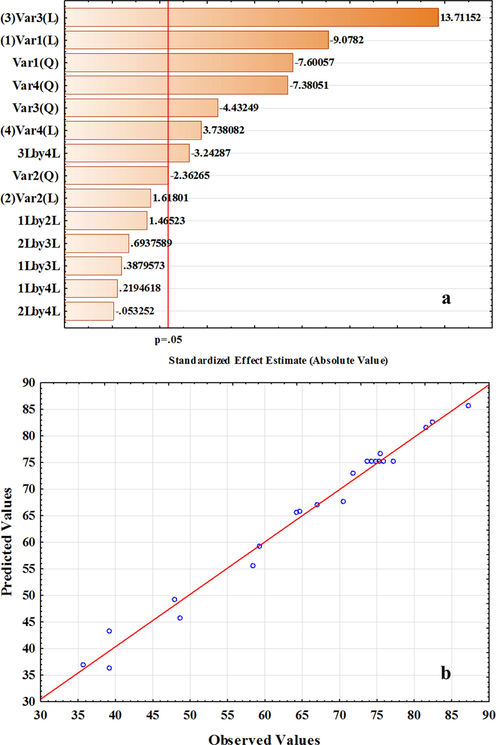
Pareto chart of standardized effects (a) and experimental versus predicted data functions (b) for photo-degradation of RB by CeO2/CdS-1.
3.2.2 Response surface plots
The three-dimensional RSMs applied to show the combined effects and identify the main interactions among variables on the photocatalytic efficiency of RB by CeO2/CdS-1. Fig. 8 demonstrates a 3D surface response that assigns to two factors at a constant level of other factors. Fig. 8a indicates the interaction of photocatalyst dosages and pH of the solution, while increasing CeO2/CdS photocatalyst dosages lead to enhance in the degradation due to more available surface area and relatively extensive generation of hydroxyl (OH) radicals that both phenomena cause enhancement of the mass transfer. The maximum photocatalytic degradation percentage of RB was achieved at near acidic pH (pH = 6) by CeO2/CdS composite (Fig. 8a). The CeO2/CdS surface is positively charged in acidic media and enhancement of photocatalytic degradation is probably due to electrostatic attraction of the positive charge of CeO2/CdS surface which strongly attracts anionic dye. Fig. 8b confirms that the photo-degradation efficiency increases as by its initial concentration and optimum initial RB concentration to achieve maximum photo-degradation efficiency was 12.0 mg.L−1. The results reveal that at higher concentration lower photo-degradation percentage was achieved owing to the decreases in the number of existing and activated sites and increases in the content of available light by the RB molecules. Results indicate that an increase in visible light irradiation time leads to RB degradation steadily owing to a high contact time of the photocatalytic process among free radicals and dye molecules (Fig. 8b).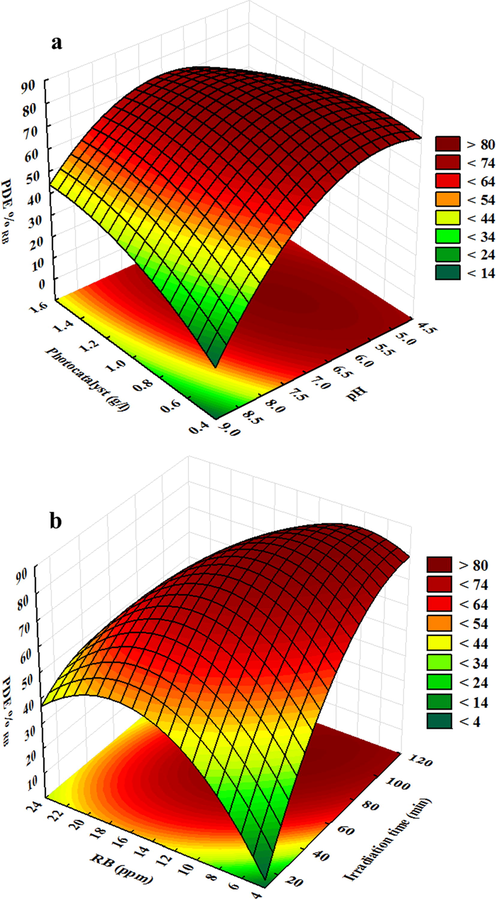
Response surface plots for degradation of RB dye by CeO2/CdS-1.
3.2.3 Optimization condition study
Profiles of predicated and method of desirability functions were used to obtain the maximum photo-degradation of RB dye with CeO2/CdS-1 composite (Fig. 9). In the desirability function, each response was converted to an individual desirability function in the range of 0 and 1 (Wang and Wan, 2009). The results reveal that maximum photo-degradation RB b CeO2/CdS-1 is 88.07% with DF = 1. The optimal value correspond to maximum photo-degradation of RB is irradiation time of 70 (min), 12.0 (mg L−1) RB, CeO2/CdS-1 dosage of 1 (g L−1) and pH of 6.0. The relationship between desirability function and involve variables (pH, photocatalyst dosage, time irradiation and initial concentration of RB) are shown in Fig. 9.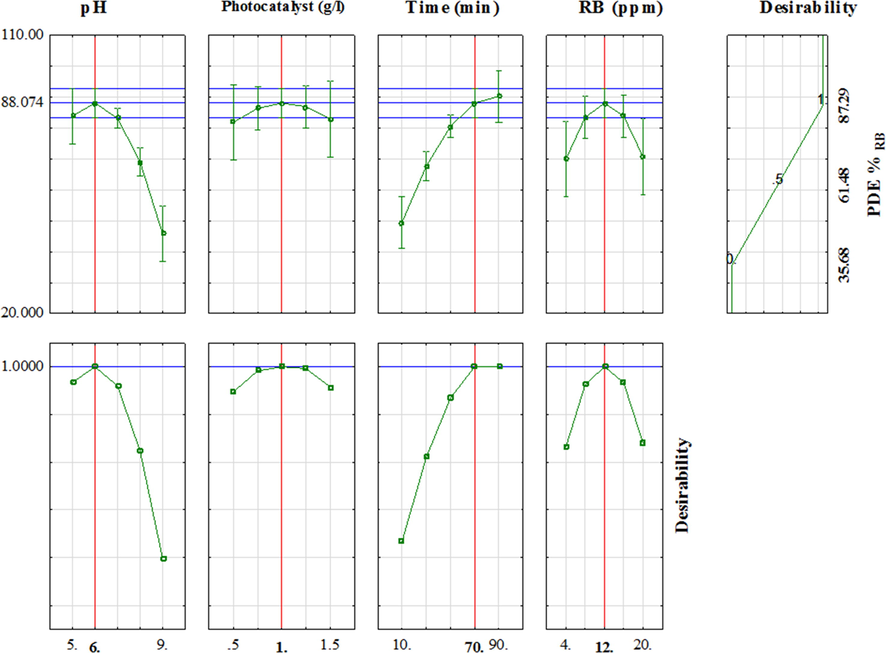
Profiles of predicated values and desirability functions for degradation of RB dyes (Red line shows optimum values).
3.2.4 Regeneration and kinetic study
Fig. 10a illustrates the adsorption and photolytic and photocatalytic degradation profiles of RB in the same conditions. The results indicate adsorption of the RB aqueous solution relatively low in the presence of CeO2/CdS-1. Photolysis with air and without air is lead to approximately 25% of degradation within 80 min of irradiation. While photo-degradation of the RB dye by CeO2/CdS was dramatically improved to the maximum value around 90%. The degradation rates obtained were 0.026 min−1, 0.0214 min−1, 0.0186 min−1, 0.0172 min−1, 0.0046 min−1, 0.0039 min−1 and 0.0025 min−1 for CeO2/CdS-1, CeO2/CdS-2, CeO2/CdS-3, CdS, CeO2, photolysis and photolysis by air, respectively (Fig. 10b).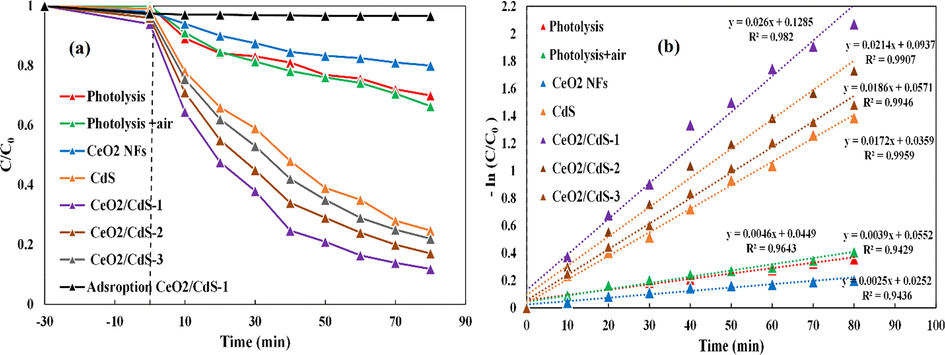
Photocatalytic degradations of RB in optimum conditions by CeO2, CdS and CeO2/CdS (a), the corresponding rate constant k values (b).
The reusability of the photocatalyst is a very significant factor for practical applications. Fig. 11a indicates the reusability of the CeO2/CdS-1 photocatalyst for the degradation of RB was investigated in five cycles under visible-light (LED) irradiation. The CeO2/CdS-1 photocatalyst was reused for five cycles and the obtained photo-degradation efficiency was 83.6, 77.4, 70.3, 66.2 and 61.4%. After each cycles, the efficiency of the CeO2/CdS-1 decline which represents weak stability and reusability of understudy photocatalyst. The FTIR spectra of CeO2/CdS before and after photocatalytic degradation of RB in aqueous solution was showed Fig. 11b. The results indicate that the decrease of peak intensity and slight shift towards the higher wavelength in the region between 3700 and 3300 cm−1, which could be related to the free –OH group. The FTIR spectrum observed for the CeO2/CdS composite revealed bands at 1040 and 1116 cm−1 which correspond to stretching of C–N, sulfide compounds, respectively. The decrease in the intensity of the peaks around 1116 cm−1 after the degradation could be related to the destruction of the C–N, sulfide bonds (Pandian et al., 2011). Fig. 11c illustrates the SEM image of CeO2/CdS composite after degradation test. The present composite was broken into much shorter ones.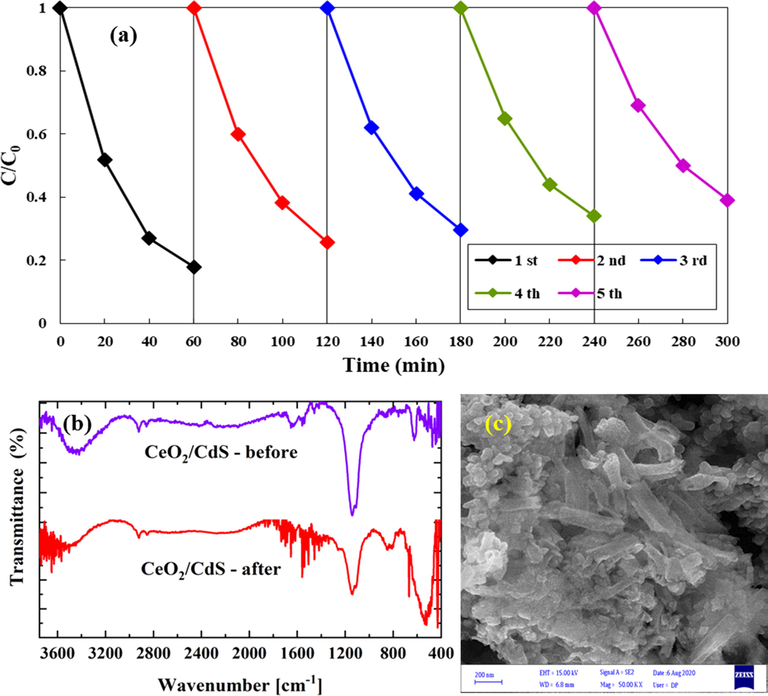
Reusability of CeO2/CdS-1photocatalyst under visible-light irradiation (a), FTIR before and after degradation (b) and SEM after degradation (c).
The photo-degradation kinetics and the respective rates applied to assess the possibility of heterogeneous nature for photocatalytic degradation. Also, the important stage for designing a photocatalyst reactor is the photo-degradation study. Generally, understudy dye photo-degradation was modeled by Langmuir-Hinshelwood (L-H) equation and also to calculate the adsorption properties of photocatalyst surface by first-order kinetic model (De Heredia et al., 2001; Asenjo et al., 2013; Leblebici et al., 2015; Behnajady et al., 2006) accordingly to the following concentration–time equation is obtained:
Where C0 and Ct are the initial concentration and concentration (mg/L) at time t (min) and kobs (min−1) is the first-order rate constant using Eq. (4) as first-order reaction for RB decomposition by CeO2/CdS photocatalyst. Fig. 12a shows that plotting the ln(C0/Ct) versus the irradiation time (at the optimal condition) is linear and accordingly a sufficient line with the regression of 0.981 was achieved. According to L-H model reaction among solid–liquid interface may be described as follow:
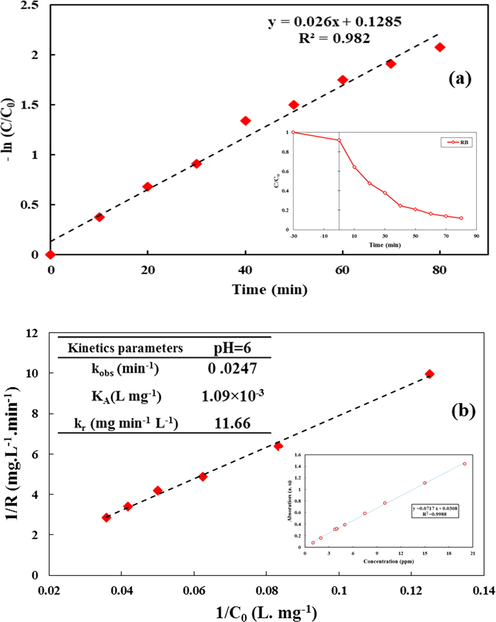
Plots of the L-H kinetic model, for RB dye using CeO2/CdS-1: ln(C0/Ct) vs. irradiation time (C/C0 RB vs. time is inserted in this Figure) (a) and 1/R vs. 1/C0 (calibrating absorption spectra versus RB concentration is inserted in this Figure) (b).
Where kr (mg min−1 L−1) is the apparent photo-degradation rate constant, Ks and K are the adsorption coefficient of the solvent and dye, respectively. C0 and Cs are the initial concentrations of the substrate and solvent at t = 0 in the case of the degradation of the organic compound in the reactor. The final kinetic rate equation can be arranged as follows:
KA is defined by KA = K/ (1 + Ks Cs) and KA and kr for photo-degradation of RB dye by CeO2/CdS were calculated from experimental data. kr and KA are apparent photocatalytic degradation rate constants for RB that were calculated as 11.66 mg L−1 min−1 and 1.09E-3 Lmg−1, respectively (See Fig. 12b).
3.2.5 Photoelectrochemical response
As shown in Fig. 13a, the diameter of the semicircular plot is proportional to the electron-transfer resistance. The bare CdS on the FTO glass showed a larger semicircle compared with that of the CeO2 NFs and CeO2/CdS-1, indicating that the CeO2/CdS-1 showed higher electron-transfer resistance. The results exhibit that the CeO2 NFs has smaller semicircle than of the CdS, indicating faster the electron-transfer due to the presence of carbon that related to calcination of PVP. Overall, the EIS of CeO2/CdS composite showed a smaller semicircle than of the CeO2 NFs and CdS, indicating the CeO2/CdS could lower the electron-transfer resistance. The photocurrent responses of CdS, CeO2 NFs and CeO2/CdS-1 on the FTO glass under blue LED light irradiation were evaluated to information for the separation and transfer efficiency of photogenerated electrons and holes. The transient photocurrent responses of all samples at the light on and light off are reversible and almost stable, as shown in Fig. 13b. The photocurrent of CeO2/CdS is much higher than that of CdS and CeO2 NFs. The results indicate that the separation of photogenerated charge carriers and excellent visible-light photocatalytic performance is obtained.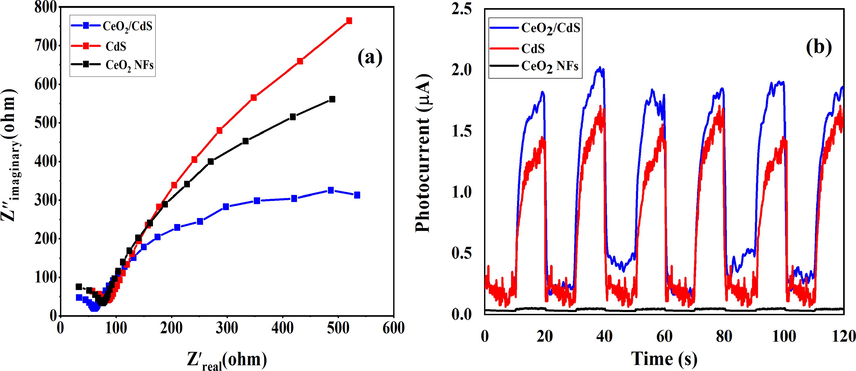
EIS spectra of CeO2 NFs, CdS and CeO2/CdS-1 (a) and photocurrent responses (b).
3.2.6 Proposed mechanism of RB degradation by CeO2/CdS
The diagram of RB photo-degradation and the e-h transfer of n-type CeO2/n-type CdS schematically shown in Fig. 14. After contact, due to the flatband potential of CdS is more negative than that of CeO2 NFs, at an n–n heterojunction located at the juncture between CeO2 NFs and CdS, the electrons keep on flowing from CdS and CeO2 NFs until the Fermi levels become coincident, could make an accumulation of negative charges in the CeO2 NFs region and a positive section in the CdS region in the vicinity of the junction. The internal electrostatic field directed from the CdS region to the CeO2 NFs region, making an energy barrier for the electron transfer from CdS to CeO2 NFs and built the band diagram for the n–n CeO2 -CdS heterojunction at equilibrium. As shown in this figure, the conduction band (CB) and valence band (VB) of CdS were more negative than those of CeO2 NFs and the CB potentials of CeO2 and CdS were both negative than the standard redox potential of O2/O2•−. In addition, Ce4+ in CeO2 NFs would accept an electron at the CB and form Ce3+, which would generate an oxygen vacancy (OV) state slightly below the CB edge potential position that could be played a major role in improvement of the photocatalytic activities. Under irradiation of visible light, the vacancy states might also promote visible-light absorption and the generation of photoexcited electron-hole pairs. Also, the standard redox potential of •OH/OH– was positive to the VB of CdS. The photo-generated electrons on irradiated CeO2/CdS composite can reduce O2 to give O2•− (Sun et al., 2013; Gu et al., 2015). The schematic indicates the energy band gap structure and charges transfer mechanism. Under blue LED light irradiation, the both electrons and holes as carriers could be generated in the CB and VB. The carriers transfer takes place among CeO2 and CdS due to their carriers gradient. The electrons are excited from the VB to CB of CdS, leaving behind holes in the VB. The photo-generated electrons in the CB of CdS were rapidly transferred to the CB of CeO2. The electrons reacted with oxygen (O2) to produce superoxide radicals (•O−2). Also, holes in the VB of CeO2 were rapidly transferred to the VB of CdS and can hardly oxidize OH to give •OH and can directly oxidize the RB to degradation. All radicals can degrade the dye to produce CO2, H2O as harmless substances (Liu et al., 2015).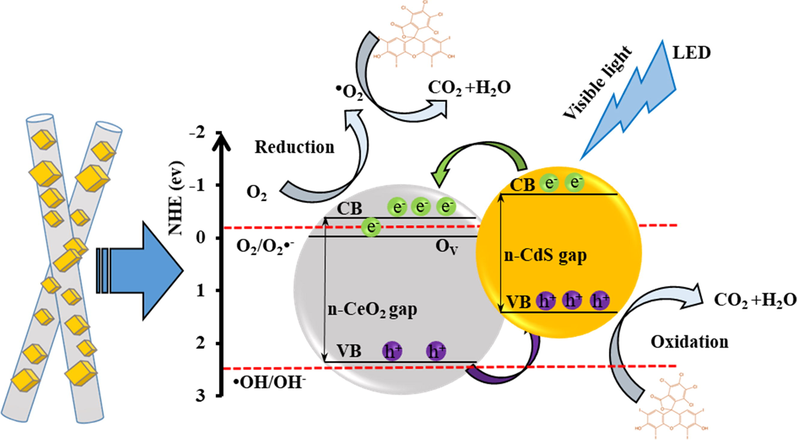
Schematic diagram of photocatalytic degradation of RB by e-h transfer on photocatalysts.
3.2.7 Comparison of photocatalysts
A comparison efficiency of RB photocatalytic degradation by CeO2/CdS and formerly reported photocatalyst is represented in Table 3. The results indicate that photo-degradation for CeO2/CdS is suitable and shows reasonable photo-degradation performance for RB. The photocatalytic degradation of CeO2/CdS are depend on the structure of the n-n heterojunction system which decreases the recombination of electron-hole pairs.
Photocatalyst
Pollutants
Dye concentration (ppm)
Time (min)
Degradation (%)
References
ZnO
RB
10
60
∼80%
(V. C., M.N.C. Prabha, M.A.L.A. Raj, 2016)
Fe doped NiO
RB
5
60
85%
(Khatri and Rana, 2020)
Methylene Blue
5
60
86%
Sm doped CeO2
RB
5
90
90%
(Chahal et al., 2020)
Aligned silicon nanowires
RB
10
90
∼96%
(Ameen et al., 2016)
CuO-Pb2O3
RB
–
90
∼99%
(Kamaraj et al., 2018)
LaMnO3
RB
15
60
95%
(Kumar et al., 2017)
carbon, nitrogen and sulphur-doped TiO2
RB
20
60
∼100%
(Malini and Allen Gnana Raj, 2018)
CeO2/CdS
RB
12
70
∼80%
Present Study
4 Conclusion
A CeO2/CdS n-n heterojunction composite NFs was successfully synthesized via a facile electrospinning and calcination and hydrothermal method method. The CeO2/CdS photocatalyst exhibited highly enhanced activity under blue LED visible light exposure. DRS analysis indicates that CeO2/CdS n-n heterojunction as composite exhibit more absorption in the visible region than CeO2. RSM has been successfully applied for the modeling, prediction, optimization and interaction of the involved variables for maximum photo-degradation efficiency of RB dye using the experimental data based upon the CCD method. Results indicate CeO2/CdS composites exhibit higher photocurrent density in photocurrent response experiment and smaller charge-transfer resistance in electrochemical impedance spectroscopy (EIS). The formation of CeO2/CdS heterojunction, which decreases the recombination of electron-hole pairs and increased photocatalytic activity. The present work provides a new approach to construct n-n heterojunction photocatalysts and a deeper vision for the photocatalytic degradation activity that would be a promising technology for efficient degradation of dye in wastewater.
References
- Degradation of Orange G and Trypan blue using Ag2C2O4/Ag/g-C3N4 composites as efficient photocatalyst under solar irradiation. J. Photochem. Photobiol. A Chem.. 2020;401:112755
- [CrossRef] [Google Scholar]
- Shifting of the band edge and investigation of charge carrier pathways in the CdS/g-C3N4 heterostructure for enhanced photocatalytic degradation of levofloxacin. New J. Chem.. 2019;43:9784-9792.
- [CrossRef] [Google Scholar]
- Engineering of magnetically separable ZnFe2O4@ TiO2 nanofibers for dye-sensitized solar cells and removal of pollutant from water. J. Alloys Compd.. 2017;723:477-483.
- [CrossRef] [Google Scholar]
- Novel graphene/polyaniline nanocomposites and its photocatalytic activity toward the degradation of rose Bengal dye. Chem. Eng. J.. 2012;210:220-228.
- [CrossRef] [Google Scholar]
- Silicon nanowires arrays for visible light driven photocatalytic degradation of rose bengal dye. J. Mater. Sci. Mater. Electron.. 2016;27:10460-10467.
- [CrossRef] [Google Scholar]
- One dimensional CdS nanowire@TiO2 nanoparticles core-shell as high performance photocatalyst for fast degradation of dye pollutants under visible and sunlight irradiation. J. Colloid Interface Sci.. 2016;479:43-54.
- [CrossRef] [Google Scholar]
- Correct use of the Langmuir-Hinshelwood equation for proving the absence of a synergy effect in the photocatalytic degradation of phenol on a suspended mixture of titania and activated carbon. Carbon N. Y.. 2013;55:62-69.
- [CrossRef] [Google Scholar]
- Response surface methodology approach for optimization of simultaneous dye and metal ion ultrasound-assisted adsorption onto Mn doped Fe3O4-NPs loaded on AC: Kinetic and isothermal studies. Dalt. Trans.. 2015;44:14707-14723.
- [CrossRef] [Google Scholar]
- The effect of sunlight induced surface defects on the photocatalytic activity of nanosized CeO2 for the degradation of phenol and its derivatives. Appl. Catal. B Environ.. 2016;180:391-402.
- [CrossRef] [Google Scholar]
- Electrochemical synthesis and efficient photocatalytic degradation of azo dye alizarin yellow R by Cu/CuO nanorods under visible LED light irradiation using experimental design methodology. Polyhedron.. 2019;158:506-514.
- [CrossRef] [Google Scholar]
- Kinetic study on photocatalytic degradation of C.I. Acid Yellow 23 by ZnO photocatalyst. J. Hazard. Mater.. 2006;133:226-232.
- [CrossRef] [Google Scholar]
- Fabrication, structure, and enhanced photocatalytic properties of hierarchical CeO2 nanostructures/TiO2 nanofibers heterostructures. Mater. Res. Bull.. 2010;45:1406-1412.
- [CrossRef] [Google Scholar]
- Electronic structure and photocatalytic activity of samarium doped cerium oxide nanoparticles for hazardous rose bengal dye degradation. Vacuum.. 2020;172:109075
- [CrossRef] [Google Scholar]
- Hollow-structured hematite particles derived from layered iron (hydro)oxyhydroxide-surfactant composites. J. Mater. Chem.. 2003;13:2266-2270.
- [CrossRef] [Google Scholar]
- Semiconductor-based photocatalytic hydrogen generation. Chem. Rev.. 2010;110:6503-6570.
- [CrossRef] [Google Scholar]
- CdS-CoFe2O4@Reduced Graphene Oxide Nanohybrid: An Excellent Electrode Material for Supercapacitor Applications. Ind. Eng. Chem. Res.. 2018;57:1350-1360.
- [CrossRef] [Google Scholar]
- Oxidation of p-hydroxybenzoic acid by UV radiation and by TiO2/UV radiation: Comparison and modelling of reaction kinetic. J. Hazard. Mater.. 2001;83:255-264.
- [CrossRef] [Google Scholar]
- Dehgani, Z., Ghaedi, M., Sabzehmeidani, M.M., Adhami, E., 2020. Removal of paraquat from aqueous solutions by a bentonite modified zero-valent iron adsorbent, New J. Chem.
- The effect of processing variables on the morphology of electrospun nanofibers and textiles. Polymer (Guildf).. 2001;42:261-272.
- [CrossRef] [Google Scholar]
- Facile preparation of Pt/CdS photocatalyst by a modified photoreduction method with efficient hydrogen production. Int. J. Hydrogen Energy. 2018:2139-2147.
- [CrossRef] [Google Scholar]
- Heterogeneous photocatalytic degradation of organic contaminants over titanium dioxide: A review of fundamentals, progress and problems. J. Photochem. Photobiol. C Photochem. Rev.. 2008;9:1-12.
- [CrossRef] [Google Scholar]
- Co/CeO2-decorated carbon nanofibers as effective non-precious electro-catalyst for fuel cells application in alkaline medium. Ceram. Int.. 2015;41:2271-2278.
- [CrossRef] [Google Scholar]
- Nano-engineered ZnO/CeO2 dots@ CNFs for fuel cell application. Arab. J. Chem.. 2016;9:219-228.
- [Google Scholar]
- CePd-Nanoparticles-Incorporated Carbon Nanofibers as Efficient Counter Electrode for DSSCs. ChemistrySelect.. 2018;3:12314-12319.
- [CrossRef] [Google Scholar]
- Author Correction: Surfactant/organic solvent free single-step engineering of hybrid graphene-Pt/TiO2 nanostructure: Efficient photocatalytic system for the treatment of wastewater coming from textile industries (Scientific Reports, (2018), 8, 1, (14656) Sci. Rep.. 2019;9
- [CrossRef] [Google Scholar]
- Facile synthesis of CeO2 nanoparticle sensitized CdS nanorod photocatalyst with improved visible-light photocatalytic degradation of rhodamine B. RSC Adv.. 2015;5:79556-79564.
- [CrossRef] [Google Scholar]
- A review on polymer nanofibers by electrospinning and their applications in nanocomposites. Compos. Sci. Technol.. 2003;63:2223-2253.
- [CrossRef] [Google Scholar]
- Low wavenumber Raman scattering of nanoparticles and nanocomposite materials. J. Raman Spectrosc.. 2007;38:647-659.
- [CrossRef] [Google Scholar]
- Facile fabrication of CuO-Pb2O3 nanophotocatalyst for efficient degradation of Rose Bengal dye under visible light irradiation. Appl. Surf. Sci.. 2018;433:206-212.
- [CrossRef] [Google Scholar]
- Submerged hollow fiber microfiltration as a part of hybrid photocatalytic process for dye wastewater treatment. Desalination.. 2014;343:106-112.
- [CrossRef] [Google Scholar]
- Visible light assisted photocatalysis of Methylene Blue and Rose Bengal dyes by iron doped NiO nanoparticles prepared via chemical co-precipitation. Phys. B Condens. Matter.. 2020;579:411905
- [CrossRef] [Google Scholar]
- Synthesis of SnO 2 /ZnO composite nanofibers by electrospinning method and study of its ethanol sensing properties. Appl. Surf. Sci.. 2011;257:7988-7992.
- [CrossRef] [Google Scholar]
- Enhanced visible light photocatalytic activity of porous LaMnO3 sub-micron particles in the degradation of rose bengal. Mater. Res. Bull.. 2017;93:270-281.
- [CrossRef] [Google Scholar]
- Ag plasmonic nanostructures and a novel gel electrolyte in a high efficiency TiO2/CdS solar cell. Phys. Chem. Chem. Phys.. 2015;17:10040-10052.
- [CrossRef] [Google Scholar]
- Photocatalytic water treatment by titanium dioxide: Recent updates. Catalysts.. 2012;2:572-601.
- [CrossRef] [Google Scholar]
- Computational modelling of a photocatalytic UV-LED reactor with internal mass and photon transfer consideration. Chem. Eng. J.. 2015;264:962-970.
- [CrossRef] [Google Scholar]
- Electrospinning of CeO2-ZnO composite nanofibers and their photocatalytic property. Mater. Lett.. 2011;65:1327-1330.
- [CrossRef] [Google Scholar]
- High photocatalytic activity material based on high-porosity ZnO/CeO 2 nanofibers. Mater. Lett.. 2012;80:145-147.
- [CrossRef] [Google Scholar]
- Controlled assemble of hollow heterostructured g-C3N4@CeO2 with rich oxygen vacancies for enhanced photocatalytic CO2 reduction. Appl. Catal. B Environ.. 2019;243:566-575.
- [CrossRef] [Google Scholar]
- Planar-dependent oxygen vacancy concentrations in photocatalytic CeO2 nanoparticles. CrystEngComm.. 2018;20:204-212.
- [CrossRef] [Google Scholar]
- Facile preparation of yolk-shell structured Si/SiC@C@TiO2 nanocomposites as highly efficient photocatalysts for degrading organic dye in wastewater. RSC Adv.. 2016;6:4063-4069.
- [CrossRef] [Google Scholar]
- Vertical single or few-layer MoS2 nanosheets rooting into TiO2 nanofibers for highly efficient photocatalytic hydrogen evolution. Appl. Catal. B Environ.. 2015;164:1-9.
- [CrossRef] [Google Scholar]
- Electrospinning fabrication of ZnWO4 nanofibers and photocatalytic performance for organic dyes. Dye. Pigment.. 2017;136:1-7.
- [CrossRef] [Google Scholar]
- Facile Hydrothermal Synthesis of ZnWO 4 for Enhanced Photocatalytic Performance. J. Nanosci. Nanotechnol.. 2018;18:7241-7245.
- [CrossRef] [Google Scholar]
- Enhanced Hydrogen Production from DNA-Assembled Z-Scheme TiO2-CdS Photocatalyst Systems. Angew. Chem. - Int. Ed.. 2015;54:11490-11494.
- [CrossRef] [Google Scholar]
- G.C,N and S-doped TiO2-characterization and photocatalytic performance for rose bengal dye degradation under day light. J. Environ Chem. Eng.. 2018;6:5763-5770.
- [CrossRef] [Google Scholar]
- Rose bengal-sensitized photooxidation of 2-chlorophenol in water using solar simulated light. Water Res.. 2005;39:412-422.
- [CrossRef] [Google Scholar]
- Role of oxygen vacancies in Ag/Au doped CeO2 nanoparticles for fast photocatalysis. Sol. Energy.. 2018;165:206-216.
- [CrossRef] [Google Scholar]
- Photodegradation of rose bengal using MnO2 (manganese dioxide) Rasayan J. Chem.. 2009;2:516-520.
- [Google Scholar]
- Enhancement of room temperature ferromagnetic behavior of rf sputtered Ni-CeO 2 thin films. Appl. Surf. Sci.. 2016;390:583-590.
- [CrossRef] [Google Scholar]
- Adsorption of a textile dye in aqueous phase using mesoporous activated carbon prepared from Iranian milk vetch. J. Taiwan Inst. Chem. Eng.. 2014;45:1783-1791.
- [CrossRef] [Google Scholar]
- Biologically synthesized fluorescent CdS NPs encapsulated by PHB. Enzyme Microb. Technol.. 2011;48:319-325.
- [CrossRef] [Google Scholar]
- Hetero-nanostructured metal oxide-based hybrid photocatalysts for enhanced photoelectrochemical water splitting – A review. Int. J. Hydrogen Energy.. 2019;45:18331-18347.
- [CrossRef] [Google Scholar]
- Sonophotocatalytic treatment of rhodamine B using visible-light-driven CeO 2 /Ag 2 CrO 4 composite in a batch mode based on ribbon-like CeO 2 nanofibers via electrospinning. Environ. Sci. Pollut. Res.. 2019;26:8050-8068.
- [CrossRef] [Google Scholar]
- Visible light-induced photo-degradation of methylene blue by n–p heterojunction CeO2/CuS composite based on ribbon-like CeO2 nanofibers via electrospinning. Polyhedron.. 2019;170:160-171.
- [CrossRef] [Google Scholar]
- Enhanced visible light-active CeO2/CuO/Ag2CrO4 ternary heterostructures based on CeO2/CuO nanofiber heterojunctions for the simultaneous degradation of a binary mixture of dyes. New J. Chem.. 2020;44:5033-5048.
- [CrossRef] [Google Scholar]
- Sahay, R., Suresh Kumar, P., Aravindan, V., Sundaramurthy, J., Chui Ling, W., Mhaisalkar, S.G., Ramakrishna, S., Madhavi, S., 2012. High aspect ratio electrospun CuO nanofibers as anode material for lithium-ion batteries with superior cycleability, J. Phys. Chem. C. 116 (2012) 18087–18092. https://doi.org/10.1021/jp3053949.
- Bismuth vanadate hollow spheres: Bubble template synthesis and enhanced photocatalytic properties for photodegradation. Appl. Catal. B Environ.. 2013;132–133:304-314.
- [CrossRef] [Google Scholar]
- Catalytic properties of ceria and CeO2-Containing materials. Catal. Rev. - Sci. Eng.. 1996;38:439-520.
- [CrossRef] [Google Scholar]
- V. C., M.N.C. Prabha, M.A.L.A. Raj, Green mediated synthesis of zinc oxide nanoparticles for the photocatalytic degradation of Rose Bengal dye. Environ. Nanotechnol., Monit. Manag. 6 (2016) 134–138. https://doi.org/10.1016/j.enmm.2016.09.004.
- Application of desirability function based on neural network for optimizing biohydrogen production process. Int. J. Hydrogen Energy.. 2009;34:1253-1259.
- [CrossRef] [Google Scholar]
- Heterogeneous p-n Junction CdS/Cu2O Nanorod Arrays: Synthesis and Superior Visible-Light-Driven Photoelectrochemical Performance for Hydrogen Evolution. ACS Appl. Mater. Interfaces.. 2018;10:11652-11662.
- [CrossRef] [Google Scholar]
- TiO2 nanotube array-graphene-CdS quantum dots composite film in z-scheme with enhanced photoactivity and photostability. ACS Appl. Mater. Interfaces.. 2014;6:13157-13166.
- [CrossRef] [Google Scholar]
- Hierarchical porous CdS nanosheet-assembled flowers with enhanced visible-light photocatalytic H2-production performance. Appl. Catal. B Environ.. 2013;138–139:299-303.
- [CrossRef] [Google Scholar]
- Controlled synthesis of CeO2 nanoparticles using novel amphiphilic cerium complex precursors. J. Nanopart. Res.. 2008;10:1279-1285.
- [CrossRef] [Google Scholar]
- SrTiO3 nanocubes decorated with Ag/AgCl nanoparticles as photocatalysts with enhanced visible-light photocatalytic activity towards the degradation of dyes, phenol and bisphenol A. Environ. Sci. Nano.. 2017;4:585-595.
- [CrossRef] [Google Scholar]
- Preparation and characterization of ZnO nanofibers by using electrospun PVA/zinc acetate composite fiber as precursor. Inorg. Chem. Commun.. 2004;7:176-178.
- [CrossRef] [Google Scholar]
- The absolute energy positions of conduction and valence bands of selected semiconducting minerals. Am. Mineral.. 2000;85:543-556.
- [CrossRef] [Google Scholar]
- Growth of NiO nanorods, SiC nanowires and monolayer graphene: Via a CVD method. Green Chem.. 2017;19:5599-5607.
- [CrossRef] [Google Scholar]
- Light-Assisted Preparation of a ZnO/CdS Nanocomposite for Enhanced Photocatalytic H2 Evolution: An Insight into Importance of in Situ Generated ZnS. ACS Sustain. Chem. Eng.. 2015;3:969-977.
- [CrossRef] [Google Scholar]
- Carbon dots enhance the stability of CdS for visible-light-driven overall water splitting. Appl. Catal. B Environ.. 2017;216:114-121.
- [CrossRef] [Google Scholar]
- Enhancement of full-spectrum photocatalytic activity over BiPO4/Bi2WO6 composites. Appl. Catal. B Environ.. 2017;200:222-229.
- [CrossRef] [Google Scholar]


