

Translate this page into:
Characterization and electrochemical deposition of natural melanin thin films
⁎Corresponding author. alaref@ksu.edu.sa (Amel Laref)
-
Received: ,
Accepted: ,
This article was originally published by Elsevier and was migrated to Scientific Scholar after the change of Publisher.
Peer review under responsibility of King Saud University.
Abstract
Melanin is an important class of biological pigments because of its distinct chemical and physical properties. The electrochemical deposition of natural melanin thin films was studied using two different techniques; constant potential and cyclic voltammetry along with a deposition time of five hours. The thin films deposited electrochemically on a fluorine-doped tin oxide conductive glass substrate using the constant potential method, exhibited faster growth rate and better adhesion to the fluorine-doped tin oxide working electrodes than those deposited using the cyclic voltammetry method. The thin films deposited on the fluorine-doped tin oxide conductor glass using the constant potential method were also more homogeneous than those deposited via the cyclic voltammetry technique. The increase of film thickness is related to the increase of electrochemical deposition time. Interestingly, the electrochemical deposition using the constant potential method had the advantage of consuming less electric charge. The physical and chemical structures of the melanin thin films were characterized using ultraviolet–visible absorption spectroscopy, Fourier-transform infrared spectroscopy, and X-ray diffraction analysis. The ultraviolet–visible absorption spectra showed the correlation between the variation of deposition rates of melanin and the type of electrochemical technique employed as well as the thickness of the film. The average thickness of the film is 500 nm which absorb 40% of light in both type of films. The atomic force microscopy images illustrated the homogeneous deposition of the melanin molecules on the fluorine-doped tin oxide conductive glass substrate, indicating that the thickness of the thin films can be controlled. We estimated an average grain size of 14.093 Å. The ease of preparing such thin films of organic materials can open new avenues towards the use of soft conductors, in contrast to the complex preparation of industrial semiconductors.
Keywords
Melanin
Electrochemical deposition
Thin films
Soft conductor
Energy storage

1 Introduction
Melanin lies at a large scale in animates things in the world. The natural pigments that exist in human and animals contain a large number of Melanin, one of the biggest classes (Meredith and Sarna, 2006; Yang and Wudl, 2009). It’s location is in epidermis and hair. In addition, it is found in the substantia nigra of the brain, middle ear and the retina that are the areas of high nerve activities (Stark et al., 2003; Tanaka et al., 2001). The protective function against harms of solar radiations is its major biological role due to its visible absorption spectrum and broad ultraviolet (UV) (Szpoganicz et al., 2002; Brenner and Hearing, 2008; Ortonne, 2002). The in-vivo structure of melanin, which is formed by the enzymatic oxidation of tyrosine, is still largely unknown. There is agreement that the primary structure of melanin involves macromolecules consisting of 5,6-dihydroxyindol (DHI) and its 2-carboxylated form 5,6-dihydroxyindole-2-carboxylic acid (DHICA) (Fig. 1) (Napolitano et al., 1996; Powell et al., 2004). The electrical conductivity is one of the most important properties in terms of its technological applications, which include solar cell sensitizers, memory devices, and light emitting diodes. Many of the electrical properties of melanin, such as its electrical conductivity (Morresi et al., 2010), photoconductivity (Ligonzo et al., 2009); Highest Occupied Molecular Orbital.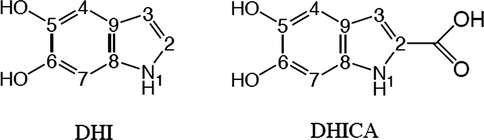
The basic monomers of melanin (DHI and DHICA) (Bloisi et al., 2011).
(HOMO)–Lowest Unoccupied Molecular Orbital (LUMO) gap, and electron/proton recombination time (Newman and Kolter, 2000), have been elucidated experimentally. Over the last three decades, many studies have investigated the dependence of the electrical conductivity of melanin upon the relative humidity (Jastrzebska et al., 1995). According to their findings, a change in the conductive behavior is observed between 10−5 and 10−13 S/cm, which is known as the Jastrzebska model (Jastrzebska et al., 1996). According to this mechanism, melanin acts as an amorphous semiconductor. Recently, Mostert et al. (2012) reformulated the Jastrzebska model using the relationship between the conductivity and the semiquinone content of a synthetic dopa melanin, which is related to hydration levels depending on pH. These results underscored the hybridized behavior of melanin.
The revolution in thin film coatings with multiple electronic functionalities has enabled further progress into various aspects of melanin research, particularly via the use of electrochemical methods to characterize novel electrical properties of melanin. It functions like a main conducting polymer; a conjugated polymer backbone. It is because Melanin contains covalently linked dihydroxyindole units (Rubianes, 2001). It is, therefore, we believe that it will probably act just like of polyindole that is a conducting polymer. It was suggested that electro-oxidation of L-dopa via an electrochemical process at a constant potential, would produce melanin with the properties of a heterogeneous system. The resultant system was a mixture of quinones and other intermediate products (Napolitano et al., 1996). (Meredith and Sarna, 2006) In a report by Clark et al. (1990), Yang and Wudl (2009) natural melanin (extracted from Sepia officinalis) was compared with synthetic melanin chemically synthesized from various precursors, including dopa, DHICA, and DHI. They discovered that the elemental composition and functional group distribution of L-dopa-melanin is analogous to that of natural melanin. Researchers have studied thin films of melanin prepared using different techniques such as spin coating (Bothma et al., 2008); (Bloisi et al., 2011) and electrochemical deposition (Kim et al., Feb. 2011). The preparation of homogeneous films of melanin is difficult due to its poor solubility.
The dye-sensitized solar cells (DSSCs) are considered the best substitutes for economical electronic devices as they have achieved highest efficiency record from 7% to 14% since last few years. In solar cell market, organic materials have become far more valuable. A number of organic materials have been used in DSSC for the improvement in cell efficiency, reduction in production cost and enhancement in cell fabrication. One more major feature of Melanin is its natural photo-protective agency because it possesses a wider range of absorbance in the visible and the UV regions. Its deposition can be done with the help of electrochemical techniques from aqueous or paste solutions. Therefore, it might be a best and reasonable alternative to the traditional organometallic dyes in DSSC (Bothma et al., 2008). Besides, melanin has significant features in the applications of electrical energy storage devices as well as in electrochemistry.
The aim of this study is the electrochemical deposition of natural melanin thin films. We are mainly concerned with characterizing natural melanin thin films, which have not been analyzed in previous electrochemical studies. We investigated the properties of melanin thin films fabricated using two electrochemical techniques, and their physical and chemical properties are discussed in this paper. This research is significant because it reports natural melanin based thin films deposition using electrochemical methods of electronic applications, and the thickness of films can be controlled by changing the deposition time. The use of organic materials from natural sources also reduces the cost of manufacturing and the use of natural resources. Our present work provides a comprehensive understanding of the fundamental processes of electrochemical and physical properties taking place in the natural melanin thin films that have potential applications in bioelectronics. Our study further provides a guidance of electrodeposition of melanin onto the surface of fluorine-doped tin oxide conductive (FTO) glass. We believe that this work is the first contribution of its kind and will serve as a reference for relevant studies in future.
2 Experimental techniques
2.1 Materials
The natural melanin in this study was extracted from Nigella sativain in a pilot plant factory of KSU University. Natural melanin has been described and characterized using different techniques such as Nuclear Magnetic Resonance (NMR), Electron Paramagnetic Resonance (EPR), and fluorescence spectroscopy, acid composition and amino solubility studies along with and elemental analysis in more detail in reference El-Obeid et al. (2006). Briefly, the black seed coats of Nigella sativa were solubilized in a solution of NaOH (pH 12.5) for 4 h, producing a dark brown solution. The dark solution was centrifuged for 5 min at 4000 rpm after filtration process. The natural melanin was precipitated from the solution by adjusting the pH of the solution to pH 2 to using HCl. This treatment was repeated twice in order to ensure the high purity of resulting melanin. The precipitated natural melanin was thoroughly washed four times where the water was highly distilled to remove impurities, filtered, and dried at 80 °C overnight. The dry melanin powder was stored and used later to prepare solutions.
2.2 Sample preparation
A melanin solution was prepared by adding 50 ml of sodium hydroxide (1 M) to 0.5 gr of natural melanin powder. This stock solution was sonicated for one hour at a temperature of 30 °C. We then added 10 ml of hydrochloric acid (1 M) and 40 ml of deionized water to the solution to reach a final pH of 7 and a final concentration of 5 g/L. The solution was stirred using a magnetic stirrer during the reaction. Hydrochloric acid (36%) and sodium hydroxide were provided by Sigma Aldrich. In addition, in order to prepare all the solutions, deionized water (resistivity 18.0 M Ω cm) was used. FTO glass (1 cm × 1 cm) was used as the substrate (i.e. as the working electrode); a copper wire was attached using melted indium (Aldrich). Prior to each experiment, the electrodes were polished to a mirror finish with alumina powder (1.0 and 0.5 μm), sonicated in water for the removal of any residual alumina particles, after which dried in air. The electrodes were used immediately. The FTO glass substrates were washed with pure acetone twice and then sonicated in distilled water for 10 min before being dried with nitrogen gas and used directly.
2.3 Electrodeposition and characterization of melanin films
A VMP potentiostat/galvanostat (BioLogic-multichannel) was used in carrying out all the electrochemical experiments. With the EC-Lab software, the VMP was connected to a computer as well. For chronopotentiometry, a two-electrode cell was brought into use. Similarly, for cyclic voltammetry, a saturated calomel electrode (SCE, reference electrode) and a three-electrode system along with a platinum mesh (counter electrode) was used.
The working electrode was the FTO glass described above. The aqueous solution used for the experiments contained 5 ml of natural melanin solution and 0.1 M NaCl as a supporting electrolyte at pH 7. The constant-potential deposition was carried out at a fixed applied potential of 1 V with varied deposition times (1 h, 2 h, 3 h, 4 h and 5 h) in the chronopotentiometry technique. For the cyclic voltammetry technique, a voltage range from −1 to 1.5 V and a scan rate of 50 mV/s were used. After electrodeposition, the melanin films on FTO were dried on a heater surface at 50 °C for five minutes. All the thin film samples were characterized by X-ray diffraction (XRD) using a PANalytical X’Pert Pro MPD with Cu Kα radiation (λ = 1.5418 Ǻ). Fourier transform infrared (FTIR) spectra of the melanin solutions were recorded before and after the electrodeposition experiments using an FTIR spectrophotometer (Spectrum 100, Perkin Elmer, USA.) in the range 400–4000 cm−1. The record of the atomic force microscopy images of the thin films was done with the help of an atomic force microscope (Bruker, Germany), and the thicknesses of films were measured with a spectroscopic ellipsometer (J.A. Woollam, USA). The optical absorption of the thin films was recorded using a JASCO ultraviolet–visible (UV–vis) spectrophotometer (V670) in the wavelength range of 200–1000 nm.
3 Results and discussion
Using electrochemical techniques, we deposited melanin thin films on the surface of conductive glass (FTO) for different deposition times. We also recorded the surface and measured the film thickness at several intervals (3600, 7200, 9800, 14,400, and 18,000 s) using two different electrochemical techniques (cyclic voltammetry (CV) and constant potential (CP) methods), as seen in Figs. 2 and 3. The present results were found to be quite in line with the previous results taken by Vairale et al. (2014). Fig. 2 shows the cyclic voltammetry results for melanin deposition on the FTO electrode in a 0.1 M NaCl solution, recorded in the range of −1.0 to 1.2 V at a normal scan rate (50 mV/s). The maximum anodic peaks were seen at −0.70, and −0.85 V, and two reduction peaks appeared at −0.57 and −0.61 V. Fig. 3 shows the results of the constant potential method (CP); we applied a voltage of 1 V to the working electrode. The current decay was in relation with the thickening of the melanin film that was deposited on the working electrode. In addition, for the high resistance of the film, this thickening was found to be responsible. The results demonstrated that a large amount of melanin adhered to the surface and that high homogeneity was achieved using both methods. The constant potential method resulted in faster deposition of the film and more advantageous, as the thickness increased to a greater final thickness. This is clearly visible in Fig. 4, especially during the final hour. The increase in the thickness of the film between 1 h and 3 h, ranged from 189.47 to 560.39 nm with the constant potential technique, whereas it increased from 178.03 to 405.79 nm with the cyclic voltammetry technique. The deposition rate of the CP method was ∼0.156 nm/s for a deposition time of 5 h, compared to ∼0.023 nm/s for the CV method.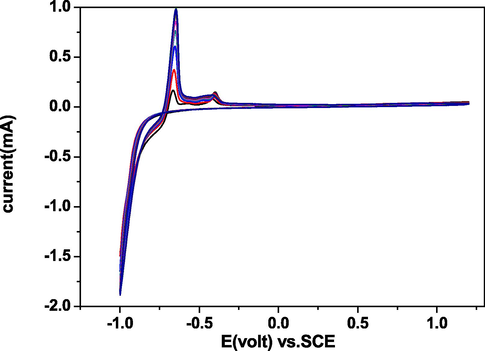
Cyclic voltammetry plots for melanin deposition (5 g/L in pH 7 support with 0.1 M NaCl) at a scan rate 50 mV/s on FTO glass. The curves are plotted at different deposition times (1 h (blue color), 2 h (red color), 3 h (blue color), 4 h (red color) and 5 h (blue color).
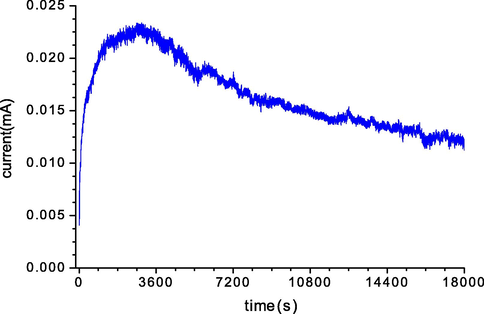
Constant potential deposition of melanin (5 g/L, pH 7). A constant potential of 1 V was applied for 18,000 s.

Thickness of the melanin films deposited using the constant potential (CP) and cyclic voltammetry (CV) methods.
3.1 FTIR spectroscopy analysis of the thin films
We studied the chemical structure of the remaining melanin solutions after electrochemical deposition by CV and CP for a deposition time of 1 h using FTIR spectroscopy in the range 400–4000 cm−1, and compared the post-deposition spectra with that of the natural melanin solution before electrochemical deposition (see Fig. 5). The spectra of melanin before and after electrodeposition showed only slight differences in the intensities of some peaks, and no changes in the chemical bonds were observed, except for an apparent change in the offset of the peak corresponding to C-H bonds. We summarize the most important chemical bonds that appeared in the melanin solutions after electrodeposition of the thin films by the CP and CV methods (Vairale et al., 2014; Centeno and Shamir, 2008; Mbonyiryivuze et al., 2015; Matas et al., 2002):
-
–
The broad band at ∼3200–3500 cm−1 was assigned to the stretching of N-H bonds; almost no change in this peak was observed post-deposition using either deposition method.
-
–
The phenolic O—H stretch was observed as a very broad and intense peak at 3400–3300 cm−1.
-
–
The aromatic combination bands at 1660 to 2100 cm−1 underwent a change during the deposition process.
-
–
A sharp peak centered at 1634 cm−1 indicated the presence of aromatic C⚌C bending and COO– asymmetrical stretching.
-
–
The variation in the intensity of the weak peak at 1550–1220 cm−1 was attributed to the C-O-H bond type.
-
–
The pronounced peak at 670–690 cm−1 corresponded to C-H vibrations.
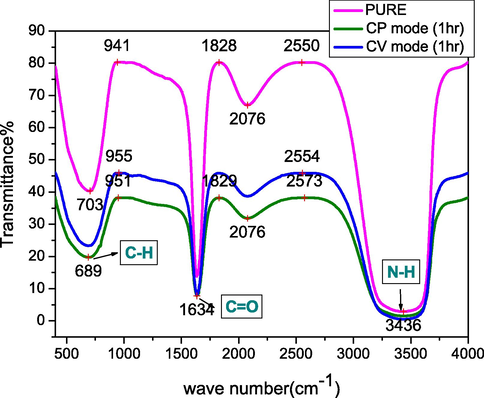
- FT-IR spectra of a pure melanin solution before electrodeposition and after 1 h of electrodeposition on FTO glass using the cyclic voltammetry (CV) and constant potential (CP) deposition methods.
The characteristics observed in this examination illustrated that the electrochemical deposition of melanin thin films on the conductive glass did not significantly change the properties of the melanin.
3.2 Atomic force microscopy of the thin films
The surface morphologies of the melanin films were investigated using atomic force microscopy (AFM). Fig. 6 shows the AFM images of the melanin films deposited using the CV (Fig. 6 (a, b, c)) and CP (Fig. 6 (d, e, f)) techniques with a deposition time of one hour. These images represent different levels of magnification, and plots of the root-mean-square (RMS) surface roughness of the images as a function of the image size are given. As shown in Fig. 6 (a), (d), for a film area of approximately 3.6 × 3.6 µm2, the RMS roughness was less than 50 nm for the cyclic voltammetry method, while it reached 52 nm using the constant potential method. The representative pictures 6(a)–6(f) clearly demonstrate that the homogeneous thin films of deposited melanin were free of voids and exhibited uniform topography with increasing resolution scale. As can be seen in Fig. 6 (d) and 6 (f), the topography of the CP film was more homogeneous than that of the CV film. Some distinct bumps in the images were observed, which could be due to the circumstances surrounding the experiment. However, the film remained homogeneous at a scale of ten nanometers, while at the hundred nanometer scale semi-spherical pellets of melanin deposited on the surface of the conductor glass were observed for both deposition methods. It can be seen from Fig. 6 (f) that almost all the particles are spherical while in figure c, the material is sliced. The same is also clear for figures b and c, in which the particles in figure b is more homogeneously distributed. This leads us to the conclusive remarks that CP mode has better morphology than CV mode.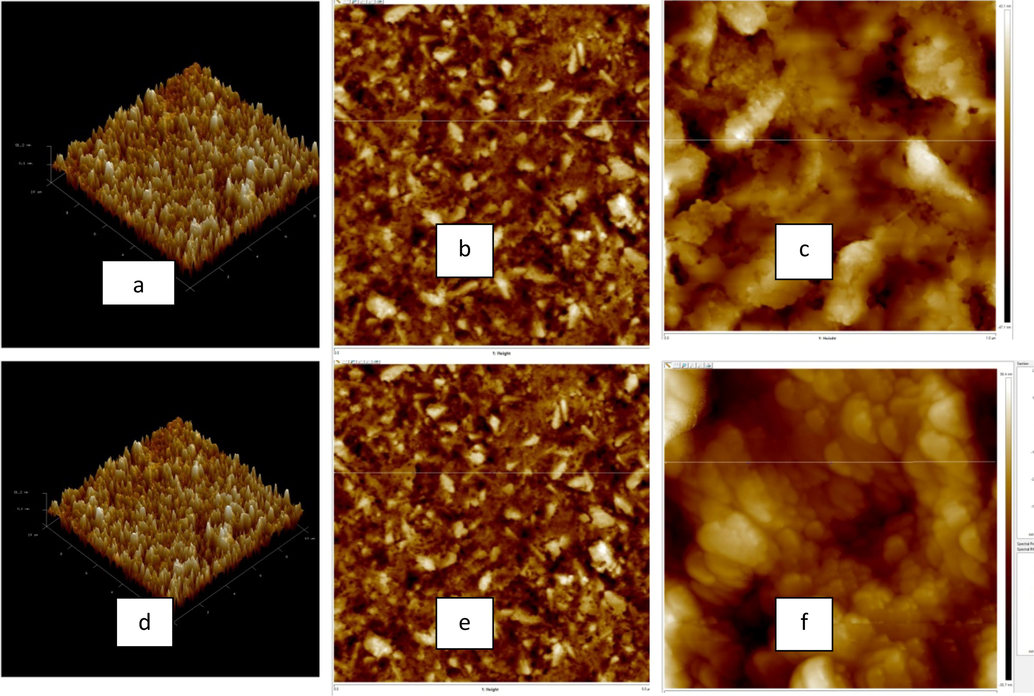
AFM images of melanin films electrochemically deposited on FTO substrates using the cyclic voltammetry (a–c) and constant potential (d–f) techniques for a deposition time of one hour.
4 ultraviolet–visible spectra
Characteristic UV–Vis spectra (200–1000 nm) of the melanin thin films deposited by the CP and CV methods are shown in Fig. 7. These spectra show the increasing light absorption of the films with increasing film thickness. The spectrum has a broadband monotonic absorbance, in good agreement for photons of decreasing wavelength in terms of monotonically increasing absorption of melanin. The films produced by both methods showed similar absorbance at wavelengths less than 336 nm. It is well seen in Table 1 that the maximum peak of absorbance of all films is quite similar in both CP and CV methods for melanin with different thicknesses, and a significant UV–Visible absorption is illustrated. Similar absorption behavior has been reported by many groups (Meredith and Sarna, 2006; Vairale et al., 2014; Morresi et al., 2010) which is in accordance with photo-protection functionalities of melanin. The main characteristic of both synthetic and natural melanin is strong wide ranged monotonic light absorption; however, such absorption behavior is atypical for organic chromophores. Melanin is a very complex absorbing material due to its polymeric nature and the role of protein linkages in the natural melanin complex, which are still unknown. Insoluble melanin is widely believed to be a highly polymeric cross-linked structure consisting of several hundred monomeric units; however, Napolitano et al. (1996) pointed out that this property is based on still-uncertain evidence.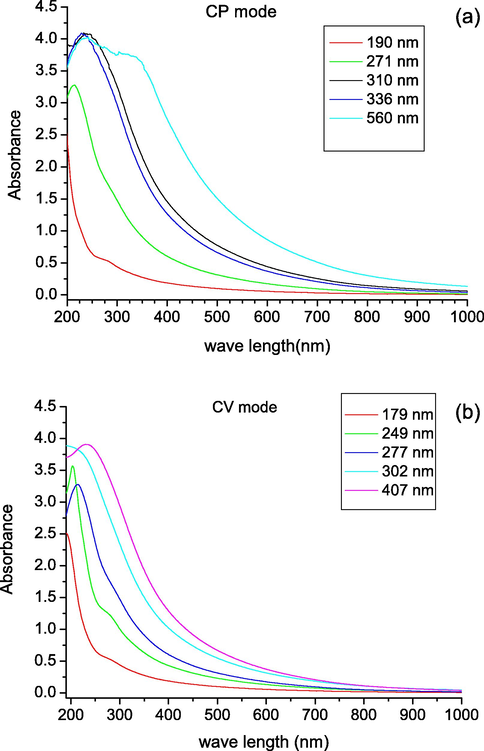
UV–Vis absorbance spectra for the melanin thin films produced (a) CP method, (b) CV method.
MODE
Film thickness (nm)
Max. absorbance wavelength (nm)
CP
190
195.85
271
214.52
310
236.89
336
234.6
560
239.18
CV
179
191.7
249
202.9
277
214.05
302
211.74
407
236.21
5 X-ray diffraction (XRD) analysis
Fig. 8 shows a representative XRD pattern of a melanin thin film deposited using the CP method with a deposition time of 1 h. The pattern was characterized by a broad peak typical of amorphous materials, centered at about 20.06°. This peak was due to X-ray diffraction from parallel planar layers. Bragg reflections with 2θ values of 26.8°, 31.98°, 36.25°, and 45.65° were observed, corresponding to (1 1 0), (2 0 0), (2 0 0), and (2 2 0) planes. A sharp peak with a 2θ value of 21.4° was also clearly observed; this peak appears in all films produced by either natural melanin or synthetic melanin (Morresi et al., 2010; Mbonyiryivuze et al., 2015). The peak position is related to the interlayer spacing d according to the Scherrer equation: D = k. λ/W cosθ, where k = 0.9 and is a dimensionless shape factor, θ is the Bragg angle, W = 20.2 and represents the line broadening at half the maximum intensity (FWHM), and λ = 1.54178 Å that represents the wavelength of X-ray. We obtained a d value of 4.149 Å. This value was quite inline with the value of the interlayer spacing having a good agreement in the synthesized melanin film reported by Vairale et al. (2014). Using the Debye-Scherer formula (Stark et al., 2003), we estimated an average grain size of 14.093 Å for the melanin film deposited using the CP method with a deposition time of 1 h. This result supported the nano-aggregate model of melanin reported in reference Hussain (2019). This was smaller than the average grain size reported in previous studies using synthetic melanin that might be owing to the existence of non-covalent bonds in the structural units of natural melanin that are absent in synthetic melanin (Capozzi et al., 2006).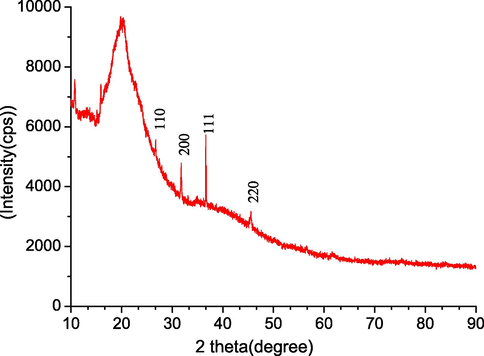
XRD pattern of melanin films deposited using the CP method with a deposition time of 1 h.
6 Conclusions
In summary, this reported research work has highlighted the importance of an interdisciplinary attitude by combining physical chemistry and materials chemistry to expand the understanding of fundamental processes of the electrochemistry and transport physics of melanin, and to advance its use in sustainable applications. It is anticipated that this work will aid the further comprehension of the functional characteristics of melanin-based materials in biological systems. This study showed that natural melanin films can be electrodeposited onto the surface of FTO glass. The fabricated melanin thin films were homogeneous, and their thickness could be controlled using electrochemical techniques. The film thickness increased with increasing electrochemical deposition time, and the thickness increased faster using the constant potential method than with cyclic voltammetry. The UV–vis absorption results suggested that the different deposition rates of melanin depended on the electrochemical method used and the thickness of the film. The combination of biodegradability and biocompatibility featured by melanin, may render its simple feasibility and room temperature processing, the most useful material for human friendly as well as environmentally friendly energy storage solutions. The above investigation has provided an overview of the electrochemical behavior of natural melanin to understand the electron transfer mechanism for its application as an organic material in bioelectronics.
Declaration of Competing Interest
The authors declared that there is no conflict of interest.
References
- Matrix assisted pulsed laser deposition of melanin thin films. J. Appl. Phys.. 2011;110(2)
- [Google Scholar]
- Device-quality electrically conducting melanin thin films. Adv. Mater.. 2008;20(18):3539-3542.
- [Google Scholar]
- The protective role of melanin against UV damage in human skin. Photochem. Photobiol.. 2008;84(3):539-549.
- [Google Scholar]
- Optical and photoelectronic properties of melanin. Thin Solid Films. 2006;511–512:362-366.
- [Google Scholar]
- Surface enhanced Raman scattering (SERS) and FTIR characterization of the sepia melanin pigment used in works of art. J. Mol. Struct.. 2008;873(1–3):149-159.
- [Google Scholar]
- Solid-state analysis of eumelanin biopolymers by electron spectroscopy for chemical analysis. Anal. Chem.. May 1990;62(9):949-956.
- [Google Scholar]
- Effect of herbal melanin on IL-8: a possible role of Toll-like receptor 4 (TLR4) Biochem. Biophys. Res. Commun.. 2006;344(4):1200-1206.
- [Google Scholar]
- p-type Cu3BiS3 thin films for solar cell absorber layer via one stage thermal evaporation. Appl. Surf. Sci.. 2019;5:144597
- [Google Scholar]
- Electrical conductivity of synthetic DOPA-melanin polymer for different hydration states and temperatures. J. Biomater. Sci. Polym. Ed.. 1995;7(7):577-586.
- [Google Scholar]
- Effect of Cu2+-ions on semiconductor properties of synthetic DOPA melanin polymer. J. Biomater. Sci. Ed.. 1996;7(9):781-793.
- [Google Scholar]
- Electrochemical growth of synthetic melanin thin films by constant potential methods. Electrochim. Acta. Feb. 2011;56(7):2954-2959.
- [Google Scholar]
- “Electrical and optical properties of natural and synthetic melanin biopolymer”. J. Non. Cryst. Solids, Jul.. 2009;355(22–23):1221-1226.
- [Google Scholar]
- Melanin as a confounding factor in near infrared spectroscopy of skin. Vib. Spectrosc.. 2002;28(1):45-52.
- [Google Scholar]
- Fourier transform infrared spectroscopy for sepia melanin. Phys. Mater. Chem.. 2015;3(2):25-29.
- [Google Scholar]
- Natural dye sensitizer for Gr ӓ tzel Cells: Sepia melanin. Phys. Mater. Chem.. 2015;3(1):1-6.
- [Google Scholar]
- The physical and chemical properties of eumelanin. Pigment Cell Res.. 2006;19(6):572-594.
- [Google Scholar]
- Optical and electrical behavior of synthetic melanin thin films spray-coated. Energy Proc.. 2010;2(1):177-182.
- [Google Scholar]
- Role of semiconductivity and ion transport in the electrical conduction of melanin. Proc. Natl. Acad. Sci. USA. 2012;109(23):8943-8947.
- [Google Scholar]
- Structural analysis of synthetic melanins from 5,6-dihydroxyindole by matrix-assisted laser desorption ionization mass spectrometry. Rapid Commun. Mass Spectrom.. 1996;10(4):468-472.
- [Google Scholar]
- A role for excreted quinones in extracellular electron transfer. Nature. 2000;405(6782):94-97.
- [Google Scholar]
- Photoprotective properties of skin melanin. Br. J. Dermatol.. 2002;146(Suppl):7-10.
- [Google Scholar]
- A first-principles density-functional calculation of the electronic and vibrational structure of the key melanin monomers. J. Chem. Phys.. 2004;120(18):8608-8615.
- [Google Scholar]
- Highly selective dopamine quantification using a glassy carbon electrode modified with a melanin-type polymer. Anal. Chim. Acta. 2001;440:99-108.
- [Google Scholar]
- Spectroscopic study and simulation from recent structural models for eumelanin: I. Monomer, dimers. J. Phys. Chem. B. 2003;107(41):3061-3067.
- [Google Scholar]
- Metal binding by melanins: studies of colloidal dihydroxyindole-melanin, and its complexation by Cu(II) and Zn(II) ions. J. Inorg. Biochem.. 2002;89(1–2):45-53.
- [Google Scholar]
- A three-dimensional synthetic metallic crystal composed of single-component molecules. Science. 2001;291(5502):285-287.
- [Google Scholar]
- Electrochemical synthesis of melanin thin films: evolution of structural and optical properties. Int. J. Adv. Res. Phys. Sci.. 2014;1(7):35-45.
- [Google Scholar]
- Electrochemical synthesis of melanin thin films: evolution of structural and optical properties. Int. J. Adv. Res. Phys. Sci.. 2014;1(7):35-45.
- [Google Scholar]
- Organic electronics: from materials to devices. Adv. Mater.. 2009;21(14–15):1401-1403.
- [Google Scholar]


