

Translate this page into:
Characterization and photocatalytic activity of new photocatalysts based on Ag, F-modified ZnO nanoparticles prepared by thermal shock method
⁎Corresponding author. htkxuan@hcmus.edu.vn (Thi Kieu Xuan Huynh)
-
Received: ,
Accepted: ,
This article was originally published by Elsevier and was migrated to Scientific Scholar after the change of Publisher.
Peer review under responsibility of King Saud University.
Abstract
Ag-modified ZnO, F-modified ZnO and (Ag, F)-modified ZnO nanoparticles were prepared by thermal shock method in order to study the effects of doping agents on their crystal structure, morphology, optical properties, surface structure and photocatalytic activity. The catalysts were characterized by XRD, FE-SEM, TEM, FTIR, UV–Visible diffuse reflectance and XPS spectroscopy. The photocatalytic activity was evaluated via the degradation of methylene blue under UVA and visible light irradiation. According to the results, the thermal shock process with AgNO3 did not modify the morphology but successfully created silver species on the surface of ZnO, which induces the visible light absorption and then increases the photocatalytic activity. The enhanced phototcatalytic performance was also observed in F-modified ZnO sample owing to the increase of surface hydroxyl groups and the formation of zinc vacancies. Among three modified ZnO samples, (Ag, F)-modified ZnO was found to be the best sample with the photocatalytic activity enhanced by the factor of 3 under both UVA and visible light, which may be attributed to the synergic effects of AgNO3 and KF used in thermal shock process.
Keywords
ZnO nanoparticles
Ag-doping
F-doping
Thermal shock method
Photocatalytic activity

1 Introduction
In recent years, a number of efforts have been carried out to prepare Ag-doped ZnO materials due to promising effects of Ag doping for their photocatalytic activity (Liqiang et al., 2006; Namratha et al., 2011; Yıldırım et al., 2013; Hosseini et al., 2015; Hsu and Chang, 2014; Kakhki et al., 2017). Before ZnO, it was well reported that Ag doping in TiO2 (Lee et al., 2005; Liu et al., 2012; Suwarnkar et al., 2014; Santos et al., 2015; Demirci et al., 2016) can induce the surface plasmon resonance effect (Santos et al., 2015) and the decrease of charge recombination (Hosseini et al., 2015; Lee et al., 2005), which effectively enhance its efficiency in the photocatalytic process. Therefore, high UV and visible-light induced photocatalytic performance was also expected in the case of Ag doped ZnO nanoparticles. In fact, Namratha et al., (2011) successfully fabricated Ag doped ZnO by hydrothermal method whereas Hosseini et al. (2015) developed a simple method to synthesize Ag doped ZnO based on solid state milling and calcination of precursor powders. Their modified material exhibited excellent UV-light driven photoactivity for the degradation of organic dyes under UV light. Moreover, Ag doped ZnO nanoparticles (Kakhki et al., 2017) or Ag doped ZnO nanorods (Hsu and Chang, 2014) also showed improved photocatalytic activity under visible light irradiation. These results strongly suggest that modification of ZnO with Ag agent could be the effective solution for the improvement of ZnO photocatalysts.
On the other hand, surface fluorination was also investigated as an effective method to enhance the photocatalytic activity of TiO2 (Park and Choi, 2004; Yu et al., 2009; Junqi et al., 2011; Wen et al., 2015). Several works also combined Ag and F agents to further improve the performance of TiO2 photocatalysts (Luo et al., 2016; Wang et al., 2016). However, according to our best knowledge, there is still no report on the surface fluorination of ZnO nanophotocatalysts. Recently, we successfully developed the thermal shock method to modify the surface of TiO2 (Le et al., 2014; Le et al., 2015). This method was not only simple, rapid but also effectively able to create various surface defects, which can increase the photocatalytic activity. Motivated by the success in the enhanced UVA and visible light response of modified TiO2 by thermal shock method, in this work, we used the thermal shock method to modify ZnO nanoparticles with KF or AgNO3 in order to improve their photocatalytic performance under both UVA and visible light irradiation. We also combined KF and AgNO3 through the thermal shock method to elucidate the synergic effects of cation and anion dopants on the crystal structure, morphology, optical properties, surface structure and photocatalytic activity of ZnO.
2 Experimental section
2.1 Sample preparation
The starting materials Zn(CH3COO)2·2H2O, K2C2O4·H2O, AgNO3 and KF (99%, extra pure grade) were purchased from Sigma Aldrich. Methylene blue (MB) (analytical grade) was purchased from Merck. These chemicals were used as received without further purification. Distilled water was used in all the experiments. The synthesis procedure of unmodified (denoted as ZnO) and (Ag, F)-modified ZnO nanoparticles (denoted as Ag-F-ZnO) consisted of two major steps: (i) preparation of unmodified ZnO nanoparticles by a simple precipitation-thermal treatment method, (ii) modification of prepared ZnO with KF and AgNO3 by thermal shock method. Firstly, 0.08 mol of Zn(CH3COO)2·2H2O was dissolved in 160 mL of distilled water to prepare zinc acetate solution. Then 160 mL of 0.5 M oxalic acid solution was added dropwise to the vigorously stirred zinc acetate solution. The filtered white precipitate was washed with distilled water, dried in oven at 150 °C for 2 h and subsequently calcined at 500 °C for 1 h in an electric furnace to obtain unmodified ZnO nanoparticles.
Thereafter, the prepared ZnO nanoparticles were added in 10 mL of aqueous solution containing 6.250 mmol of KF and 0.625 mmol AgNO3 with the molar ratio of Zn:F:Ag fixed at 1:1:0.1. The suspension was magnetically stirred for 15 min and then put in an oven at 150 °C during 3 h to form white powder. This powder was introduced into an electric furnace preheated at 500 °C to undergo the thermal shock during 5 min. Afterwards, the powder was cooled down to room temperature, washed in distilled water to remove the remained KF on its surface and dried again at 150 °C for 1 h. Moreover, the Ag-modified ZnO (denoted as Ag-ZnO) and F-modified ZnO (denoted as F-ZnO) samples were also prepared by the same procedure as above but without adding KF and AgNO3 in the precursor solution, respectively.
2.2 Characterization
Structural analysis was carried out using X-ray powder diffractometry (BRUKER-Binary V3, Cu Kα radiation (λ = 1.5406 Å), U = 40 kV, I = 40 mA). The accelerating voltage and the applied current were 40 kV and 40 mA, respectively. The Fullprof 2009 structure refinement software was used to effectuate the Rietveld refinement (Rodriguez-Carvajal, 2001). The Debye–Scherrer formula was also applied to calculate the crystallite diameter from the full width of half maximum of the most intense diffraction peak of ZnO ((1 0 1) line). The particle size and morphology of the catalysts were recorded by a HITACHI S-4800 field emission scanning electron microscope (FE-SEM) operating at 10 kV and a JEOL USA JEM-1400 transmission electron microscope (TEM) operated at 100 kV. The UV–visible absorption spectra of catalysts were measured by a Jasco V-550 spectrophotometer (JASCO Corp.) in which BaSO4 was used for background subtraction. The surface atomic composition and chemical environment of ZnO and ZnO-X catalysts were examined by X-ray photoelectron spectroscopy (XPS) using a Kratos Axis Ultra DLD spectrometer (Kratos Analytical Ltd, UK) equipped with an Al-Kα source (1486.6 eV). The pressure was maintained at 10−7 mbar. All the binding energies were calibrated with respect to the signal of surface contamination carbon (binding energy of 285 eV). The surface functional groups of catalysts were characterized by Fourier transform infrared spectra (FTIR) which were recorded in the 4000–400 cm−1 frequency region at room temperature using a Bruker Vertex 70 spectrometer (USA).
2.3 Photocatalytic tests
The photocatalytic activities of unmodified, Ag-modified, F-modified and (Ag, F)-modified ZnO catalysts were evaluated through time-dependent photodegradation of MB solution as a model pollutant (Sanoop et al., 2016). In a typical photocatalytic activity measurement, 0.125 g catalyst powder was dispersed in 250 mL of MB solution (10−5 mol L−1) under magnetic stirring. The suspension temperature was kept at 30 °C during the experiments by a water circulation system. The initial pH of suspensions was determined at 7. Prior to the irradiation, the suspension was vigorously stirred in the dark for 60 min to ensure the adsorption–desorption equilibrium of MB aqueous solution with the photocatalysts. Then the reaction suspension was irradiated by an Osram 9-W UV light lamp or an Osram 9-W visible light lamp placed about 10 cm above the suspension surface. 5 mL of the aliquots were sampled at regular intervals of 30 min and analysed by a UV–visible Helios Omega spectrophotometer at 664 nm.
3 Results and discussion
3.1 Catalyst characterization
Fig. 1 shows the power X-ray diffraction patterns of unmodified and modified ZnO catalysts. Their phase composition is summarized in Table 1. All the patterns exhibit the characteristic peaks centered at 31.7°, 34.4°, 36.2°, 47.5°, 56.6° respectively corresponding to (1 0 0), (0 0 2), (1 0 1), (1 0 2), (1 1 0) lines of ZnO zincite phase (space group P63mc), which are in good agreement with the standard JCPDS file no. 36-1451. These intense and sharp peaks also confirm that the catalysts are well-crystallized. It was observed that the crystallite size calculated by the Debye–Scherrer remained unchanged when ZnO was modified with KF or AgNO3. Furthermore, no impurity phase is detected in the pattern of F-ZnO, indicating that the modification with KF by thermal shock method did not affect the crystal structure of ZnO. However, for Ag-ZnO, an additional crystallographic phase corresponding to the peaks located at 38.1° and 44.2° was observed. These additional peaks are attributed to the (1 1 1) and (2 0 0) lines of metallic silver phase (JCPDS file no. 004-0783, space group Fm3m). When ZnO was co-modified with KF and AgNO3, these peaks still remained, demonstrating the presence of metallic silver phase in this sample. It should be noted that no trace of Ag2O or AgNO3 phases were observed in the diffractograms of Ag-ZnO and Ag-F-ZnO samples. This indicates that most of silver species exist in the metallic phase on the surface of our catalysts.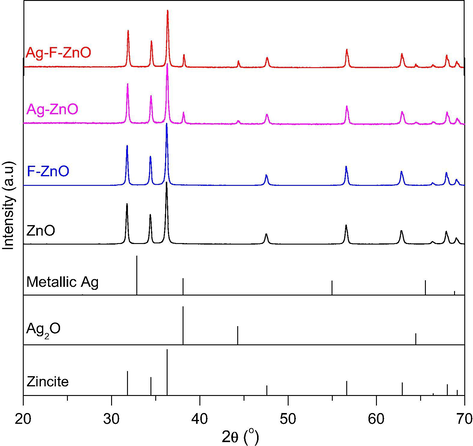
XRD patterns of unmodified and modified ZnO samples (Ag-ZnO, F-ZnO and Ag-F-ZnO).
Sample
Fraction (%)
Zincite
Metallic silver
Ag2O
ZnO
100
0
0
Ag-ZnO
95.31
4.69
0
F-ZnO
100
0
0
Ag-F-ZnO
95.89
4.11
0
The morphology of unmodified and modified catalysts was investigated using FE-SEM. From their micrographs (Fig. 2a–d), one can notice that the particle size and shape of ZnO nanoparticles were not significantly affected by the thermal shock modification. All the samples consist of hexagonal and aggregated particles. Their average particle size is found to be in the range of 50–100 nm. Furthermore, TEM characterization was also carried out to elucidate the microstructure of our catalysts. From their TEM images (Fig. 3), four catalysts show the multi-dispersed particles with no difference in particle size and shape, which is in good agreement with FE-SEM micrographs.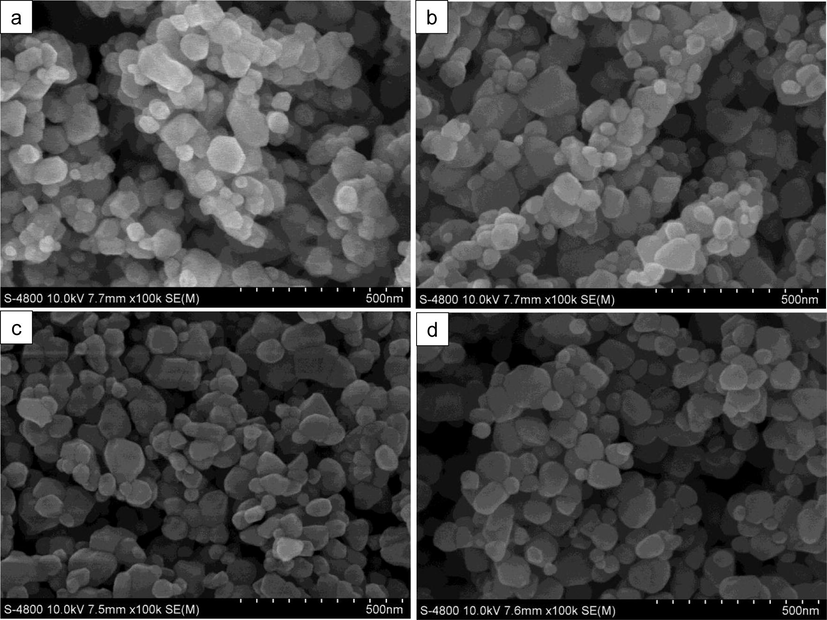
SEM micrographs of (a) unmodified ZnO, (b) F-ZnO, (c) Ag-ZnO and (d) Ag-F-ZnO.
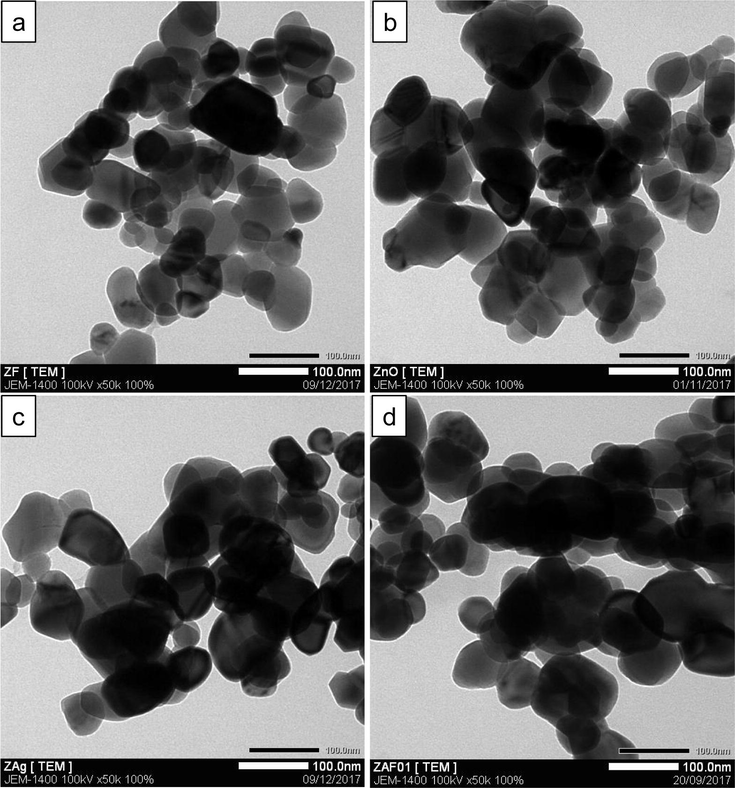
TEM images of (a) unmodified ZnO, (b) F-ZnO, (c) Ag-ZnO and (d) Ag-F-ZnO.
X-ray photoelectron spectroscopy (XPS) was employed to better understand how the thermal shock with different doping agents affected the surface of ZnO. Table 2 reports the surface composition and the chemical environment of all elements on the surface of our catalysts. Due to adventitious carbon contamination, all samples present C 1s core peaks where the major peak at 285 eV corresponding to C—C and C—H bonds, two other peaks at 286.6 and 289.2 eV assigned to Zn—O—C and O⚌C—O bonds, respectively (Mishra et al., 2013; Gopinath et al., 2002; Papirer et al., 1995). As shown in Fig. 4, due to spin–orbit coupling, the Zn 2p core peaks of unmodified and modified ZnO samples always exhibit two main Zn 2p components at 1021.5 (Zn 2p3/2) and 1044.6 eV (Zn 2p1/2). The positions of these peaks are characteristic for Zn2+ ions in the oxygen environment (Anandan et al., 2010; Navarro et al., 2008), which demonstrates that the oxidation state and the chemical environment of zinc atoms on ZnO surface were not modified by thermal shock process with different doping agents. All the samples also indicated the absence of F 1s peaks, even for F-ZnO and Ag-F-ZnO samples (Figure not shown in this paper for a nonexhaustive presentation), suggesting that fluoride ions are hardly adsorbed on the surface of ZnO. This is surprising since chemisorbed fluoride ions were observed on the surface of TiO2 when this oxide was fluorinated by thermal shock method in our previous studies (Le et al., 2014; Le et al., 2012).
C 1s
Zn 2p3/2-1/2
O 1s I
O 1s II
Ag 3d3/2 I
Ag 3d3/2 II
Ag 3d3/2 III
Zn/OI
OII/Zn
ZnO
B.E. eV
285.0
286.6
289.0
2021.4–1044.5
530.2
531.8
530.2
531.8
1.00
0.41
%
13.00
1.94
2.38
34.32
34.33
14.03
34.33
14.03
F-ZnO
B.E. eV
285.0
286.7
289.2
1021.6–1044.7
530.4
531.8
530.4
531.8
0.93
0.44
%
17.42
2.66
2.48
30.80
33.04
13.62
33.04
13.62
Ag-ZnO
B.E. eV
285.0
286.6
289.2
1021.5–1044.6
530.3
531.9
367.5
366.8
368.3
0.99
0.40
%
11.68
1.64
1.92
34.82
35.16
13.76
0.76
0.11
0.13
Ag-F-ZnO
B.E. eV
285.0
286.6
289.3
1021.5–1044.6
530.4
531.9
367.6
366.3
368.7
0.96
0.43
%
13.25
1.82
1.80
33.40
34.75
14.26
0.59
0.07
0.06
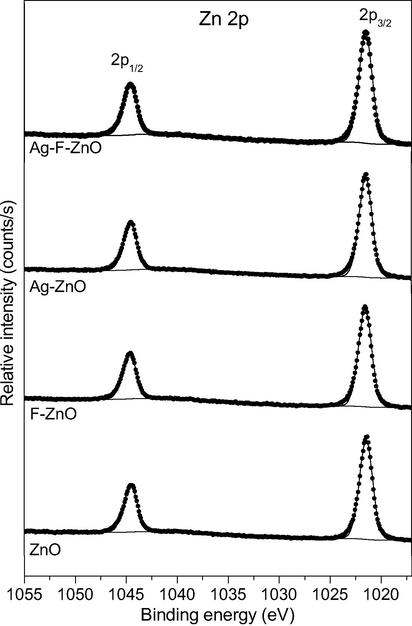
High resolution XPS Zn 2p spectra of unmodified and modified ZnO samples.
Fig. 5 shows the high resolution Ag 3d5/2 core peaks of Ag-ZnO and Ag-F-ZnO samples (their spin–orbit coupling peaks are presented in the inset). The Ag3d5/2 core peaks evidence the presence of Ag dopant in, at least, three different chemical states. The most intense peak (Ag(I)) is located at 367.5 eV whereas the two minor peaks are situated at 366.7 eV (Ag(II)) and 368.3 eV (Ag(III). It is worth mentioning that the binding energy of various oxidation states of silver is still under debate. Many work assigned the peaks located at around 368.2 eV and 367.7 eV to silver atoms in metallic silver state (Johansson et al., 1973; Xin et al., 2005; Xu and You, 2014; Feng et al., 2013) and Ag2O state (Kaushik, 1991; Arabatzis et al., 2003), respectively. However, when all the binding were referenced to the C 1s peak located at 285 eV, metallic silver can be characterized by Ag 3d5/2 peaks at binding energy lower than 368 eV (Zhang et al., 2011; Abdel-Fattah et al., 2015). For our samples, when ZnO was Ag-modified by thermal shock method, the XRD results indicate the formation of metallic silver in ZnO lattice. Therefore, the majority of silver species on the surface of this catalyst should be in zero valence state. Moreover, it was well reported that the binding energy difference of (Zn 2p3/2–Ag 3d5/2) core peaks for Ag0-doped ZnO was mostly found to be 653.9 eV (Liqiang et al., 2006; Carvalho et al., 2014), which was consistent with the binding energy difference between Zn 2p3/2 and Ag(I) 3d5/2 peaks in our Ag-modified sample. In the other hand, the binding energy difference between Zn 2p3/2 and Ag(II)3d5/2 peaks of this samples are close to that of (Zn 2p3/2–Ag 3d5/2) core peaks for Ag+-doped ZnO in the literature (Liqiang et al., 2006). These results allow us to assign the main Ag(I) 3d5/2 peak (367.5 eV) and the minor Ag(II)3d5/2 peak (366.7 eV) to metallic Ag and Ag2O on the surface of our Ag-modified catalyst, respectively. As a consequence, the remained Ag(III) 3d5/2 component (368.3 eV) should be attributed to Ag-Zn-O ternary compounds (Lupan et al., 2010). The presence of three types of silver species may be attributed to the effect of thermal shock at 500 °C which could lead to the decomposition of AgNO3 adsorbed on the surface of ZnO nanoparticles since AgNO3 could be thermally decomposed into Ag2O and metallic silver at around 400 °C (Lide, 2009). These similar components of Ag 3d5/2 core peaks were also observed in Ag-F-ZnO sample. It should be reminded that XRD results only showed the diffraction peaks for metallic silver phase. The absence of two other silver species in XRD patterns may be explained by their low quantity, which may be lower than the detection limit of XRD technique.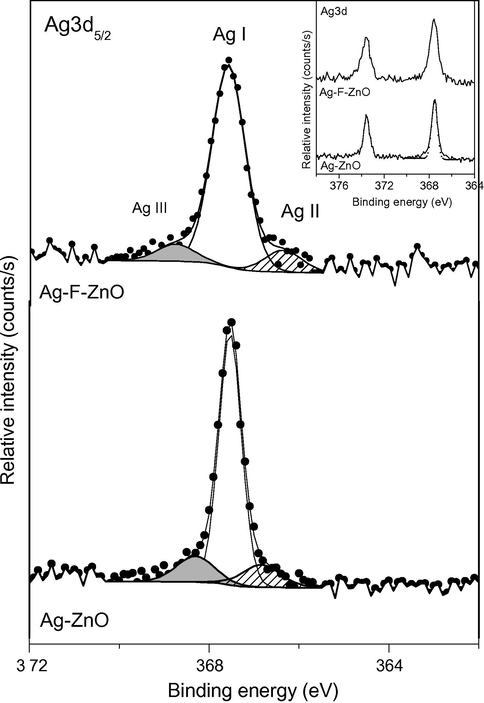
High resolution XPS Ag3d5/2 (inset: XPS Ag 3d spectra) spectra of unmodified and modified ZnO samples.
The high resolution O 1s spectra (Fig. 6) of unmodified and modified samples show an asymmetric peak which can be deconvoluted into two peaks: the main peak (O(I)) situated at 530.4 eV assigned to O2− ions of ZnO lattice (Zheng et al., 2011) and a minor peak (O(II)) at 531.9 eV attributed to surface hydroxyl groups of our samples (Dupin et al., 2000). Table 2 also shows the OII/Zn and Zn/OI atomic ratios calculated from corresponding peak area. It was observed that the OII/Zn and Zn/OI atomic ratios of Ag-ZnO were almost identical to unmodified ZnO sample. When ZnO was modified with KF or with both KF and AgNO3 by thermal shock method, the OII/Zn atomic ratio clearly increased whereas the Zn/OI atomic ratio dramatically decreased (lower than the stoichiometric Zn/OI atomic ratio of unmodified ZnO), which suggests the increase of surface hydroxyl groups and the formation of zinc vacancies on the surface of ZnO.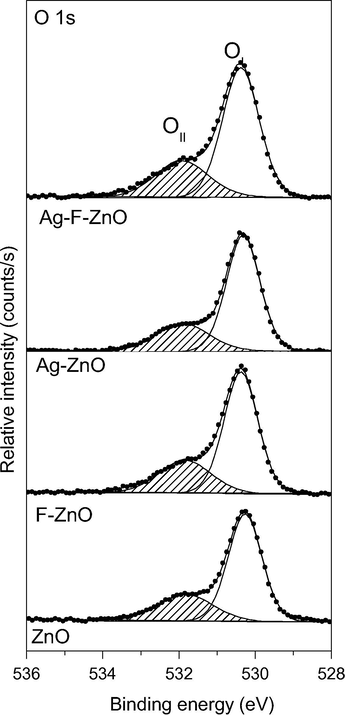
High resolution XPS O 1s spectra of unmodified and modified ZnO samples.
The effects of modification agents on the surface of ZnO catalysts were also characterized by FTIR spectra (Fig. 7). The unmodified ZnO sample presents several broad absorption peaks at 3455, 2830, 1628 cm−1, corresponding to O—H stretching vibration, C—H stretching vibration and O—H bending vibration (Muthukumaran and Gopalakrishnan, 2012), respectively, and a set of prominent peaks at 535.5, 482.2 and 432.8 cm−1, which are attributed to the stretching vibrations of Zn—O bonds. It was observed that the thermal shock with KF and/or AgNO3 did not affect the FTIR spectra in the range of 700–4000 cm−1 but strongly modified the absorption bands in the fingerprint region of catalysts. In fact, when ZnO was modified with Ag, the two former Zn-O vibration peaks shift to higher wave numbers (552.4 and 488.9 cm−1) whereas the latter shifts to lower wave number (428.9 cm−1), proving that the presence of silver species clearly affected the bonding energy of Zn—O bonds since the wave number of bond stretching vibrations is generally proportional to the vibration force constants (Solek, 2009). Moreover, when adding KF into the precursor solution, the shape and the position of Zn—O vibration bands were dramatically changed. This evolution may be attributed not only to the interaction of silver species but also to the formation of defects on ZnO surface such as zinc vacancies, which is consistent with XPS results.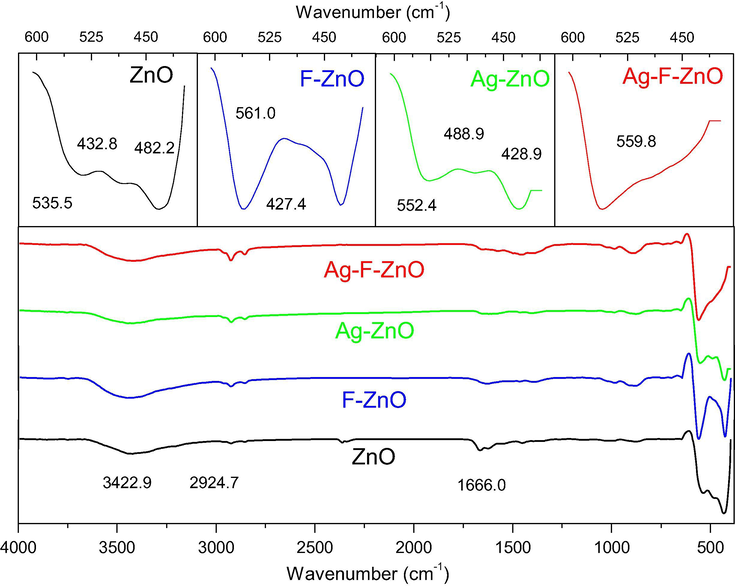
FTIR spectra of unmodified and modified ZnO samples (Ag-ZnO, F-ZnO and Ag-F-ZnO).
The optical properties of our samples were examined via their UV–visible absorption spectra (Fig. 8). The unmodified ZnO nanoparticles effectively absorb UV light (wavelength shorter than 450 nm) but very weakly absorb visible light (450–800 nm). Likewise, the F-ZnO sample also shows very low absorption in the zone of 450–800 nm but an intense absorption band from 200 to 450 nm. Interestingly, when ZnO was modified with AgNO3 or both (AgNO3 + KF), a broad and emerging absorption band was observed from 420 to 850 nm, corresponding to the dark color of these samples Fig. 8. This indicates that the presence of metallic Ag and Ag2O can improve the visible light harvesting of ZnO nanoparticles. Moreover, Ag-ZnO exhibited the darker color and the stronger photoabsorption performance in the visible light region than Ag-F-ZnO. The enhanced visible light absorption of Ag-ZnO sample could be explained by the higher amount of surface silver species on Ag-ZnO than Ag-F-ZnO, which was proved by XPS study.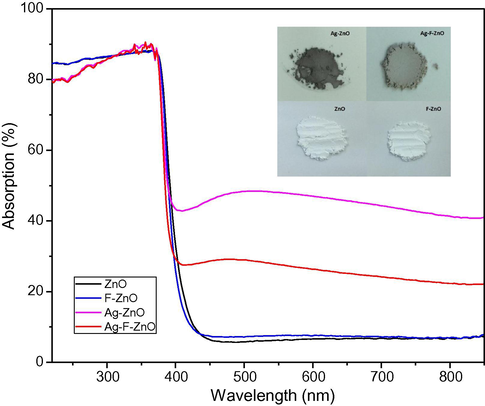
UV–visible absorption spectra and numerical photos of unmodified and modified ZnO samples (Ag-ZnO, F-ZnO and Ag-F-ZnO).
3.2 Photocatalytic activity
Figs. 9 and 10 compare the photocatalytic activity of unmodified and modified catalysts via the MB degradation under UVA light and visible light, respectively. According to these figures, the MB degradation in the presence of our catalysts follows the pseudo-first-order Langmuir-Hinshelwood kinetic model (Rajamanickam and Shanthi, 2016). The apparent rate constants of MB degradation are summarized in Table 3. All ZnO catalysts modified by thermal shock method exhibited higher activity than unmodified ZnO sample. A blank test for MB degradation without catalysts was also performed to evaluate the self-degradation of MB. It was found that in the absence of unmodified and modified ZnO catalysts, MB was not degraded under UVA and visible light illumination Table 3. More especially, the unmodified ZnO sample almost showed very low visible light induced activity whereas the modified ZnO catalysts by thermal shock method effectively degraded MB under visible light. It can be also seen that the modification with KF is more fruitful than AgNO3 to increase the photocatalytic activity of ZnO. Among our catalysts, the Ag-F-ZnO showed the best performance with the MB degradation rate constant enhanced by the factor of 3 under both UVA and visible light irradiation, confirming the synergistic effect between AgNO3 and KF in the improvement of ZnO photocatalysts. Moreover, a ZnO catalyst modified with KF and AgNO3 by a gradual heating up to 500 °C followed by a gradual cooling was also prepared in order to compare with our thermal shock method Table 3. This sample exhibited lower performance than thermal-shock Ag-F-ZnO under both UVA and visible light illumination.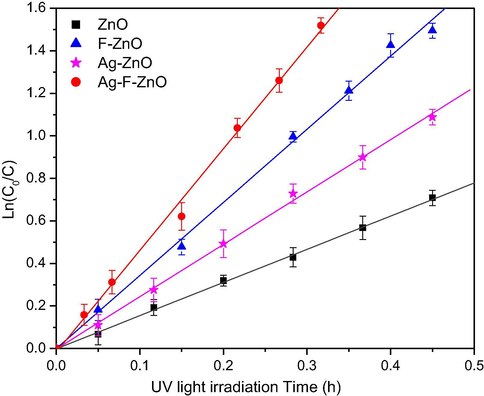
Ln(C0/C) versus time plot of MB degradation under UV irradiation on unmodified and modified ZnO samples. C is the MB concentration (mol L−1) at time t and C0 is the initial MB concentration (mol L−1).
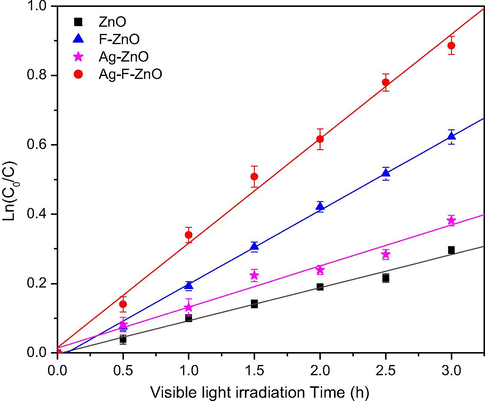
Ln(C0/C) versus time plot of MB degradation under visible irradiation on unmodified and modified ZnO samples. C is the MB concentration (mol L−1) at time t and C0 is the initial MB concentration (mol L−1).
Under UVA light illumination
Under visible light illumination
Sample
Apparent rate constant (kapp) of MB degradation (h−1)
Difference of apparent rate constant (Δkapp) between modified samples and ZnO (h−1)
Apparent rate constant (kapp) of MB degradation under UV illumination (h−1)
Difference of apparent rate constant (Δkapp) between modified samples and ZnO (h−1)
ZnO
1.56
0.095
Ag-ZnO
2.46
0.90
0.118
0.023
F-ZnO
3.44
1.88
0.213
0.118
Ag-F-ZnO
4.78
3.22
0.301
0.206
Ag-F-ZnO (gradual heating and cooling)
3.16
0.136
Blank test (without catalysts)
2.07 × 10⁻³
1.20 × 10⁻³
3.3 Discussion
In our work, AgNO3 and KF were used to modify the properties of ZnO nanoparticles via the thermal shock method. The results of characterization study and photocatalytic tests demonstrated that the properties of our catalysts strongly depend on the dopant agents used in thermal shock process. For F-modified ZnO catalyst, although characterization techniques did not demonstrate the modification of crystal structure, morphology of ZnO, even the presence of fluorine species on the oxide surface, the photocatalytic activity was two times higher than the unmodified ZnO catalyst under both UVA (Δkapp = 1.88 h−1) and visible light illumination (Δkapp = 0.118 h−1). The enhanced photocatalytic performance of this catalyst should be explained by the XPS study which declared the formation of zinc vacancies and the slight increase of surface hydroxyl groups, due to the effects of KF during the thermal shock process. The fluoride ions are suggested to be able to break the surface Zn–O–Zn joints to form surface Zn–F− and Zn–O2− groups. Subsequently, when modified ZnO nanoparticles were washed with distilled water, the Zn–F− groups were removed from the surface, leaving zinc vacancies whereas the Zn–O2− groups are hydrolysed to create surface hydroxyl groups (Le et al., 2020). Our previous works proved that the modification of TiO2 with KF by thermal shock method effectively increased its photocatalytic activity via the enhancement of surface hydroxyl groups (Le et al., 2014; Le et al., 2012) since almost high reactive hydroxyl radicals are produced by the reaction between photogenerated holes and surface hydroxyl groups (Minero et al., 2000). Furthermore, according to the DFT calculation of (Pan et al., 2014), surface zinc vacancies can create new transition band above the top of valence band, which induces the visible light absorption of ZnO and then increases the photocatalytic performance. Therefore, F–ZnO exhibited higher activity than unmodified ZnO under both UVA and visible light irradiation.
When ZnO was modified by AgNO3, the rate constant of MB degradation was successfully enhanced from 1.56 to 2.46 h−1 under UVA light (Δkapp = 0.90 h−1) and from 0.095 to 0.118 h−1 under visible light (Δkapp = 0.023 h−1), which should be attributed to the evolution of ZnO bulk structure and surface composition. It should be reminded that Ag dopant did not increase surface hydroxyl groups and create zinc vacancies. However, the XRD and XPS analysis revealed the formation of metallic silver clusters in the lattice and on the surface of ZnO powder. Owing to the surface plasmon resonance effect, the presence of silver metal may induce the absorption in the visible light region (Pan et al., 2014), which was proved by UV–visible absorption spectrum of Ag-modified ZnO. As a consequence, the absorption in the visible light region should increase the visible light response of Ag-modified ZnO. Moreover, silver metal deposited on the surface of ZnO can induce the Schottky barrier at the interface between silver and ZnO nanoparticles, which prevents photogenerated electrons to migrate to the surface thereby promoting the charge separation and then the photocatalysis of semiconductors (Liqiang et al., 2006; Hosseini et al., 2015; Lee et al., 2005). In the other hand, XPS results also indicated the existence of Ag+ ions on the surface of this sample. The presence of both Ag0 and Ag+ was reported to be able to enhance the photocatalytic activity since O2−–Ag+–O2− joints can trap the photoelectrons to form O2−–Ag+–O2− joints and then react with surface adsorbed oxygen molecules, which facilitates the charge separation (Sakatani et al., 2004; Xu et al., 2014).
Interestingly, when ZnO was co-modified by AgNO3 and KF, the UVA and visible light responsive photocatalytic activity was remarkably enhanced to about three times that of unmodified ZnO. It should be noted that the increase of MB degradation rate constant on Ag-F-ZnO compared to ZnO (Δkapp = 3.22 and 0.206 h−1 under UVA and visible light, respectively) is superior to the total increase of MB degradation rate constant on Ag-ZnO and F-ZnO compared to ZnO nanoparticles. Moreover, Ag-F-ZnO also showed higher photocatalytic performance than the ZnO modified with AgNO3 and KF by a gradual heating and cooling. Therefore, the best photocatalytic performance of Ag-F-ZnO catalyst should not be explained by the simple summation of Ag dopant and F dopant but by the synergic effects of KF and AgNO3 in thermal shock process. This sample does not only contain metallic silver in its lattice and on its surface, which results in the visible light absorption and the photocatalytic activity under visible light via the surface plasmon resonance effect, but also presents the enhanced hydroxyl groups and zinc vacancies on its surface, which may lead to the enhanced generation of hydroxyl radicals and the suppression of charge recombination. The rapid heating and cooling in our thermal shock method was proved to be able to modify specifically the surface of transition metal oxides without affecting their bulk structure. In fact, we successfully created the oxygen vacancies on the surface of thermal-shock-fluorinated TiO2 nanoparticles in our previous studies (Le et al., 2015). But this is almost the first time surface zinc vacancies is reported for ZnO co-modified with KF and AgNO3, which demonstrated the novelty of our catalytic systems prepared by thermal shock method. Moreover, the apparition of Ag2O phase detected by XRD may also contribute to the enhanced photocatalytic activity since Ag2O was reported as a visible light sensitizer (Wang et al., 2011; Ma et al., 2014). When ZnO and Ag2O nanoparticles are exposed to the visible light, due to the band gap of 1.2 eV with an energy level of the conduction band edge of +0.2 eV (vs SHE) (Xu and Schoonen, 2010), Ag2O can absorb light to produce electrons in the conduction band which leave holes in the valence band. In the heterostructure of ZnO, metallic Ag and Ag2O, these photoelectrons can migrate to the conduction band of ZnO (Ma et al., 2014) or metallic Ag (Wang et al., 2011), hindering the charge recombination and promoting the longer lifetime of photogenerated electrons and holes. As a consequence, the combination of AgNO3 and KF in the thermal shock method can effectively improve the photocatalytic performance of ZnO nanoparticles.
4 Conclusion
In this study, ZnO nanoparticles was modified with AgNO3, KF and both (AgNO3, KF) by thermal shock method in order to create new photocatalysts which can effectively operate under both UVA and visible light. The experimental results show that all modified ZnO catalysts exhibited higher photocatalytic activity than unmodified ZnO sample. The enhanced activity of Ag-ZnO is attributed to silver species (Ag0 and Ag+) on its surface, which is able to create the absorption in the visible region and suppress the charge recombination whereas the improved activity of F-ZnO is assigned to the increase of surface hydroxyl groups and the formation of zinc vacancies, which can promote the generation of hydroxyl radicals and enhance the mobility of photogenerated holes. Therefore, when AgNO3 and KF were combined to modify ZnO by thermal shock method, the synergic effects of AgNO3 and KF did not only created silver species, but also successfully generated zinc vacancies and increased hydroxyl groups on the surface of ZnO nanoparticles, thereby strongly enhancing their photocatalytic performance under both UVA and visible light irradiation.
Acknowledgments
This research is funded by Vietnam National University HoChiMinh City (VNU-HCM) under grant number B2017-18-08.
The authors acknowledge The World Academy of Sciences (TWAS) for their supports under grant number 15-106 RG/CHE/AS_G – FR3240287033.
References
- Verification of resistance to three mediated microbial strains and cancerous defense against MCF7 compared to HepG2 through microwave synthesized plant-mediated silver nanoparticle. Adv. Nat. Sci.: Nanosci Nanotechnol.. 2015;6:1-13.
- [Google Scholar]
- ZnO-based visible-light photocatalyst: Band-gap engineering and multi-electron reduction by co-catalyst. Appl. Catal. B.. 2010;100:502-509.
- [Google Scholar]
- Silver-modified titanium dioxide thin films for efficient photodegradation of methyl orange. Appl. Catal. B. 2003;42:187-201.
- [Google Scholar]
- Influence of thickness and coatings morphology in the antimicrobial performance of zinc oxide coatings. Appl. Surf. Sci.. 2014;307:548-557.
- [Google Scholar]
- Synthesis and characterization of Ag doped TiO2 heterojunction films and their photocatalytic performances. Appl. Surf. Sci.. 2016;390:591-601.
- [Google Scholar]
- Systematic XPS studies of metal oxides, hydroxides and peroxides. Phys. Chem. Chem. Phys.. 2000;2:1319-1324.
- [Google Scholar]
- Understanding the high photocatalytic activity of (B, Ag)-codoped TiO2 under solar-light irradiation with XPS, Solid-state NMR, and DFT calculations. J. Am. Chem. Soc.. 2013;135:1607-1616.
- [Google Scholar]
- Photoemission studies of polymorphic CaCO3 materials. Mater. Res. Bull.. 2002;37:1323-1332.
- [Google Scholar]
- Effect of Ag doping on structural, optical, and photocatalytic properties of ZnO nanoparticles. J. Alloys Compd.. 2015;640:408-415.
- [Google Scholar]
- Ag-doped ZnO nanorods coated metal wire meshes as hierarchical photocatalysts with high visible-light driven photoactivity and photostability. J. Hazard. Mater.. 2014;278:444-453.
- [Google Scholar]
- Calibration of electron spectra. J. Electron. Spectrosc. Relat. Phenom.. 1973;2:295-317.
- [Google Scholar]
- Synthesis of fluorinated TiO2 hollow microspheres and their photocatalytic activity under visible light. Appl. Surf. Sci.. 2011;257:5879-5884.
- [Google Scholar]
- New and highly effient Ag doped ZnO visible nano photocatalyst for removing of methylene blue. J. Mater. Sci.: Mater Electron.. 2017;28:5941-5952.
- [Google Scholar]
- XPS core level spectra and Auger parameters for some silver compounds. J. Electron. Spectrosc. Relat. Phenom.. 1991;56:273-277.
- [Google Scholar]
- Study of surface fluorination of photocatalytic TiO2 by thermal shock method. J. Solid State Chem.. 2012;187:300-308.
- [Google Scholar]
- Surface fluorination of single-phase TiO2 by thermal shock method for enhanced UV and visible light induced photocatalytic activity. Environ.. 2014;144:1-11.
- [Google Scholar]
- Study of the effects of surface modification by thermal shock method on photocatalytic activity of TiO2 P25. Appl. Catal. B.. 2015;165:260-268.
- [Google Scholar]
- Enhanced photocatalytic activity of ZnO nanoparticles by surface modification with KF using thermal shock method. Arab. J. Chem.. 2020;13:1032-1039.
- [Google Scholar]
- Synthesis of photocatalytic nanosized TiO2–Ag particles with sol–gel method using reduction agent. J. Mol. Catal. A: Chem.. 2005;242:135-140.
- [Google Scholar]
- CRC Handbook of Chemistry and Physics (90th ed.). Boca Raton, Florida: CRC Press; 2009.
- Effects of noble metal modification on surface oxygen composition, charge separation and photocatalytic activity of ZnO nanoparticles. J. Mol. Catal. A: Chem.. 2006;244:193-200.
- [Google Scholar]
- UV- and visible-light photocatalytic activity of simultaneously deposited and doped Ag/Ag(I)-TiO2 photocatalyst. J. Phys. Chem. C. 2012;116:17721-17728.
- [Google Scholar]
- Synthesis of (Ag, F)-modified anatase TiO2 nanosheets and their enhanced photocatalytic activity. New J. Chem.. 2016;40:2135-2144.
- [Google Scholar]
- Synthesis and characterization of Ag- or Sb-doped zno nanorods by a facile hydrothermal route. J. Phys. Chem. C.. 2010;114:12401-12408.
- [Google Scholar]
- Photochemical synthesis of ZnO/Ag2O heterostructures with enhanced ultraviolet and visible photocatalytic activity. J. Mater. Chem. A.. 2014;2:7272-7280.
- [Google Scholar]
- Photocatalytic transformation of organic compounds in the presence of inorganic anions. 1. hydroxyl-mediated and direct electron-transfer reactions of phenol on a titanium dioxide-fluoride system. Langmuir.. 2000;16:2632-2641.
- [Google Scholar]
- Carbon doped ZnO: synthesis, characterization and interpretation. J. Magn. Magn. Mater.. 2013;329:146-152.
- [Google Scholar]
- Structural, FTIR and photoluminescence studies of Cu doped ZnO nanopowders by co-precipitation method. Opt. Mater.. 2012;34:1946-1953.
- [Google Scholar]
- Synthesis, characterization, and photocatalytic properties of surface-modified, silver-doped ZnO. Res. Chem. Intermed.. 2011;37:531-539.
- [Google Scholar]
- Photocatalytic hydrogen evolution from CdS-ZnO-CdO systems under visible light irradiation: Effect of thermal treatment and presence of Pt and Ru cocatalyst. Int. J. Hydrogen Energy. 2008;33:4265-4273.
- [Google Scholar]
- XPS study of the halogenation of carbon black—Part 2: chlorination. Carbon. 1995;33:63-72.
- [Google Scholar]
- Enhanced remote photocatalytic oxidation on surface-fluorinated TiO2. Langmuir. 2004;20:11523-11527.
- [Google Scholar]
- Photocatalytic degradation of an organic pollutant by zinc oxide – solar process. Arab. J. Chem.. 2016;9:S1858-S1868.
- [Google Scholar]
- Recent developments of the program FULLPROF, commission of powder diffraction. IUCr Newsletter.. 2001;26:12-19.
- [Google Scholar]
- Metal ion and N co-doped TiO2 as a visible-light photocatalyst. J. Mater. Res.. 2004;19:2100-2108.
- [Google Scholar]
- Synthesis of yttrium doped nanocrystalline ZnO and its photocatalytic activity in methylene blue degradation. Arab. J. Chem.. 2016;9:S1618-S1626.
- [Google Scholar]
- Structural characterization of Ag-doped TiO2 with enhanced photocatalytic activity. RSC Adv.. 2015;5:103752-103759.
- [Google Scholar]
- Solek, P., 2009. Techincká Mechanika II, 1st edn. Slovenská technická univerzita v Bratislave, Nakladatel’stvo STU, Bratislava (Technical Mechanics II) in Slovak language.
- Enhanced photocatalytic activity of Ag doped TiO2 nanoparticles synthesized by a microwave assisted method. Ceram. Int.. 2014;40:5489-5496.
- [Google Scholar]
- Ag2O as a new visible-light photocatalyst: self-stability and high photocatalytic activity. Chem. Eur. J.. 2011;17:7777-7780.
- [Google Scholar]
- Highly efficient TiO2 single-crystal photocatalyst with spatially separated Ag and F− bi-cocatalysts: orientation transfer of photogenerated charges and their rapid interfacial reaction. J. Mater. Chem. A. 2016;4:8682-8689.
- [Google Scholar]
- Photocatalysis fundamentals and surface modification of TiO2 nanomaterials. Chin. J. Catal.. 2015;36:2049-2070.
- [Google Scholar]
- Effects of simultaneously doped and deposited Ag on the photocatalytic activity and surface states of TiO2. J. Phys. Chem. B. 2005;109:2805-2809.
- [Google Scholar]
- The absolute energy positions of conduction and valence bands of selected semiconducting minerals. Am. Mineral.. 2010;85:543-556.
- [Google Scholar]
- TiO2 modified with Ag nanoparticles synthesized via ultrasonic atomization-UV reduction and the use of kinetic models to determine the acetic acid photocatalytic degradation. Appl. Surf. Sci.. 2014;321:481-487.
- [Google Scholar]
- Synergistic effect of interfacial lattice Ag+ and Ag0 clusters in enhancing the photocatalytic performance of TiO2. Phys. Chem. Chem. Phys.. 2014;16:19358-19364.
- [Google Scholar]
- Highly efficient room temperature synthesis of silver-doped zinc oxide (ZnO:Ag) nanoparticles: structural, optical, and photocatalytic properties. J. Am. Ceram. Soc.. 2013;96:766-773.
- [Google Scholar]
- Enhancement of photocatalytic activity of mesporous TiO2 powders by hydrothermal surface fluorination treatment. J. Phys. Chem.. 2009;113:6743-6750.
- [Google Scholar]
- Synthesis of monodisperse silver nanoparticles for ink-jet printed flexible electronics. Nanotechnology. 2011;22:1-8.
- [Google Scholar]
- Experimental and first-principle investigation of Cu-doped ZnO ferromagnetic powders. Cryst. Res. Technol.. 2011;46:1143-1148.
- [Google Scholar]


