

Translate this page into:
Characterization of isomeric lipid A species from Pseudomonas aeruginosa PAO1 by non-aqueous capillary electrophoresis with positive and negative ion electrospray tandem mass spectrometry
⁎Corresponding author. dornyei@gamma.ttk.pte.hu (Ágnes Dörnyei)
-
Received: ,
Accepted: ,
This article was originally published by Elsevier and was migrated to Scientific Scholar after the change of Publisher.
Peer review under responsibility of King Saud University.
Abstract
Abstract
Pseudomonas aeruginosa is a priority target pathogen for antibiotic research and development because of its high resistance to a wide range of antibiotics. Acquisition of resistance is sometimes associated with modifications of the lipid A component present in the outer membrane of most Gram-negative bacteria. For a deeper understanding of subtle chemical variations of lipid A in relation to biological properties, the structural elucidation of lipid A species within a bacterial strain is of crucial importance. However, the simultaneous presence of monophosphorylated positional isomers in naturally heterogeneous lipid A samples cannot easily be recognized with direct MS measurements or with conventional LC-MS strategies. Herein, we present the application of a non-aqueous capillary electrophoresis (NACE) method coupled to positive and negative ion electrospray tandem mass spectrometry with collision-induced dissociation (CID) activation technique for the in-depth analysis of the lipid A isolate of P. aeruginosa PAO1. The main advantage of our NACE strategy is its separation power regarding the site of phosphorylation of the lipid A structures, which makes it a good orthogonal technique to chromatographic characterizations of the bacterial lipid A composition, where the separation is mainly based on acylation differences of the species. Overall, the results of this electrophoretic approach revealed hitherto unreported isomeric monophosphorylated PAO1 lipid A constituents, including both phosphate and acyl chain positional isomers. The parallel fragmentation in the complementary positive and negative ion modes enabled the unequivocal assignment of the phosphorylation site and position of acyl chains in lipid A compounds of three acylation families ranging from tetra- to hexa-acylation. Moreover, C1-monophosphorylated lipid A species have been identified in P. aeruginosa for the first time.
Keywords
Lipid A
Phosphorylation isomers
Acylation isomers
Non-aqueous capillary electrophoresis
Tandem mass spectrometry

1 Introduction
Pseudomonas aeruginosa is a ubiquitous nosocomial pathogen, one of the deadliest bacteria in hospitals. Moreover, this gram-negative bacterium has numerous intrinsic resistance mechanisms against antibiotics, leading to several antibiotics becoming useless (Potron et al., 2015; Moradali et al., 2017). For these reasons, P. aeruginosa is ranked by the World Health Organization (WHO) as a priority number one pathogen for the research and development of new antibiotic strategies. One of the new directions in antibiotic strategy development involves membrane-active agents that induce bacterial cell membrane destabilization leading to the loss of its integrity (Pang et al., 2019). For this purpose, it is essential to know the detailed composition and structure of the bacterial cell wall constituents.
The outer leaflet of the Gram-negative outer membrane is mainly a highly ordered lipopolysaccharide (LPS) monolayer. LPS molecules (often called endotoxins) are composed of three distinct structural regions: a polysaccharide called the O-antigen, the core oligosaccharide, and the hydrophobic and endotoxic lipid A portion (Wang and Quinn, 2010). Lipid A – as the membrane-integrated part of LPS – generally consists of a β-(1′→6)-linked 2-amino-2-deoxy-D-glucose disaccharide backbone carrying phosphate groups at the C4′ and C1 positions, as well as amide- and ester-linked hydroxy fatty acids or O-acylated hydroxy fatty acids at the C2′/C2 and C3′/C3 positions (Molinaro et al., 2015). Naturally, lipid A isolates are heterogeneous mixtures of various lipid A molecules that differ in the number, position, and type of acyl chains and phosphate groups.
Lipid A components (without derivatization) from Pseudomonas strains have been investigated previously by direct infusion tandem mass spectrometry (MS/MS) via collision-induced dissociation (CID) activation in negative ion mode (Ernst et al., 1999; Bedoux et al., 2004; Corsaro et al., 2004). Significant structural heterogeneity has been proven for the isolates by the observation of tetra-, penta-, and hexa-acylated lipid A species. The disaccharide backbone of these molecules was shown to be substituted by one or two phosphate groups, as well as fatty acids and hydroxy fatty acids with mainly 10 and 12 carbon atoms. A few examples have recently demonstrated the analysis of Pseudomonas lipid A isolates by thin layer chromatography (TLC) or liquid chromatography (LC), followed by MS or MS/MS for an in-depth insight into the structural diversity in the highly heterogeneous samples (Wang et al., 2015; Froning et al., 2020; Buré et al., 2021). Amongst them, the LC-MS/MS strategy developed by Buré et al. (2021) allowed the discovery of isomeric structures (with different locations of the acyl chains on the diglucosamine backbone) of some tri-, tetra-, and penta-acylated C4′-monophosphorylated species in the lipid A isolate of P. aeruginosa PAO1 strain. In that study, two complementary MS/MS activation methods – ultraviolet photodissociation (UVPD) and higher-energy collisional dissociation (HCD) – were used in negative ion mode for the analysis of lipid A profiles, including the localization of hydroxyl groups on fatty acyl chains.
A complicating factor for lipid A identification within complex mixtures by LC-MS/MS is the recognition of chimera mass spectra of co-eluting positional isomers of monophosphorylated species, in which the single phosphate group bound to different positions (at C1 or C4′) of the diglucosamine backbone. In such chimera mass spectra, fragments from both precursor ions are present; however, the resulting fragmentation pattern recorded in the commonly used negative ion mode highly resembles that of the C4′-phosphorylated species alone, thus the presence of the C1-phosphorylated analog remains hidden. On the other hand, investigation for the positive ion mode CID decompositions can make it easier to identify chimeras, since during the CID processes of the protonated lipid A (Sforza et al., 2004) or the triethylammonium lipid A adduct (Kondakov and Lindner, 2005; Sándor et al., 2018), primarily the glycosidic bonds are cleaved producing distinguishable B-type ions (according to the nomenclature introduced by Domon and Costello (1988)) that are diagnostic for the phosphorylation sites. In order to avoid the formation of a chimera mass spectrum, the two phosphorylation positional isomers must be separated prior to their mass spectrometry analysis. This need, and the observed differences between the CID mass spectra of the two polarity modes, have motivated the development of a non-aqueous capillary electrophoresis (NACE) method coupled to tandem mass spectrometry in both negative and positive ionization modes for the separation and structural characterization of both phosphate positional isomers of lipid A (Sándor et al., 2020). The NACE can be considered as an orthogonal technique to conventional RP-HPLC strategies (O'Brien et al., 2014; Sándor et al., 2016; Froning et al., 2020; Buré et al., 2021; Okahashi et al., 2021), since, by NACE, the phosphorylation isomers are baseline separated, while by RP-HPLC, the lipid A molecules are primarily separated according to their acylation profile.
In this study, the lipid A isolate from P. aeruginosa PAO1 was analyzed by the NACE-MS/MS method with CID fragmentation in both positive and negative ion modes. The results of this orthogonal strategy extended the results of the previous LC-MS/MS method (Buré et al., 2021), since the presence of several C1-monophosphorylated lipid A isomers was proved, and even additional acyl chain positional isomers were identified. Moreover, the complementary roles of the positive and negative ion CID mass spectra for the characterization of acyl chain positional isomers of C1-monophosphorylated species in lipid A sample are demonstrated for the first time.
2 Materials and methods
2.1 Chemicals and samples
Methanol (LC-MS Chromasolv grade), chloroform (Chromasolv Plus, for HPLC, ≥99.9%), triethylamine (Et3N, eluent additive for LC-MS), acetic acid (AcOH, eluent additive for LC-MS) were purchased from Sigma-Aldrich (Steinheim, Germany).
2.2 Bacterial strain and culture conditions
Pseudomonas aeruginosa PAO1 was cultured at 25 °C in a laboratory fermentor on Mueller-Hinton broth at pH 7.2, until it reached the late logarithmic phase (about 10 h), and then collected by centrifugation. The bacterial LPSs were extracted from acetone-dried organisms by the traditional hot phenol/water procedure (Westphal et al., 1952) in a yield of 5% of bacterial cell dry mass and were lyophilized.
2.3 Lipid A isolation and sample preparation
Lipid A was released from LPS by acid hydrolysis with 1% (v/v) AcOH (pH 3.9) at 100 °C for 1 h; then, the solution was centrifuged (8000 × g, 4 °C, 20 min). The pellet containing lipid A was washed four times with distilled water and lyophilized. About 0.1 mg lipid A was dissolved in 200 μL of methanol:chloroform (50:50, v/v) mixture and centrifuged for 5 min with 21 000 × g.
2.4 NACE–ESI-Q-TOF MS/MS
Measurements by non-aqueous capillary electrophoresis (NACE) were performed using a 7100 CE system (Agilent Technologies, Waldbronn, Germany) and the Chemstation Rev. B.04.03. software. A previous NACE method (Sándor et al., 2020) was adapted for the analysis of P. aeruginosa PAO1 lipid A. Briefly, modifications included small differences in the concentrations of individual components of the background electrolyte (BGE), and chloroform was used instead of dichloromethane. For NACE separations, the modified BGE consisted of methanol:chloroform:Et3N:AcOH (50:50:0.72:0.24, v/v/v/v) and bare fused silica capillary (50 μm i.d., 375 μm o.d.; Polymicro Technologies, Phoenix, AZ, USA) with a length of 55 cm were used. Before the first use of a new capillary, it was preconditioned by flushing with methanol for 5 min, 1 M NaOH for 10 min, water for 10 min, and BGE for 10 min. Before each injection, the capillary was equilibrated for 5 min by flushing it with the BGE. The sample was injected by applying 50 mbar of pressure for 15 s; then, a BGE plug was injected by applying 50 mbar of pressure for 5 s. The temperature of the capillary was kept at 20 °C. An initial voltage ramp was applied, i.e., the separation voltage was increased linearly from 0 to –30 kV in 0.3 min; then it was kept at –30 kV (cathode at the inlet). The separation was assisted by pressure, i.e., an external pressure of 5 mbar was applied to the inlet of the capillary during the first 25 min of the separation. Then, a pressure of 30 mbar starting at 25 min was used to overcome the cathodic mobility of the electroosmotic (counter) flow.
The CE instrument was connected to a 6530 Q-TOF mass spectrometer (Agilent Technologies, Singapore) with an Agilent Jet Stream electrospray ionization (ESI) interface. The mass spectrometer was operated using MassHunter B.04.00 software. The 4 cm of polyimide layer was removed at the outlet end of the fused silica capillary. Then, it was sealed into the triaxial electrospray interface (protruding about 0.3 mm out of the sprayer tip). The spray needle (Agilent G7100–60041) of the interface was made of platinum to avoid corrosion. The coaxial sheath liquid was 0.06% (v/v) Et3N and 0.02% (v/v) AcOH in methanol. It was delivered at a 10 μL/min flow rate to the interface, by an isocratic pump (Agilent Technologies) equipped with a 1:100 splitter. ESI MS and MS/MS measurements were carried out in both negative and positive ion modes. The ESI voltage was set at 3000 V. A flow rate of heated nitrogen drying gas (temperature 200 °C) was maintained at 5.0 L/min. The nebulizer nitrogen gas pressure was set at 15 psi, except for the sample injection period, when it was reduced to 1 psi. The flow rate and temperature of the Agilent Jet Stream curtain gas were 2 L/min and 90 °C, respectively. The MS data were collected in the range of m/z 600–2100 at a rate of 3 spectra/s. Identification of ion peaks was performed by CID MS/MS experiments in both positive and negative ion modes by applying collision energies in the 30–70 eV range. MS/MS spectra were acquired in the range of m/z 50–2100 at the scan rate of 2 spectra/s.
3 Results and discussion
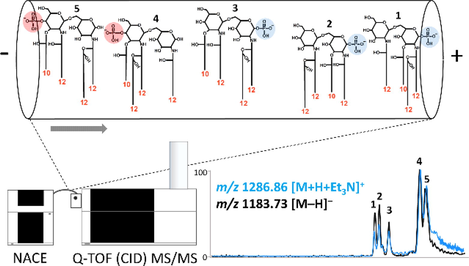
Pseudomonas aeruginosa is a resistant bacterium that can be cultivated in a wide variety of conditions and temperatures. The optimum temperature for its growth is 37 °C (the human physiological temperature), but it can also survive at environmental temperatures, e.g., between 18 and 25 °C (the same as the ambient temperature for hospitalized patients), or at higher temperatures, such as 42 °C (a characteristic value in the veterinarian bacteriology). Here, a modified NACE-(CID) MS/MS method for the analysis of lipid A phosphorylation and acylation isomers was applied to reveal the P. aeruginosa PAO1 lipid A heterogeneity when grown at room temperature (25 °C). Although with a newly developed HPLC-(HCD/UVPD)MS/MS method (Buré et al., 2021), several previously unreported lipid A acyl chain positional isomers had been explored in the PAO1 strain (grown at 37 °C), our unique orthogonal separation system allowed the recognition of additional lipid A structures, identified as C1-monophosphorylated species. Fig. 1 shows representative extracted ion electropherograms of tetra-, penta-, and hexa-acylated lipid A that appeared in even more isomeric forms than observed by the above-mentioned chromatographic separation (Buré et al., 2021) for this Pseudomonas strain (the exact compositions of the separated species are summarized in Table S1).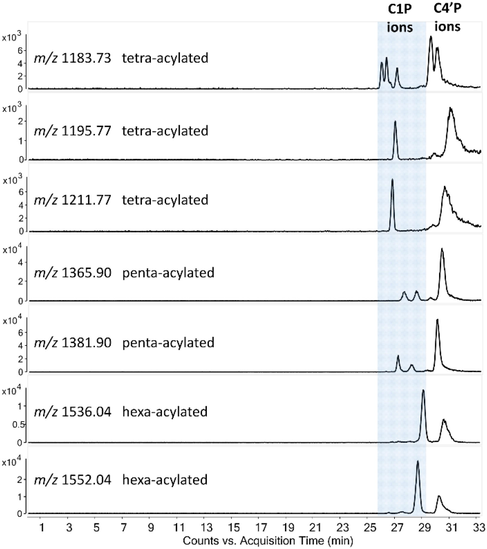
NACE-MS extracted ion electropherograms (EIEs) of some representative deprotonated ions from the tetra-, penta-, and hexa-acylated lipid A families presented in the P. aeruginosa PAO1 extract. Capillary dimensions: 55 cm × 50 µm, applied voltage: –30 kV (reversed CE polarity, detection at the anodic end), pressure assistance: 0 min: 5 mbar, 25 min: 30 mbar. BGE: 50:50 (v/v) methanol:chloroform with 0.72:0.24 (v/v) Et3N:AcOH. Notations: C1P refers to C1-monophosphorylated, and C4′P refers to C4′-monophosphorylated lipid A species. Confirmation of the phosphorylation site was based on the positive ion CID mass spectra of lipid A.
Ions of each acylation state were separated into two distinct migration zones depending on the position of the phosphate group, i.e., lipid A containing the phosphate group at the C1 position (C1P) migrated faster toward the anode (MS detection) than that having it at the C4′ position (C4′P) (Fig. 1). This phenomenon could most probably be related to the three-dimensional structure of the ions in the non-aqueous BGE. Typically, the factors influencing the conformation of a lipid A molecule are (1) the length and number of the acyl chains, (2) the distribution of acyl groups on the diglucosamine backbone, (3) the distribution of polar functional groups, i.e., the position of the phosphate group in a monophosphorylated species. The ratio of the effective cross-sectional area of the hydrophilic phosphorylated diglucosamine domain and the hydrophobic acyl domain essentially defines the shape, thus the size of the lipid A ion. Based on the order of migration seen in the electropherograms, we assume that the charge carrier phosphate group located at the C1 position (instead of C4′) provided a smaller radius of the lipid A anion.
Another observation from the extracted ion electropherograms shown in Fig. 1 was that the ratio of the C1P and C4′P phosphorylation isomers varied for the different acylation families (e.g., for tetra- and penta-acylated lipid A, the C4′P ions were the abundant species, while for hexa-acylated lipid A, it was the C1P). Moreover, for some of the extracted mass-to-charge profiles, one or both migration zones were resolved into more than one electrophoretic peak corresponding to lipid A isomers with different distribution of fatty acids. Namely, for the tetra-acylated lipid A at m/z 1183.73, four C1P and two C4′P acylation isomers, and for the penta-acylated lipid As at m/z 1365.90 and 1381.90, two C1P acylation isomers were detected. No fatty acyl chain positional isomers were confirmed for the tetra-acylated species at m/z 1195.77 and 1211.77, and for the hexa-acylated species at m/z 1536.04 and 1552.04.
It can also be observed from Fig. 1 that the structures containing more hydroxy fatty acids within the three families of acylated lipid A had higher mobilities (note the migration order of the tetra-acylated ions at m/z 1211.77 and 1195.77, the penta-acylated ones at m/z 1381.90 and 1365.90, and the hexa-acylated ones at m/z 1552.04 and 1536.04, each differing by 16 Da, the mass of an oxygen atom).
The structural evaluation of the separated lipid A isomers was based on CID experiments performed in positive and negative ionization modes of selected [M + H + Et3N]+ and [M – H]– lipid A precursor ions, respectively. CID is still the most common and widely applied method of fragmentation in lipid A analysis, however, it does not provide as much structural information as we can obtain from other ion activation modes, such as UVPD (Madsen et al., 2011). Nevertheless, we found that the combined use of positive and negative ion mode CID fragmentation can expand the diversity of possible cleavage sites, and the two modes provide complementary structural information of lipid A. The most demonstrative example can be seen in Fig. 2, where the separation of five and structural verification of six tetra-acylated lipid A isomers (compounds 1 – 5 and 3*) achieved by NACE-(CID)MS/MS of the positively charged triethylammonium adduct at m/z 1286.86, and the negatively charged deprotonated lipid A precursor ion at m/z 1183.73 are presented.![Structural characterization of the representative tetra-acylated lipid A isomers (compounds 1 – 5) from PAO1. (A) Overlaid and aligned electropherograms of the [M + H + Et3N]+ ion extracted at m/z 1286.86 and the [M – H]– ion extracted at m/z 1183.73 obtained by NACE–ESI-QTOF MS analysis in positive and negative ionization modes, respectively. (B, C) Tandem mass spectra of the isomers achieved by positive and negative ion CID, respectively. (D) Proposed structures of the separated isomers with the depiction of all the cleavage sites cleaved in either the positive or the negative ion CID experiment. Italic labels correspond to the co-migrating isomer, compound 3* (see structure in Fig. S1).](/content/184/2023/16/8/img/10.1016_j.arabjc.2023.104944-fig3.png)
Structural characterization of the representative tetra-acylated lipid A isomers (compounds 1 – 5) from PAO1. (A) Overlaid and aligned electropherograms of the [M + H + Et3N]+ ion extracted at m/z 1286.86 and the [M – H]– ion extracted at m/z 1183.73 obtained by NACE–ESI-QTOF MS analysis in positive and negative ionization modes, respectively. (B, C) Tandem mass spectra of the isomers achieved by positive and negative ion CID, respectively. (D) Proposed structures of the separated isomers with the depiction of all the cleavage sites cleaved in either the positive or the negative ion CID experiment. Italic labels correspond to the co-migrating isomer, compound 3* (see structure in Fig. S1).
Under positive ion mode CID conditions, the dominant cleavage sites of all isomers are the glycosidic bond cleavages at the C1 and C1′ positions (1α and 1′α bonds, respectively) resulting in two intensive fragments known as B2 and B1 ions (Domon and Costello, 1988; Kondakov and Lindner, 2005; Casillo et al., 2017; Sándor et al., 2018) (Fig. 2B). As the 1α bond is one of the possible sites of phosphorylation, the B2 ion formed by its cleavage (following the loss of the adduct-forming agent, Et3N) is diagnostic for the phosphorylation pattern of lipid A. Accordingly, the B2 ion peak at m/z 1087.76 in the tandem mass spectra of the first three isomers (compounds 1 – 3), formed by the loss of Et3N + H3PO4 (199 Da), indicated the C1 position of the phosphate group, whereas for compounds 4 and 5, the B2 ion at m/z 1167.74, generated by the loss of Et3N + H2O (119 Da), revealed their C4′ phosphorylation site.
Cleavage of the 1′α bond resulted in two complementary fragments in the CID mass spectra (Fig. 2B), such as the B1 (which was mostly the base peak) and the small-intensity Y1–1α ions. It should be noted that the Y1–1α ion could be easily identified in each mass spectrum by subtracting the m/z value of B1 from the m/z value of B2 and then, adding the mass of a proton. Knowing that Pseudomonas lipid A contains fatty acids and hydroxy fatty acids of mainly 10 and 12 carbon atoms, (Bedoux et al., 2004; Corsaro et al., 2004; Froning et al., 2020; Buré et al., 2021) the masses of the B1 and Y1–1α ions allowed the determination of the distribution of acyl chains between the non-reducing and reducing glucosamines of each of the isomers, as follows. Consequently, the B1-type fragment formed from the first tetra-acylated isomer (compound 1) at m/z 360.24 represented a non-phosphorylated, mono-acylated non-reducing glucosamine part carrying an amide-linked C12:0(3-OH) presumably at the C2′ primary position (note that amide bonds are more stable than ester bonds under CID conditions). Consequently, the ion at m/z 728.53 was the Y1–1α ion carrying three hydroxylated fatty acids, one with 10 and two with 12 carbon atoms (at this point the position of these fatty acids could not be determined). Analogously, a non-phosphorylated, but diacylated B1 and a diacylated Y1–1α ion pair was observed for compound 2 at m/z 558.40 (carrying two 12-carbon hydroxy fatty acids) and 530.37 (carrying one 10-carbon and one 12-carbon hydroxy fatty acids), respectively, and for compound 3 at m/z 530.37 (carrying one 10-carbon and one 12-carbon hydroxy fatty acids) and 558.39 (carrying two 12-carbon hydroxy fatty acids), respectively. Interestingly, in the tandem mass spectrum of compound 3, fragments of a co-migrating isomer (compound 3*) were also observed at m/z 728.53 and 360.23. These masses could only be correlated with a non-phosphorylated, triacylated B1 (carrying one 10-carbon and two 12-carbon hydroxy fatty acids) and a mono-acylated Y1–1α ion carrying a C12:0(3-OH) certainly at the C2 primary position. Since only one B2 ion was observed in the chimera mass spectrum, we could verify that both compound 3 and the co-migrating compound 3* contained a non-phosphorylated non-reducing part. For the C4′P isomers (compounds 4 and 5), only phosphorylated B1 ions were observed (Fig. 2B). The peak at m/z 808.50 for compound 4 correlated with a phosphorylated, triacylated B1 (carrying one 10-carbon and two 12-carbon hydroxy fatty acids), and that at m/z 360.23 was a monoacylated Y1–1α ion carrying an amide-linked C12:0(3-OH) presumably at C2. For compound 5, the peak at m/z 610.33 corresponded to a phosphorylated, diacylated B1 (carrying one 10-carbon and one 12-carbon hydroxy fatty acids) and that at m/z 558.40 to a diacylated Y1–1α ion (carrying two hydroxy fatty acids with 12 carbon atoms).
It is known that if a fatty acyl chain loss derived from the B1 ion is observed, then the assignable cleavage site is the 2′ε bond; otherwise, if acyl loss from the B1 ion is not detected, then (most possibly) no secondary substituent is linked to the C2′ primary acyl chain (Sándor et al., 2018). Accordingly, a fragment due to the loss of a fatty acid (216.18 Da) from the B1 ion was observed only in the tandem mass spectra of compound 2 (at m/z 342.23), 3* (at m/z 512.36) and 4 (at m/z 592.31), revealing a C12:0(2-OH) in the C2′ secondary position for these isomers (note that the hydroxyl group had been identified at the 2 position for the secondary hydroxy fatty acids of P. aeruginosa lipid A (Buré et al., 2021)). Based on the observations so far, the acylation profile of the non-reducing part of compound 2 could be deduced: C2′ carried a C12:0(3-O-C12:0(2-OH)), and the –OH at C3′ was free.
Furthermore, it is known that if the C2 primary fatty acid is substituted, then loss of the C2 secondary fatty acid from the B2 ion (i.e., cleavage of the 2ε bond) is observed; whereas in the absence of a C2 secondary acyl chain, joint cleavage of the 3α + 4α bonds is mostly visible (Sándor et al., 2018). With help of this rule, the presence of a C12:0(2-OH) in the C2 secondary position could be confirmed for compounds 1, 3, and 5 by the small-intensity peaks at m/z 871.58, 871.59, and 951.55, respectively, derived by the same type of loss (216.18 Da) from the respective B2 ions. For compound 2, the fragment observed by 206.15 Da mass difference from the B2 ion could be attributed to the parallel losses of a C10:0(3-OH) from the C3 primary position and a water molecule from the C4 position; consequently, the C2 primary substituent must be a C12:0(3-OH). Loss of two water molecules (36.02 Da) from the C3 and C4 positions from the B2 ion was observed for compounds 3 and 4 by the peaks at m/z 1051.73 and 1131.71, respectively, implying their free C3 primary position. Overall, the positive ion CID experiments allowed the full structural assignment of compound 2 (Fig. 2D), and the determination of fatty acids on the non-reducing part of compound 1 and the reducing parts of compounds 3, 3*, 4, and 5 (Fig. 2D and Fig. S1).
Next, an evaluation of the negative ion mode tandem mass spectra of the deprotonated tetra-acyl isomers at m/z 1183.73 (Fig. 2C) was needed to establish (and verify) the acylation patterns of the six isomers in full. For the three separated and one co-migrating C1P isomers, highly similar fragmentation patterns were observed, displaying the same fragment ions at m/z 995.66 (formed by the loss of a 10-carbon hydroxy fatty acid), 967.63 (formed by the loss of 12-carbon hydroxy fatty acid), and 779.48 (formed by the loss of both of these fatty acids), only the relative intensities of the ion peaks were different. Here, it should be noted that in order to distinguish the structure of several C1P isomers based on their CID mass spectra in the negative ion mode, the compounds must first be separated electrophoretically and analyzed by positive ion MS/MS. Considering the acyl chain distribution determined by positive mode CID (vide supra) and knowing that only ester-linked fatty acids are split during low-energy CID conditions, the peak at m/z 995.66 for compound 1 could only be attributed to the loss of a C10:0(3-OH) linked at the C3 primary position, and that at m/z 779.48 to further loss of the C2 secondary C12:0(2-OH) linked to a C12:0(3-OH) at the C2 primary position. Hence, the full structure of compound 1 could be revealed, as well (Fig. 2D). The full structure of compound 2 was already assigned from positive ion CID; while the peaks at m/z 967.63 and 779.48 obtained by negative ion MS/MS confirmed that a C12:0(2-OH) substituent is linked at the C2′ secondary, and a C10:0(3-OH) is connected at the C3 primary positions. In the negative mode CID mass spectrum of compound 3 (having a C2 secondary C12:0(2-OH) on the reducing part) and the co-migrating isomer, compound 3* (having a C2′ secondary C12:0(2-OH) on the non-reducing part), both having a free C3 position, the peak at m/z 967.63 must be originated from the loss of a C10:0(3-OH) at C3′ for both isomers, and that at m/z 779.48 derived from the loss of a secondary C12:0(2-OH) linked at C2 or, in the case of compound 3*, at C2′. It should also be noted that for all three C1P isomers, cleavages of the 2′δ or 2δ bonds (Okahashi et al., 2021) generated the fragment at m/z 623.32 by the loss of a C9:0(CHO) aliphatic aldehyde from the unbranched amide-linked fatty acid only (thus confirming a C12:0(3-OH) at the C2′ or C2 primary positions, depending on the isomer).
The negative ion mode tandem mass spectra of the C4′P isomers (compounds 4 and 5 in Fig. 2C) showed different fragmentation patterns from that of the C1P isomers (compounds 1–3) since different rules governed their fragmentation in the gas phase. The well-established dissociation characteristics of deprotonated C4′P lipid A ions – namely the diagnostic acid/ketene loss of the C3′ primary fatty acid and the presence of 0,2A2 and 0,4A2-type cross-ring fragments in their CID mass spectrum (Madalinski et al., 2006) – made the structural identification of compounds 4 and 5 more straightforward. The loss of a C10:0(3-OH) as an acid and as a ketene (undoubtedly from position C3′) gave rise to the ions at m/z 995.57 and 1013.58 for both compounds. The same pair of acid/ketene loss was also observed from the 0,2A2 ions for both compounds, producing fragments at m/z 738.38/756.38 in the case of compound 4, and at m/z 540.21/558.22 in the case of compound 5. Further loss of the C2′ secondary fatty acid (C12:0(2-OH)) – being less labile than the C3′ primary fatty acid – was registered for compound 4 by the 0,2A2-type ion at m/z 522.20. Moreover, the mass of the mono-acylated 0,2A2 ion at m/z 522.20 for compound 4 revealed a C12:1 residue (generated in a CID process from the C12:0(3-O(C12:0(2-OH)), while that at m/z 540.21 for compound 5 indicated a C12:0(3-OH) linked at the C2′ primary position. In summary, the combined interpretation of CID fragmentation in positive and negative ion modes of the five separated and one co-migrating tetra-acyl lipid A isomer allowed the assignment of the structures depicted in Fig. 2D and S1. It should be noted here that the structural analysis of these two tetra-acylated C4′P isomers confirmed the previous observations of Buré et al. (2021); however, C1P compounds were not detected previously by HPLC-MS/MS (see Table S1 for a comparison).
To further demonstrate the separation power of our NACE-MS/MS strategy, the characterization of penta-acylated lipid A isomeric precursors at m/z 1469.12 in the positive, and at m/z 1365.92 in the negative ion mode is shown in Fig. 3. The overlaid electrophoretic profiles of the [M + H + Et3N]+ and [M – H]– ions in Fig. 3A indicated three separated isomeric forms (compounds 6 – 8), of which the first two were C1P, and the third one was a C4′P isomer based on the B2 ion formation in their positive ion CID mass spectra (Fig. 3B). For all three isomers, a small-intensity peak (at m/z 1053.79, 1053.79, and 1138.82, respectively) with 216.18 Da difference from the respective B2 ions revealed the presence of a C12:0(2-OH) at the C2 secondary position, whereas the same 216.8 Da loss from the B1 ions (generating the peaks at m/z 342.27, 512.41 and 592.38, respectively) confirmed the presence of a C12:0(2-OH) at the C2′ secondary position. Next, the acyl chain distribution was concluded from the masses of the complementary B1 and Y1–1α ions. Accordingly, compound 6 had a diacylated non-reducing part (carrying a hydroxylated and a non-hydroxylated fatty acid of 12-carbon atoms) and a triacylated reducing saccharide (carrying one 10-carbon and two 12-carbon hydroxy fatty acids), whereas compounds 7 and 8 had a triacylated non-reducing part (carrying one 10-carbon and two 12-carbon fatty acids and two out of these three being hydroxylated) and a diacylated reducing part (carrying two 12-carbon hydroxy fatty acids).![Structural characterization of the representative penta-acylated lipid A isomers (compounds 6, 7, and 8) from PAO1. (A) Overlaid and aligned electropherograms of the [M + H + Et3N]+ ion extracted at m/z 1469.12 and the [M – H]– ion extracted at m/z 1365.92 obtained by NACE–ESI-QTOF MS analysis in positive and negative ionization modes, respectively. (B, C) Tandem mass spectra of the isomers achieved by positive and negative ion CID, respectively. (D) Proposed structures of the separated isomers with the depiction of all the cleavage sites cleaved in either the positive or the negative ion CID experiment.](/content/184/2023/16/8/img/10.1016_j.arabjc.2023.104944-fig4.png)
Structural characterization of the representative penta-acylated lipid A isomers (compounds 6, 7, and 8) from PAO1. (A) Overlaid and aligned electropherograms of the [M + H + Et3N]+ ion extracted at m/z 1469.12 and the [M – H]– ion extracted at m/z 1365.92 obtained by NACE–ESI-QTOF MS analysis in positive and negative ionization modes, respectively. (B, C) Tandem mass spectra of the isomers achieved by positive and negative ion CID, respectively. (D) Proposed structures of the separated isomers with the depiction of all the cleavage sites cleaved in either the positive or the negative ion CID experiment.
By the thorough analysis of the negative ion mode tandem mass spectra (Fig. 3C) of the two penta-acylated C1P lipid A positional isomers (compounds 6, 7), we can draw a general conclusion that the slight intensity differences of the ion peaks are signs of different acylation patterns in the case of C1P lipid A species. We have to emphasize again that the two structures could not be distinguished without the knowledge previously obtained from the positive mode CID (Fig. 3B), following their electrophoretic separation. Upon CID in the negative mode, eliminations of the already determined C2′ and C2 secondary C12:0(2-OH) substituents, i.e., cleavages of the 2′ε and 2ε bonds produced signals at m/z 1165.73 and 949.56, from which additional loss of an ester-linked C10:0(3-OH) was observed by the peak at m/z 761.42. Based on the previously assumed acyl chain distribution of the two C1P isomers from the Y1–1α ions (vide supra), the suggested attachment site of this 10-carbon hydroxy fatty acid must be at C3 for compound 6 and at C3′ for compound 7. Consequently, two C12:0(3-OH) must be linked as fatty acid amides at positions C2 and C2′ for both isomers (note that the 2β-cleavage fragment at m/z 581.27, and the Z-type inter-ring ion series detected in the smaller mass region could be used to verify the type of C2 primary and secondary acyl chains). With this, the structure of the first two penta-acylated isomeric compounds became known. In addition, an observation regarding the cleavage mechanism of these compounds under negative ion CID conditions was that the cleavage of the 3α bond is more favorable than that of the 3′α bond, as the peak at m/z 1177.77 (corresponding to the loss of a C10:0(3-OH) from these positions; Fig. 3C) was more intensive for compound 6 than for compound 7. Applying this knowledge of the order of elimination of the ester-linked fatty acyl chains became especially useful for the structural interpretation of the hexa-acylated C1P isomer of PAO1 (vide infra).
The penta-acylated compound 8 presented a typical CID pattern of deprotonated C4′P lipid As (Fig. 3C). The peak pairs at m/z 1177.76/1195.78, 722.40/740.41, and 662.38/680.39, resulting from the competitive acid and ketene losses of the primary fatty acid from the precursor, the 0,2A2 ion, and the 0,4A2 ion, respectively, revealed a C10:0(3-OH) at C3′. Furthermore, an acyl-loss fragment detected at m/z 961.59 was derived from the loss of the labile C2 secondary fatty acid (a C12:0(2-OH)) on the reducing end, while those detected at m/z 522.22 and 462.20 were formed by the loss (from the 0,2A2 and 0,4A2 ion, respectively) of a C12:0(2-OH) at the C2′ secondary position on the non-reducing end. Finally, the mono-acylated 0,2A2 and 0,4A2 ions defined a C12:1 residue (generated during the elimination of a 3-O linked fatty acid) at the C2′ primary position, thus, the other C12:1 residue was linked at the C2 primary site. It should be noted here again that the structural analysis of this penta-acylated C4′P isomer confirmed the previous observation of Buré et al. (2021), however, no corresponding C1P analogs were previously found by LC-MS/MS.
Finally, the structure elucidation of two hexa-acylated, baseline-separated phosphate positional isomers (compounds 9 and 10) is presented in Fig. 4, of which the C1P compound (similarly to all the presented C1P molecules) has not yet been discovered in P. aeruginosa. The positive ion CID mass spectra of their triethylammonium adducts at m/z 1639.15 (Fig. 4B) pinpointed the location of the phosphate group at C1 for the compound 9 (as the B2 ion was formed by –199 Da) and at C4′ for the compound 10 (because the + B2 ion was formed by –119 Da). Further cleavage of the 2ε bond from the B2 ion could be observed by the peaks (with very low abundance) at m/z 1223.88 and 1303.83, respectively, for the two compounds. For compound 9, joint cleavage of the 3α and 4α bonds was also visible, which revealed a C10:0(3-OH) linked to the C3 position. From the masses of the B1 and Y1 – 1α ion pairs (m/z 712.53 and 728.53 for compound 9, and m/z 792.50 and 728.53 for compound 10), we concluded on a triacylated non-reducing part (carrying one 12-carbon fatty acid and two hydroxy fatty acids, one with 10 and one with 12 carbon atoms) and a triacylated reducing saccharide (carrying one 10-carbon and two 12-carbon hydroxy fatty acids) for both compounds. The peaks at m/z 512.36 and 592.33 formed from the B1 ion of the C1P and C4′P isomers, respectively, confirmed the location of the 12-carbon fatty acid (C12:0) at the C2′ secondary position for both molecules.![Structural characterization of the representative hexa-acylated lipid A isomers (compounds 9 and 10) from PAO1. (A) Overlaid and aligned electropherograms of the [M + Et3N]+ ion extracted at m/z 1639.15 and the [M – H]– ion extracted at m/z 1536.02 obtained by NACE–ESI-QTOF MS analysis in positive and negative ionization modes, respectively. (B, C) Tandem mass spectra of the isomers achieved by positive and negative ion CID, respectively. (D) Proposed structures of the separated isomers with the depiction of all the cleavage sites cleaved in either the positive or the negative ion CID experiment.](/content/184/2023/16/8/img/10.1016_j.arabjc.2023.104944-fig5.png)
Structural characterization of the representative hexa-acylated lipid A isomers (compounds 9 and 10) from PAO1. (A) Overlaid and aligned electropherograms of the [M + Et3N]+ ion extracted at m/z 1639.15 and the [M – H]– ion extracted at m/z 1536.02 obtained by NACE–ESI-QTOF MS analysis in positive and negative ionization modes, respectively. (B, C) Tandem mass spectra of the isomers achieved by positive and negative ion CID, respectively. (D) Proposed structures of the separated isomers with the depiction of all the cleavage sites cleaved in either the positive or the negative ion CID experiment.
The negative ion CID mass spectrum of the deprotonated, hexa-acylated C1P isomer (compound 9) at m/z 1536.04 (Fig. 4C) was dominated by competitive and consecutive losses of the ester-linked acyl chains, as well as Z-type ions in the smaller mass region, as observed for all C1P lipid A ions presented. The peak generated at 1335.84 was due to the loss of a C12:0 from the C2′ secondary position (vide supra) from the precursor. This was followed by eliminations of a 10-carbon (188.14 Da), a 12-carbon (216.17 Da), and again a 10-carbon (188.14 Da) hydroxy fatty acid observed by the peaks at m/z 1147.70, 931.53, and 743.39, respectively. Among these, the middle mass difference (216.17 Da) was also observed between the two Z ions (representative of the reducing saccharide) appearing at m/z 618.34 and 402.17 (after cleavages of the 3α and 2ε bonds, respectively), indicating that a C12:0(2-OH) was lost from the C2 secondary position. Moreover, from the mono-acylated Z ion at m/z 402.17 also the type of the C2 primary fatty acid could be deduced, matching a C12:0(3-OH). Accordingly, it could be concluded that the two C10:0(3-OH) substituents recognized in the acyl loss series must be attached at the C3 and C3′ primary positions as ester-linkages, and of these, the C3 linkage was more labile than the C3′ one (vide supra). Thus, the remaining C12:0(3-OH) substituent on the triacylated non-reducing part must be located at the C2′ primary position (Fig. 4D).
The discernment of the acylation pattern of the C4′P isomer (compound 10) was based on diagnostic acyl loss and A2-type cross-ring product ions displayed in the negative ion CID mass spectrum (Fig. 4C). In analogy with the stepwise dissociation processes described previously for the hexa-acylated lipid A species (Madalinski et al., 2006; Sándor et al., 2016), a series of product ions at m/z 1347.88, 1159.74/1177.75, and 943.57 related to sequential cleavages of the 3α, 3′α, and 2′ε bonds; whereas another series of the 0,2A2 and 0,4A2 ions produced by the consecutive cleavages of the 3′α and 2′ε bonds were present, providing evidence for the structure of compound 10 as illustrated in Fig. 4D.
Finally, a thorough analysis of several C1P and C4′P isomers revealed that metaphosphate (PO3−) ions at m/z 78.96, and dihydrogen phosphate (H2PO4−) ions at m/z 96.97, were always observed in their negative ion mode tandem mass spectra (Figs. 2-4). It could be seen that for lipid A in the C1P form, the intensity of the signal at m/z 78.96 was higher than that at m/z 96.97. On the other hand, for a C4′P lipid A, the intensity ratio was reversed. These two signature ions may also be used to distinguish phosphorylation isomers.
4 Conclusions
Analysis of bacterial cell wall constituents for the development of effective antibacterial strategies is crucial. Here, we have demonstrated that our NACE method coupled to positive and negative ion (CID)MS/MS is a powerful alternative strategy that complements the recently reported HPLC-(UVPD)MS/MS approach (Buré et al., 2021) for the deep characterization of the lipid A composition of P. aeruginosa PAO1. Our electrophoretic method allowed for the discovery of several C1 phosphate positional isomeric compounds among three acylated families (tetra-, penta-, and hexa-acylated species). Some of these were further separated into acyl chain positional isomers, as well, thereby increasing the heterogeneity of the PAO1 lipid A sample. Although it should be noted that we found fewer C4′-monophosphorylated lipid A molecules in P. aeruginosa than reported in the article by Buré et al. (2021). For instance, no triacylated species were detected in our sample and we found no components containing double bonds in their structure. The reason for this observed diversity difference could be explained by the application of different culture temperatures or sample preparation procedures (note that harsher acid hydrolysis conditions, such as increased time, temperature, and acid concentration, have the ability to remove the C1 phosphate moiety and O-linked fatty acids (Qureshi et al., 1986; Wang and Cole, 1996)). Furthermore, some compounds (namely those containing double bonds) can be considered as possible degradation products through the in-source fragmentation mechanism.
In summary, NACE followed by the joint application of both positive and negative ion mode CID experiments provided extended structural information of the acylated families of PAO1 lipid A, in terms of the identification of C1-phosphorylated species. In the wider context of the biological significance of lipid A modifications, it is possible that many other Gram-negative bacteria also produce phosphorylation isomers; however, the C1-phosphorylated compounds next to the C4′-phosphorylated ones cannot easily be recognized with direct MS measurements or with conventional LC-MS strategies. This suggests that important details concerning the lipid A isomeric composition of known Gram-negative pathogens need to be re-examined, for which the presented NACE-(CID)MS/MS approach can be a useful tool. Although, it must be noted that for the full structural elucidation of lipid A molecules, including the localization of the hydroxyl groups (2 or 3 positions) on hydroxy fatty acyl chains, additional measurements with, e.g., UVPD activation are required.
Acknowledgment
The research was supported by the grant ÚNKP-21-4 New National Excellence Program of the Ministry for Innovation and Technology from the source of the National Research, Development and Innovation Fund, NKFIH FK-129038 and NKFIH K-125275. The authors gratefully acknowledge the microbiological assistance of Béla Kocsis (Department of Microbiology and Immunology, Medical School, University of Pécs). The research was performed in collaboration with the Mass Spectrometry Core Facility at the Szentágothai Research Centre of the University of Pécs.
Declaration of Competing Interest
The authors declare that they have no known competing financial interests or personal relationships that could have appeared to influence the work reported in this paper.
References
- Lipid A components from Pseudomonas aeruginosa PAO1 (serotype O5) and mutant strains investigated by electrospray ionization ion-trap mass spectrometry. J. Mass Spectrom.. 2004;39:505-513.
- [CrossRef] [Google Scholar]
- Characterization of isomers of lipid A from Pseudomonas aeruginosa PAO1 by liquid chromatography with tandem mass spectrometry with higher-energy collisional dissociation and ultraviolet photodissociation. Anal. Chem.. 2021;93:4255-4262.
- [CrossRef] [Google Scholar]
- Unusual lipid A from a cold-adapted bacterium: detailed structural characterization. ChemBioChem. 2017;18:1845-1854.
- [CrossRef] [Google Scholar]
- Structure of lipid A from Pseudomonas corrugata by electrospray ionization quadrupole time-of-flight tandem mass spectrometry. Rapid Commun. Mass Spectrom.. 2004;18:853-858.
- [CrossRef] [Google Scholar]
- A systematic nomenclature for carbohydrate fragmentations in FAB-MS/MS spectra of glycoconjugates. Glycoconjugate J.. 1988;5:397-409.
- [CrossRef] [Google Scholar]
- Specific lipopolysaccharide found in cystic fibrosis airway Pseudomonas aeruginosa. Science. 1999;286:1561-1565.
- [CrossRef] [Google Scholar]
- Identification and structural characterization of lipid A from Escherichia coli, Pseudomonas putida and Pseudomonas taiwanensis using liquid chromatography coupled to high-resolution tandem mass spectrometry. Rapid Commun. Mass Spectrom.. 2020;34:e8897.
- [Google Scholar]
- Structural characterization of complex bacterial glycolipids by Fourier transform mass spectrometry. Eur. J. Mass Spectrom.. 2005;11:535-546.
- [CrossRef] [Google Scholar]
- Gram-negative bacterial lipid A analysis by negative electrospray ion trap mass spectrometry: stepwise dissociations of deprotonated species under low energy CID conditions. Int. J. Mass Spectrom.. 2006;249:77-92.
- [CrossRef] [Google Scholar]
- IR and UV photodissociation as analytical tools for characterizing lipid A structures. Anal. Chem.. 2011;83:5107-5113.
- [CrossRef] [Google Scholar]
- Chemistry of lipid A: At the heart of innate immunity. Eur. J. Chem.. 2015;21:500-519.
- [CrossRef] [Google Scholar]
- Pseudomonas aeruginosa lifestyle: a paradigm for adaptation, survival, and persistence. Front. Cell. Infect. Microbiol.. 2017;7:39.
- [CrossRef] [Google Scholar]
- 193 nm ultraviolet photodissociation mass spectrometry for the structural elucidation of lipid A compounds in complex mixtures. Anal. Chem.. 2014;86:2138-2145.
- [CrossRef] [Google Scholar]
- Analyses of lipid A diversity in gram-negative intestinal bacteria using liquid chromatography-quadrupole time-of-flight mass spectrometry. Metabolites. 2021;11:197.
- [CrossRef] [Google Scholar]
- Antibiotic resistance in Pseudomonas aeruginosa: mechanisms and alternative therapeutic strategies. Biotechnol. Adv.. 2019;37:177-192.
- [CrossRef] [Google Scholar]
- Emerging broad-spectrum resistance in Pseudomonas aeruginosa and Acinetobacter baumannii: mechanisms and epidemiology. Int. J. Antimicrob. Agents. 2015;45:568-585.
- [CrossRef] [Google Scholar]
- Application of fast atom bombardment mass spectrometry and nuclear magnetic resonance on the structural analysis of purified lipid A. J. Microbiol. Meth.. 1986;5:65-77.
- [CrossRef] [Google Scholar]
- Characterization of complex, heterogeneous lipid A samples using HPLC-MS/MS technique I. overall analysis with respect to acylation, phosphorylation and isobaric distribution. J. Mass Spectrom.. 2016;51:1043-1063.
- [CrossRef] [Google Scholar]
- Characterization of complex, heterogeneous lipid A samples using HPLC-MS/MS technique III. positive-ion mode tandem mass spectrometry to reveal phosphorylation and acylation patterns of lipid A. J. Mass Spectrom.. 2018;53:146-161.
- [CrossRef] [Google Scholar]
- NACE-ESI-MS/MS method for separation and characterization of phosphorylation and acylation isomers of lipid A. Electrophoresis. 2020;41:1178-1188.
- [CrossRef] [Google Scholar]
- Determination of fatty acid positions in native lipid A by positive and negative electrospray ionization mass spectrometry. J. Mass Spectrom.. 2004;39:378-383.
- [CrossRef] [Google Scholar]
- Acid and base hydrolysis of lipid A from Enterobacter agglomerans as monitored by electrospray ionization mass spectrometry: pertinence to detoxification mechanisms. J. Mass Spectrom.. 1996;31:138-149.
- [CrossRef] [Google Scholar]
- Lipopolysaccharide: Biosynthetic pathway and structure modification. Prog. Lipid Res.. 2010;49:97-107.
- [CrossRef] [Google Scholar]
- Structure characterization of phospholipids and lipid A of Pseudomonas putida KT2442. Eur. J. Mass Spectrom.. 2015;21:739-746.
- [CrossRef] [Google Scholar]
- Über die Extraktion von Bakterien mit Phenol Wasser. Z. fur Naturforsch. - B J. Chem.. 1952;7:148-155.
- [CrossRef] [Google Scholar]
Appendix A
Supplementary material
Proposed structure of compound 3*, the minor co-migrating tetra-acylated isomer at 1184.73 Da. (Fig. S1), lipid A structures identified from the isolate of strain P. aeruginosa PAO1 (Table S1). Supplementary data to this article can be found online at https://doi.org/10.1016/j.arabjc.2023.104944.
Appendix A
Supplementary material
The following are the Supplementary data to this article:Supplementary data 1
Supplementary data 1


