

Translate this page into:
Chromatographic method development and metabolite profiling for biomass and extraction optimization of withametelin and daturaolone from D. Innoxia Mill.
⁎Corresponding author. ihsn99@yahoo.com (Ihsan-ul Haq) ihaq@qau.edu.pk (Ihsan-ul Haq)
-
Received: ,
Accepted: ,
This article was originally published by Elsevier and was migrated to Scientific Scholar after the change of Publisher.
Peer review under responsibility of King Saud University.
Abstract
Low yields of isolated natural compounds halt the drug discovery process as they can only be used for structure elucidation studies and basic biological screening. Metabolite profiling via chromatographic means for optimized selection of biomass and extraction medium can help resolve the issue. In line with this, the project is focused on metabolite profiling of Datura innoxia regarding its two bioactive principals i.e., withametelin and daturaolone. Samples (8 4 0) were prepared via collection of five parts (leaves, stem, fruit, root, flowers) from two geographically different regions of Pakistan i.e., Islamabad and Muzaffargarh for six months (May-October) and extraction in fourteen solvent systems of varied polarity range, respectively. Six months agroclimatology data (temperature, humidity, soil wetness, UV irradiance) was also obtained. TLC co-detection method (n-hexane: ethyl acetate; 7:3) of withametelin and daturaolone was developed and analysis was performed on all samples. RP HPLC method was developed for withametelin (Linearity = R2;0.9) and daturaolone (linearity: R2;0.9) and 118 samples which showed detections in TLC analysis were quantified. Withametelin was mostly detected in leaves with a maximum quantified value of 5.12 ± 0.28 µg/mg dry plant powder when collected in June from arid Muzaffargarh region and extracted with Ethyl acetate + Ethanol (1:1). Distribution of daturaolone is mostly found in fruits with a maximum quantified value of 5.18 ± 0.45 µg/mg dry plant powder when collected in August from mountainous Islamabad region and extracted with Ethyl acetate + Ethanol (1:1). The study states that the presence and quantitative variations of withametelin and daturaolone depend on the plant’s part, extraction medium, geographical location, weather conditions and soil wetness. Use of a controlled environment research to determine the quantitative relationship between different parameters is proposed.
Keywords
Datura
Datura innoxia
Withametelin
Daturaolone
HPLC
Seasonal variation

1 Introduction
Metabolite profiles are the analysis of specific metabolic pathways or compounds associated with the pathways. It is more specific than the metabolite fingerprint and follows specific hypotheses (Wolfender et al., 2009). Therefore, distinctive analytical methods for determining the analytes are utilized. The method is the oldest, most established and a pioneer of metabolomics. Some reports estimate that there are up to 15,000 different compounds in a particular plant species. More than 200,000 natural compounds have been reported so far. By assessing the chemical space of natural products, it is possible to quantify and visualize wide range of natural constituents. The chemical diversity of natural compounds is directly related to the high variability of the physical and chemical properties of the natural product, making it very difficult to distinguish, detect, and identify natural matrices. Therefore, single analytical technique is not sufficient to analyze complex metabolomes in their entirety, and multiple technologies are necessary (Wolfender et al., 2015).
Finding practical ways to strengthen the process and increase yields of selected metabolite is a major challenge for researchers. Compounds are associated with environmental adaptation and play an important biological role. Until now, there have been many studies on the search for the highest yield of desired metabolites and the optimization of cultural conditions. However, few studies directly stressed the adaptability of secondary metabolites to environmental disturbances. Environmental and ecosystem conditions, geographical areas, collection seasons, harvest times, genotypes, and ecological types influence quantitative and qualitative composition. Therefore, plant secondary metabolism is seen as a plant behaviour, which is part of the ability to adapt and survive to environmental stimuli throughout its lifetime. In pharmaceutical plants, environmental conditions can redirect metabolism, thus regulating the production of active compounds (Yang et al., 2018).
In our previous studies, withametelin and daturaolone were isolated from Datura innoxia Mill. which possess drug like features and good pharmacokinetic profiles, respectively (Baig et al., 2020, Baig et al., 2021). Their perceived molecular targets are considered to play an important role in inflammation, pain, brain disease, and cancer. They showed significant cytotoxicity in cancer cell lines and protein kinase inhibition. In addition, analgesics, anti-inflammatory and antidepressant effects from acute in vivo analysis have also been observed. Both natural compounds are proposed for their detailed mechanistic, toxicity profile, and clinical studies. However, low yield is a halt in drug discovery because mostly isolated bioactive compounds are available for detection or for basic screening only and the process to isolate them is not replicative. Consequence is the lack of detailed pharmacological evaluation. Therefore, development of a standardized method not only helps in detection of bioactive compounds but also in selection of an optimized herbal source for large-scale isolation. In line with this, the current project is focused on metabolic profiling of Datura innoxia with reference to its two bioactive principles i.e. withametelin and daturaolone. Discovering chemical compounds from natural sources sounds scientifically interesting, but optimized biomass selection and yield augmentation for thorough pharmacological role determination are the actual challenges to acquire ultimate benefits. To the best of our knowledge, no study has been presented so far which describes the chromatography based detection and quantification study to determine the best plant part, geographical area, solvent system and climatic conditions for optimized biomass selection to obtain withametelin and daturaolone.
2 Methodology
2.1 Selection of sites and collection of samples
The sample location was chosen to signify the growing area of D. innoxia and showed a significant change in the edaphic and climatic factors affecting the growth of respective plant specie. Accordingly, D. innoxia was collected from two geographically different sites in Pakistan namely Islamabad (I) and Muzaffargarh (Mz). The sampling was carried out in two cities within a radius of 500 m over a period of six months (May to October). The selected (uniform) plants in the fruiting and flowering phase were sampled in order to do the collection on the same date of the month (15th). Each sample of the plant was placed in a plastic bag with appropriate labeling. Samples were returned to the laboratory within 24 h of field collection.
2.2 Weather parameter record collection
The detailed agroclimatology reports of 1 year (January 2018 to December 2018) of selected sites were downloaded from the authenticated source in CSV format and 6 month agroclimatology data was utilized in the current project. The data was obtained from the National Aeronautics and Space Administration (NASA) Langley Research Center (LaRC) Prediction of Worldwide Energy Resource (POWER) Project funded through the NASA Earth Science/Applied Science Program (NASA, 2022) (https://power.larc.nasa.gov/).
2.3 Sample preparation
The collected plant was washed under tap water. Leaves (L), stem (S), roots (R), flowers (Fl), and fruits (Fr) were separated, and shade dried for up to 3 weeks. Samples were grounded to a fine powder. Pre-weighed (50 mg) each dried plant part in Eppendorf tubes was macerated (1 mL) in varied polarity solvents systems either alone or in 1:1 combination. Solvent systems and their combination include; n-hexane (nH), chloroform (C), acetone (A), ethyl acetate (Ea), methanol (M), ethanol (E) water (W), nH + C, nH + Ea, C + Ea, C + M, A + Ea, Ea + M and Ea + E. Occasional shaking and ultrasonication aided maceration were done for 3 days. Ultrasonication was performed thrice daily for 5 min each at a frequency of 40 kHz. Each sample was centrifuged, and the supernatant was separated. Solvent system and their combinations are given in Table 1. In brief, 5 plant parts were collected from two geographical locations for six months. Each plant part was macerated in 14 solvent systems respectively. A total of 840 samples were prepared for the TLC analysis.
Appropriate coding of each sample is given in Table 1. Normal phase thin layer chromatography (TLC), Leaves (L), stem (S), fruit (Fr), flower (Fl) root (R) Islamabad (I), Muzaffargarh (Mz), n-hexane (nH), chloroform (C), acetone (A), ethyl acetate (Ea), methanol (M), ethanol (E), water (W), August (Aug), September (Sep) and October (Oct). Standard = withametelin and daturaolone. TLC optimization of standards was finalized. Samples were analyzed on 4 * 6.66 cm TLC plates. 1 µl of each plant sample was spotted on TLC plate and elution was done. Each TLC analysis was performed in triplicate.
D. Innoxia
Leaves
TLC 1 (nH)
TLC 2 (C)
TLC 3 (A)
TLC 4 (Ea)
TLC 5 (M)
TLC 6 (E)
TLC 7 (W)
1
LnHIMay
13
LCIMay
25
LAIMay
37
LEaIMay
49
LMIMay
61
LEIMay
73
LWIMay
2
LnHIJune
14
LCIJune
26
LAIJune
38
LEaIJune
50
LMIJune
62
LEIJune
74
LWIJune
3
LnHIJuly
15
LCIJuly
27
LAIJuly
39
LEaIJuly
51
LMIJuly
63
LEIJuly
75
LWIJuly
4
LnHIAug
16
LCIAug
28
LAIAug
40
LEaIAug
52
LMIAug
64
LEIAug
76
LWIAug
5
LnHISep
17
LCISep
29
LAISep
41
LEaISep
53
LMISep
65
LEISep
77
LWISep
6
LnHIOct
18
LCIOct
30
LAIOct
42
LEaIOct
54
LMIOct
66
LEIOct
78
LWIOct
Standard
Standard
Standard
Standard
Standard
Standard
Standard
7
LnHMzMay
19
LCMzMay
31
LAMzMay
43
LEaMzMay
55
LMMzMay
67
LEMzMay
79
LWMzMay
8
LnHMzJune
20
LCMzJune
32
LAMzJune
44
LEaMzJune
56
LMMzJune
68
LEMzJune
80
LWMzJune
9
LnHMzJuly
21
LCMzJuly
33
LAMzJuly
45
LEaMzJuly
57
LMMzJuly
69
LEMzJuly
81
LWMzJuly
10
LnHMzAug
22
LCMzAug
34
LAMzAug
46
LEaMzAug
58
LMMzAug
70
LEMzAug
82
LWMzAug
11
LnHMzSep
23
LCMzSep
35
LAMzSep
47
LEAMzSep
59
LMMzSep
71
LEMzSep
83
LWMzSep
12
LnHMzOct
24
LCMzOct
36
LAMzOct
48
LEaMzOct
60
LMMzOct
72
LEMzOct
84
LWMzOct
TLC 8 (nH + C)
TLC 9 (nH + Ea)
TLC 10 (C + Ea)
TLC 11 (C + M)
TLC 12 (A + Ea)
TLC 13 (Ea + M)
TLC 14 (Ea + E)
85
LnH + CIMay
97
LnH + EaIMay
109
LC + EaIMay
121
LC + MIMay
133
LA + EaIMay
145
LEa + MIMay
157
LEa + EIMay
86
LnH + CIJune
98
LnH + EaIJune
110
LC + EaIJune
122
LC + MIJune
134
LA + EaIJune
146
LEa + MIJune
158
LEa + EIJune
87
LnH + CIJuly
99
LnH + EaIJuly
111
LC + EaIJuly
123
LC + MIJuly
135
LA + EaIJuly
147
LEa + MIJuly
159
LEa + EIJuly
88
LnH + CIAug
100
LnH + EaIAug
112
LC + EaIAug
124
LC + MIAug
136
LA + EaIAug
148
LEa + MIAug
160
LEa + EIAug
89
LnH + CISep
101
LnH + EaISep
113
LC + EaISep
125
LC + MISep
137
LA + EaISep
149
LEa + MISep
161
LEa + EISep
90
LnH + CIOct
102
LnH + EaIOct
114
LC + EaIOct
126
LC + MIOct
138
LA + EaIOct
150
LEa + MIOct
162
LEa + EIOct
Standard
Standard
Standard
Standard
Standard
Standard
Standard
91
LnH + CMzMay
103
LnH + EaMzMay
115
LC + EaMzMay
127
LC + MMzMay
139
LA + EaMzMay
151
LEa + MMzMay
163
LEa + EMzMay
92
LnH + CMzJune
104
LnH + EaMzJune
116
LC + EaMzJune
128
LC + MMzJune
140
LA + EaMzJune
152
LEa + MMzJune
164
LEa + EMzJune
93
LnH + CMzJuly
105
LnH + EaMzJuly
117
LC + EaMzJuly
129
LC + MMzJuly
141
LA + EaMzJuly
153
LEa + MMzJuly
165
LEa + EMzJuly
94
LnH + CMzAug
106
LnH + EaMzAug
118
LC + EaMzAug
130
LC + MMzAug
142
LA + EaMzAug
154
LEa + MMzAug
166
LEa + EMzAug
95
LnH + CMzSep
107
LnH + EaMzSep
119
LC + EaMzSep
131
LC + MMzSep
143
LA + EaMzSep
155
LEa + MMzSep
167
LEa + EMzSep
96
LnH + CMzOct
108
LnH + EaMzOct
120
LC + EaMzOct
132
LC + MMzOct
144
LA + EaMzOct
156
LEa + MMzOct
168
LEa + EMzOct
Stem
TLC 15 (nH)
TLC 16 (C)
TLC 17 (A)
TLC 18 (Ea)
TLC 19 (M)
TLC 20 (E)
TLC 21 (W)
169
SnHIMay
181
SCIMay
193
SAIMay
205
SEaIMay
217
SMIMay
229
SEIMay
241
SWIMay
170
SnHIJune
182
SCIJune
194
SAIJune
206
SEaIJune
218
SMIJune
230
SEIJune
242
SWIJune
171
SnHIJuly
183
SCIJuly
195
SAIJuly
207
SEaIJuly
219
SMIJuly
231
SEIJuly
243
SWIJuly
172
SnHIAug
184
SCIAug
196
SAIAug
208
SEaIAug
220
SMIAug
232
SEIAug
244
SWIAug
173
SnHISep
185
SCISep
197
SAISep
209
SEaISep
221
SMISep
233
SEISep
245
SWISep
174
SnHIOct
186
SCIOct
198
SAIOct
210
SEaIOct
222
SMIOct
234
SEIOct
246
SWIOct
Standard
Standard
Standard
Standard
Standard
Standard
Standard
175
SnHMzMay
187
SCMzMay
199
SAMzMay
211
SEaMzMay
223
SMMzMay
235
SEMzMay
247
SWMzMay
176
SnHMzJune
188
SCMzJune
200
SAMzJune
212
SEaMzJune
224
SMzIJune
236
SEMzJune
248
SWMzJune
177
SnHMzJuly
189
SCMzJuly
201
SAMzJuly
213
SEaMzJuly
225
SMzIJuly
237
SEMzJuly
249
SWMzJuly
178
SnHMzAug
190
SCMzAug
202
SAMzAug
214
SEaMzAug
226
SMzIAug
238
SEMzAug
250
SWMzAug
179
SnHMzSep
191
SCMzSep
203
SAMzSep
215
SEAMzSep
227
SMzISep
239
SEMzSep
251
SWMzSep
180
SnHMzOct
192
SCMzOct
204
SAMzOct
216
SEaMzOct
228
SMzIOct
240
SEMzOct
252
SWMzOct
TLC 22 (nH + C)
TLC 23 (nH + Ea)
TLC 24 (C + Ea)
TLC 25 (C + M)
TLC 26 (A + Ea)
TLC 27 (Ea + M)
TLC 28 (Ea + E)
253
SnH + CIMay
265
SnH + EaIMay
277
SC + EaIMay
289
SC + MIMay
301
SA + EaIMay
313
SEa + MIMay
325
SEa + EIMay
254
SnH + CIJune
266
SnH + EaIJune
278
SC + EaIJune
290
SC + MIJune
302
SA + EaIJune
314
SEa + MIJune
326
SEa + EIJune
255
SnH + CIJuly
267
SnH + EaIJuly
279
SC + EaIJuly
291
SC + MIJuly
303
SA + EaIJuly
315
SEa + MIJuly
327
SEa + EIJuly
256
SnH + CIAug
268
SnH + EaIAug
280
SC + EaIAug
292
SC + MIAug
304
SA + EaIAug
316
SEa + MIAug
328
SEa + EIAug
257
SnH + CISep
269
SnH + EaISep
281
SC + EaISep
293
SC + MISep
305
SA + EaISep
317
SEa + MISep
329
SEa + EISep
258
SnH + CIOct
270
SnH + EaIOct
282
SC + EaIOct
294
SC + MIOct
306
SA + EaIOct
318
SEa + MIOct
330
SEa + EIOct
Standard
Standard
Standard
Standard
Standard
Standard
Standard
259
SnH + CMzMay
271
SnH + EaMzMay
283
SC + EaMzMay
295
SC + MMzMay
307
SA + EaMzMay
319
SEa + MMzMay
331
SEa + EMzMay
260
SnH + CMzJune
272
SnH + EaMzJune
284
SC + EaMzJune
296
SC + MMzJune
308
SA + EaMzJune
320
SEa + MMzJune
332
SEa + EMzJune
261
SnH + CMzJuly
273
SnH + EaMzJuly
285
SC + EaMzJuly
297
SC + MMzJuly
309
SA + EaMzJuly
321
SEa + MMzJuly
333
SEa + EMzJuly
262
SnH + CMzAug
274
SnH + EaMzAug
286
SC + EaMzAug
298
SC + MMzAug
310
SA + EaMzAug
322
SEa + MMzAug
334
SEa + EMzAug
263
SnH + CMzSep
275
SnH + EaMzSep
287
SC + EaMzSep
299
SC + MMzSep
311
SA + EaMzSep
323
SEa + MMzSep
335
SEa + EMzSep
264
SnH + CMzOct
276
SnH + EaMzOct
288
SC + EaMzOct
300
SC + MMzOct
312
SA + EaMzOct
324
SEa + MMzOct
336
SEa + EMzOct
Fruit
TLC 29 (nH)
TLC 30 (C)
TLC 31 (A)
TLC 32 (Ea)
TLC 33 (M)
TLC 34 (E)
TLC 35 (W)
337
FrnHIMay
349
FrCIMay
361
FrAIMay
373
FrEaIMay
385
FrMIMay
397
FrEIMay
409
FrWIMay
338
FrnHIJune
350
FrCIJune
362
FrAIJune
374
FrEaIJune
386
FrMIJune
398
FrEIJune
410
FrWIJune
339
FrnHIJuly
351
FrCIJuly
363
FrAIJuly
375
FrEaIJuly
387
FrMIJuly
399
FrEIJuly
411
FrWIJuly
340
FrnHIAug
352
FrCIAug
364
FrAIAug
376
FrEaIAug
388
FrMIAug
400
FrEIAug
412
FrWIAug
341
FrnHISep
353
FrCISep
365
FrAISep
377
FrEaISep
389
FrMISep
401
FrEISep
413
FrWISep
342
FrnHIOct
354
FrCIOct
366
FrAIOct
378
FrEaIOct
390
FrMIOct
402
FrEIOct
414
FrWIOct
Standard
Standard
Standard
Standard
Standard
Standard
Standard
343
FrnHMzMay
355
FrCMzMay
367
FrAMzMay
379
FrEaMzMay
391
FrMMzMay
403
FrEMzMay
415
FrWMzMay
344
FrnHMzJune
356
FrCMzJune
368
FrAMzJune
380
FrEaMzJune
392
FrMzIJune
404
FrEMzJune
416
FrWMzJune
345
FrnHMzJuly
357
FrCMzJuly
369
FrAMzJuly
381
FrEaMzJuly
393
FrMzIJuly
405
FrEMzJuly
417
FrWMzJuly
346
FrnHMzAug
358
FrCMzAug
370
FrAMzAug
382
FrEaMzAug
394
FrMzIAug
406
FrEMzAug
418
FrWMzAug
347
FrnHMzSep
359
FrCMzSep
371
FrAMzSep
383
FREAMzSep
395
FrMzISep
407
FrEMzSep
419
FrWMzSep
348
FrnHMzOct
360
FrCMzOct
372
FrAMzOct
384
FrEaMzOct
396
FrMzIOct
408
FrEMzOct
420
FrWMzOct
TLC 36 (nH + C)
TLC 37 (nH + Ea)
TLC 38 (C + Ea)
TLC 39 (C + M)
TLC 40 (A + Ea)
TLC 41 (Ea + M)
TLC 42 (Ea + E)
421
FrnH + CIMay
433
FrnH + EaIMay
445
FrC + EaIMay
457
FrC + MIMay
469
FrA + EaIMay
481
FrEa + MIMay
493
FrEa + EIMay
422
FrnH + CIJune
434
FrnH + EaIJune
446
FrC + EaIJune
458
FrC + MIJune
470
FrA + EaIJune
482
FrEa + MIJune
494
FrEa + EIJune
423
FrnH + CIJuly
435
FrnH + EaIJuly
447
FrC + EaIJuly
459
FrC + MIJuly
471
FrA + EaIJuly
483
FrEa + MIJuly
495
FrEa + EIJuly
424
FrnH + CIAug
436
FrnH + EaIAug
448
FrC + EaIAug
460
FrC + MIAug
472
FrA + EaIAug
484
FrEa + MIAug
496
FrEa + EIAug
425
FrnH + CISep
437
FrnH + EaISep
449
FrC + EaISep
461
FrC + MISep
473
FrA + EaISep
485
FrEa + MISep
497
FrEa + EISep
426
FrnH + CIOct
438
FrnH + EaIOct
450
FrC + EaIOct
462
FrC + MIOct
474
FrA + EaIOct
486
FrEa + MIOct
498
FrEa + EIOct
Standard
Standard
Standard
Standard
Standard
Standard
Standard
427
FrnH + CMzMay
439
FrnH + EaMzMay
451
FrC + EaMzMay
463
FrC + MMzMay
475
FrA + EaMzMay
487
FrEa + MMzMay
499
FrEa + EMzMay
428
FrnH + CMzJune
440
FrnH + EaMzJune
452
FrC + EaMzJune
464
FrC + MMzJune
476
FrA + EaMzJune
488
FrEa + MMzJune
500
FrEa + EMzJune
429
FrnH + CMzJuly
441
FrnH + EaMzJuly
453
FrC + EaMzJuly
465
FrC + MMzJuly
477
FrA + EaMzJuly
489
FrEa + MMzJuly
501
FrEa + EMzJuly
430
FrnH + CMzAug
442
FrnH + EaMzAug
454
FrC + EaMzAug
466
FrC + MMzAug
478
FrA + EaMzAug
490
FrEa + MMzAug
502
FrEa + EMzAug
431
FrnH + CMzSep
443
FrnH + EaMzSep
455
FrC + EaMzSep
467
FrC + MMzSep
479
FrA + EaMzSep
491
FrEa + MMzSep
503
FrEa + EMzSep
432
FrnH + CMzOct
444
FrnH + EaMzOct
456
FrC + EaMzOct
468
FrC + MMzOct
480
FrA + EaMzOct
492
FrEa + MMzOct
504
FrEa + EMzOct
Flower
TLC 43 (nH)
TLC 44 (C)
TLC 45 (A)
TLC 46 (Ea)
TLC 47 (M)
TLC 48 (E)
TLC 49 (W)
505
FlnHIMay
517
FlCIMay
529
FlAIMay
541
FlEaIMay
553
FlMIMay
565
FlEIMay
577
FlWIMay
506
FlnHIJune
518
FlCIJune
530
FlAIJune
542
FlEaIJune
554
FlMIJune
566
FlEIJune
578
FlWIJune
507
FlnHIJuly
519
FlCIJuly
531
FlAIJuly
543
FlEaIJuly
555
FlMIJuly
567
FlEIJuly
579
FlWIJuly
508
FlnHIAug
520
FlCIAug
532
FlAIAug
544
FlEaIAug
556
FlMIAug
568
FlEIAug
580
FlWIAug
509
FlnHISep
521
FlCISep
533
FlAISep
545
FlEaISep
557
FlMISep
569
FlEISep
581
FlWISep
510
FlnHIOct
522
FlCIOct
534
FlAIOct
546
FlEaIOct
558
FlMIOct
570
FlEIOct
582
FlWIOct
Standard
Standard
Standard
Standard
Standard
Standard
Standard
511
FlnHMzMay
523
FlCMzMay
535
FlAMzMay
547
FlEaMzMay
559
FlMMzMay
571
FlEMzMay
583
FlWMzMay
512
FlnHMzJune
524
FlCMzJune
536
FlAMzJune
548
FlEaMzJune
560
FlMzIJune
572
FlEMzJune
584
FlWMzJune
513
FlnHMzJuly
525
FlCMzJuly
537
FlAMzJuly
549
FlEaMzJuly
561
FlMzIJuly
573
FlEMzJuly
585
FlWMzJuly
514
FlnHMzAug
526
FlCMzAug
538
FlAMzAug
550
FlEaMzAug
562
FlMzIAug
574
FlEMzAug
586
FlWMzAug
515
FlnHMzSep
527
FlCMzSep
539
FlAMzSep
551
FREAMzSep
563
FlMzISep
575
FlEMzSep
587
FlWMzSep
516
FlnHMzOct
528
FlCMzOct
540
FlAMzOct
552
FlEaMzOct
564
FlMzIOct
576
FlEMzOct
588
FlWMzOct
TLC 50 (nH + C)
TLC 51 (nH + Ea)
TLC 52 (C + Ea)
TLC 53 (C + M)
TLC 54 (A + Ea)
TLC 55 (Ea + M)
TLC 56 (Ea + E)
589
FlnH + CIMay
601
FlnH + EaIMay
613
FlC + EaIMay
625
FlC + MIMay
637
FlA + EaIMay
649
FlEa + MIMay
661
FlEa + EIMay
590
FlnH + CIJune
602
FlnH + EaIJune
614
FlC + EaIJune
626
FlC + MIJune
638
FlA + EaIJune
650
FlEa + MIJune
662
FlEa + EIJune
591
FlnH + CIJuly
603
FlnH + EaIJuly
615
FlC + EaIJuly
627
FlC + MIJuly
639
FlA + EaIJuly
651
FlEa + MIJuly
663
FlEa + EIJuly
592
FlnH + CIAug
604
FlnH + EaIAug
616
FlC + EaIAug
628
FlC + MIAug
640
FlA + EaIAug
652
FlEa + MIAug
664
FlEa + EIAug
593
FlnH + CISep
605
FlnH + EaISep
617
FlC + EaISep
629
FlC + MISep
641
FlA + EaISep
653
FlEa + MISep
665
FlEa + EISep
594
FlnH + CIOct
606
FlnH + EaIOct
618
FlC + EaIOct
630
FlC + MIOct
642
FlA + EaIOct
654
FlEa + MIOct
666
FlEa + EIOct
Standard
Standard
Standard
Standard
Standard
Standard
Standard
595
FlnH + CMzMay
607
FlnH + EaMzMay
619
FlC + EaMzMay
631
FlC + MMzMay
643
FlA + EaMzMay
655
FlEa + MMzMay
667
FlEa + EMzMay
596
FlnH + CMzJune
608
FlnH + EaMzJune
620
FlC + EaMzJune
632
FlC + MMzJune
644
FlA + EaMzJune
656
FlEa + MMzJune
668
FlEa + EMzJune
597
FlnH + CMzJuly
609
FlnH + EaMzJuly
621
FlC + EaMzJuly
633
FlC + MMzJuly
645
FlA + EaMzJuly
657
FlEa + MMzJuly
669
FlEa + EMzJuly
598
FlnH + CMzAug
610
FlnH + EaMzAug
622
FlC + EaMzAug
634
FlC + MMzAug
646
FlA + EaMzAug
658
FlEa + MMzAug
670
FlEa + EMzAug
599
FlnH + CMzSep
611
FlnH + EaMzSep
623
FlC + EaMzSep
635
FlC + MMzSep
647
FlA + EaMzSep
659
FlEa + MMzSep
671
FlEa + EMzSep
600
FlnH + CMzOct
612
FlnH + EaMzOct
624
FlC + EaMzOct
636
FlC + MMzOct
648
FlA + EaMzOct
660
FlEa + MMzOct
672
FlEa + EMzOct
Root
TLC 57 (nH)
TLC 58 (C)
TLC 59 (A)
TLC60 (Ea)
TLC 61 (M)
TLC 62 (E)
TLC 63 (W)
673
RnHIMay
685
RCIMay
697
RAIMay
709
REaIMay
721
RMIMay
733
REIMay
745
RWIMay
674
RnHIJune
686
RCIJune
698
RAIJune
710
REaIJune
722
RMIJune
734
REIJune
746
RWIJune
675
RnHIJuly
687
RCIJuly
699
RAIJuly
711
REaIJuly
723
RMIJuly
735
REIJuly
747
RWIJuly
676
RnHIAug
688
RCIAug
700
RAIAug
712
REaIAug
724
RMIAug
736
REIAug
748
RWIAug
677
RnHISep
689
RCISep
701
RAISep
713
REaISep
725
RMISep
737
REISep
749
RWISep
678
RnHIOct
690
RCIOct
702
RAIOct
714
REaIOct
726
RMIOct
738
REIOct
750
RWIOct
Standard
Standard
Standard
Standard
Standard
Standard
Standard
679
RnHMzMay
691
RCMzMay
703
RAMzMay
715
REaMzMay
727
RMMzMay
739
REMzMay
751
RWMzMay
680
RnHMzJune
692
RCMzJune
704
RAMzJune
716
REaMzJune
728
RMzIJune
740
REMzJune
752
RWMzJune
681
RnHMzJuly
693
RCMzJuly
705
RAMzJuly
717
REaMzJuly
729
RMzIJuly
741
REMzJuly
753
RWMzJuly
682
RnHMzAug
694
RCMzAug
706
RAMzAug
718
REaMzAug
730
RMzIAug
742
REMzAug
754
RWMzAug
683
RnHMzSep
695
RCMzSep
707
RAMzSep
719
FREAMzSep
731
RMzISep
743
REMzSep
755
RWMzSep
684
RnHMzOct
696
RCMzOct
708
RAMzOct
720
REaMzOct
732
RMzIOct
744
REMzOct
756
RWMzOct
TLC 64 (nH + C)
TLC 65 (nH + Ea)
TLC 66 (C + Ea)
TLC 67 (C + M)
TLC 68 (A + Ea)
TLC 69 (Ea + M)
TLC 70 (Ea + E)
757
RnH + CIMay
769
RnH + EaIMay
781
RC + EaIMay
793
RC + MIMay
805
RA + EaIMay
817
REa + MIMay
829
REa + EIMay
758
RnH + CIJune
770
RnH + EaIJune
782
RC + EaIJune
794
RC + MIJune
806
RA + EaIJune
818
REa + MIJune
830
REa + EIJune
759
RnH + CIJuly
771
RnH + EaIJuly
783
RC + EaIJuly
795
RC + MIJuly
807
RA + EaIJuly
819
REa + MIJuly
831
REa + EIJuly
760
RnH + CIAug
772
RnH + EaIAug
784
RC + EaIAug
796
RC + MIAug
808
RA + EaIAug
820
REa + MIAug
832
REa + EIAug
761
RnH + CISep
773
RnH + EaISep
785
RC + EaISep
797
RC + MISep
809
RA + EaISep
821
REa + MISep
833
REa + EISep
762
RnH + CIOct
774
RnH + EaIOct
786
RC + EaIOct
798
RC + MIOct
810
RA + EaIOct
822
REa + MIOct
834
REa + EIOct
Standard
Standard
Standard
Standard
Standard
Standard
Standard
763
RnH + CMzMay
775
RnH + EaMzMay
787
RC + EaMzMay
799
RC + MMzMay
811
RA + EaMzMay
823
REa + MMzMay
835
REa + EMzMay
764
RnH + CMzJune
776
RnH + EaMzJune
788
RC + EaMzJune
800
RC + MMzJune
812
RA + EaMzJune
824
REa + MMzJune
836
REa + EMzJune
765
RnH + CMzJuly
777
RnH + EaMzJuly
789
RC + EaMzJuly
801
RC + MMzJuly
813
RA + EaMzJuly
825
REa + MMzJuly
837
REa + EMzJuly
766
RnH + CMzAug
778
RnH + EaMzAug
790
RC + EaMzAug
802
RC + MMzAug
814
RA + EaMzAug
826
REa + MMzAug
838
REa + EMzAug
767
RnH + CMzSep
779
RnH + EaMzSep
791
RC + EaMzSep
803
RC + MMzSep
815
RA + EaMzSep
827
REa + MMzSep
839
REa + EMzSep
768
RnH + CMzOct
780
RnH + EaMzOct
792
RC + EaMzOct
804
RC + MMzOct
816
RA + EaMzOct
828
REa + MMzOct
840
REa + EMzOct
Daturaolone and withametelin were isolated and purified in our previous work. Daturaolone (1 mg/ml) solution was prepared in chloroform. Withametelin (1 mg/ml) solution was prepared in ethyl acetate. 500 µl of the corresponding solution were mixed for co-detection and analysis on TLC plates. The final concentration of respective compounds was 0.5 µg/µl.
2.4 TLC detection method optimization and sample analysis
Normal phase TLC plates were used. Firstly, TLC method was optimized for the co-detection of withametelin and daturaolone. 1 µl of the standard solution was run in different mobile phases to select the best mobile phase for separation, elution and simultaneous detection of withametelin and daturaolone. Phosphomolybdic acid reagent was used for the final detection and analysis. After finalizing the TLC optimization of standards, samples were analyzed on 4 * 6.66 cm TLC plates. 1 µl of each plant sample was spotted on TLC plate and elution was done. TLC plate number, sample serial number, coding and sequence in which each sample was spotted on TLC plate along with the standard solution are given in Table 1. Each TLC analysis was performed in triplicate. Plant samples that gave detection of withametelin and daturaolone were selected for HPLC detection and quantification.
2.5 RP HPLC method development
2.5.1 Instrumentation and analytical conditions
The analysis of the study was carried out on the HPLC Agilent 1200 series system. The tests were conducted on the C8 column with a dimension of 4.6x250 mm, a size of 5 µm of silica, and a mixture of mobile phase composition. A gradient mobile phase system was used with mobile phase A (Methanol: Water 1:1) and mobile phase B (100% methanol). The flow rate was adjusted to be 1 mL/min throughout the experiment. The injection volume was 50 µl. Gradient percent mobile phase B at different time intervals include: 0% at 0 min, 100 % at 10 min to 18 min and 0% at 19 to 25 min. The selected wavelengths for quantitative analysis were 230 nm for withametelin and 210 nm for daturaolone. Stop time was 25 min.
2.5.2 Preparation of solutions
The stock solutions of withametelin and daturaolone were prepared by dissolving them in methanol. Solutions were protected from light and were stored at 4 °C. Calibration curve was generated by analysis at final concentrations of 0.31–10 µg/ml.
2.5.3 Linearity
Linearity was determined by three injections of withametilin and daturaolone at two-fold serial concentrations (0.31–10 µg/ml). The peak area was plotted against concentrations. Then, linearity was evaluated using calibration equations to calculate correlation coefficients, slope coefficients, and intercept. Correlation coefficient (R) greater than 0.98, was considered acceptable (Table 2) (Guideline, 2005, Landim et al., 2013).
Compound
Linearity (µg/ml)
Retention Time (Min)
Correlation coefficent
LOD (µg)
LOQ (µg)
Withametelin
10–0.31
12.0
0.99
0.1
0.5
Daturaolone
10–0.31
14.2
0.99
0.2
0.7
2.5.4 Sensitivity
The detection (LOD) and quantification LOQ) limits were determined by the calibration curves of the withametelin and daturaolone standards. According to the ICH guidelines, LOD is calculated according to the expression DPx3.3/ IC, where DP is the standard deviation of the response and IC is the slope of the calibration curve. LOQ was created with the help of the expression DP x10/IC (Table 2) (Guideline, 2005, Landim et al., 2013, Seo et al., 2016).
2.5.5 Accuracy
The accuracy was evaluated through recovery assays carried out by adding known amounts of standards withametelin (0.5, 1 and 1.5 µg/mL) and daturaolone (0.7, 1.4 and 2.1 µg/mL) to the sample. Each solution was injected three times (Guideline, 2005, Landim et al., 2013, Seo et al., 2016).
2.5.6 Precision
To evaluate the intra-day precision of this method, the sample is injected three times a day. The inter-day precision was determined by the samples examined on different days, as well as by another analyst (Guideline, 2005, Landim et al., 2013, Seo et al., 2016).
2.5.7 Robustness
Three sample solutions of withametelin and daturaolone had been prepared and analyzed under established conditions but changing the wavelength parameter from 210 nm to 212 nm for daturaolone and 230 to 232 nm for withametelin and by varying the pH (0.2%) of the mobile phase (Guideline, 2005, Seo et al., 2016). Robustness was also checked by changing the column supplier (Landim et al., 2013).
2.5.8 RPHPLC sample preparation and quantification analysis
Samples that gave detection of withametelin and daturaolone in TLC analysis were used (Table 5). Previously separated supernatants were dried and resuspended in methanol to be used for the HPLC analysis. All the results were expressed as means ± standard deviation (SD) of three replicates.
2.6 Statistical analysis
Microsoft EXCEL 365 was used for statistical analysis. Graph Pad PRISM 5 was used for correlation analysis.
3 Results and discussion
3.1 Area and time-dependent agroclimatology data variations were observed
A six-month period agroclimatic research has been carried out. The agroclimatic parameters differ between the two sites of Islamabad and Muzaffargarh (Fig. 1). The average surface temperature of the earth, and the average air temperature (dry bulbs) at 2 m in the six months were highest in Muzaffargarh in June while lowest in Islamabad in October. Withametelin content in D. innoxia was found to be correlated (P < 0.05) with temperature. High temperatures result in heat stress which affect plant secondary metabolites production. Cold stress also has a negative impact on plant growth and development, resulting in significant productivity constraints. It prevents plants from expressing their full genetic potential, directly inhibiting metabolic reactions, indirectly preventing water absorption and cell dehydration (Verma and Shukla, 2015). Our study showed that heat and cold stress had an impact on the variations in withametelin and daturaolone content. Humidity parameters were relatively high in the July, August and September in Islamabad region as compared to Muzaffargarh region. High humidity can exacerbate the harmful effects of high temperature by limiting transpiration. (i.e., moisture loss from leaves). This is essential to reduce leaf surface temperature and promote the absorption and mobility of water and minerals. Furthermore, high humidity increases the harmful effects of air pollution (such as ozone) and promotes infection spreading by increasing the size of the stomatal openings (Yang et al., 2012). Daturaolone content in D. innoxia was found to be correlated (P < 0.01) with humidity where its presence was found to be highest in August in I where the humidity value was also highest. Similarly, surface soil wetness in Multan was below 0.2 and root zone soil wetness was below 0.3 in six month period measurements. In a drought-stricken situation, the water available in the soil falls to critical levels, and atmospheric conditions increase the continuing loss of water. The severity of the water shortage is thought to reduce plant growth, but some studies have shown that water stress can increase secondary metabolites (Yang et al., 2012). Daturaolone content varied with soil wetness and quantified values showed significant (P < 0.01) value. Six month intra-variations in Islamabad were also observed for UVA irradiation. But no correlation was found between extent of UVA radiations and the quantified content of withametelin and daturaolone. The use of a controlled environment research to determine the quantitative relationship between various parameters with more accuracy is proposed.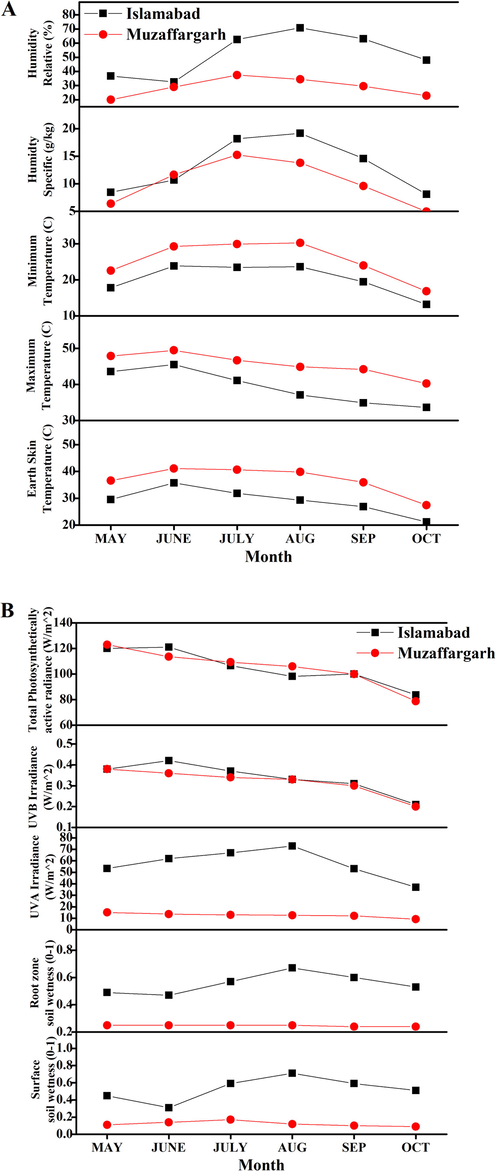
Agroclimatology data (A = temperature and humidity parameters while B = drought stress, UV irradiance) was obtained for the study. The detailed agroclimatology reports of 1 year (January 2018 to December 2018) of selected sites were downloaded in CSV format and 6-month agroclimatology data was utilized in the current project. The data was obtained from the National Aeronautics and Space Administration (NASA) Langley Research Center (LaRC) Prediction of Worldwide Energy Resource (POWER) Project funded through the NASA Earth Science/Applied Science Program.
3.2 TLC method optimization showed Nh:EA (70:30) for co detection of withametelin and daturaolone
The robustness and sustainability of planar chromatography techniques play an important role in the quality assessment of pharmaceutical products in resource-limited countries (Kaale et al., 2011). Advantages of TLC methods that other techniques will never achieve include its simplicity, high throughput and simultaneous analysis of multiple complex samples (Ferenczi-Fodor et al., 2006) So, for the development of appropriate bands to detect withametelin and daturaolone, normal phase TLC technique was utilized. Various combined ratios (v/v) of n-hexane (nH) and ethyl acetate (Ea) were checked. It includes: nH: Ea (1:1), nH: Ea (3:2), nH: Ea (3.5:1.5), nH: Ea (4:1), nH: Ea (8.5:1.5), and nH: Ea (4.5:0.5). The mobile phase combinations i.e. nH: Ea (1:1), nHa: Ea (3:2), nH: Ea (4:1), nH: Ea (8.5:1.5) and nH: Ea (4.5:0.5) revealed unsatisfactory chromatographic separations and detection of the compounds. When mobile phase nH: Ea (70:30) was evaluated, it provided well-resolved and intact chromatographic detections for withametelin and daturaolone. Consequently, the nH:Ea (70:30) was selected for the co-detection of withametelin and daturaolone in all prepared samples for the TLC analysis.
3.2.1 TLC analysis showed the detections in 118/840 samples
TLC analysis of all 840 samples (Table) with standards were run using the mobile phase optimized for the co-detection of withametelin and daturaolone (Fig. 2). Detection of withametelin was mostly observed in leaf samples, especially in TLC 4, 13 and 14 (Fig. 2A) where ethyl acetate, ethyl acetate-methanol (1:1) and ethyl acetate-ethanol (1:1) are the extraction medium. All samples which show detection of withametelin in different samples of leaves are given in Table 3. None of the samples from the root, fruit, flower and stem portion showed the detection of withametelin. Whereas detection of daturaolone was observed in fruit samples, especially in TLC 34 and 42 where ethyl acetate and ethyl acetate-ethanol (1:1) are the extraction medium (Fig. 2B). None of the samples from root, leaves, flower and stem portion showed the detection of daturaolone. The visualizing effect depends on the chemical structure of the detecting reagent, detected substance, and the chromatographic adsorbent used. In particular, the application of visualization reagent reacts with the substances present in the analyzed mixture and gives diversified colors of chromatographic spots (Pyka, 2014).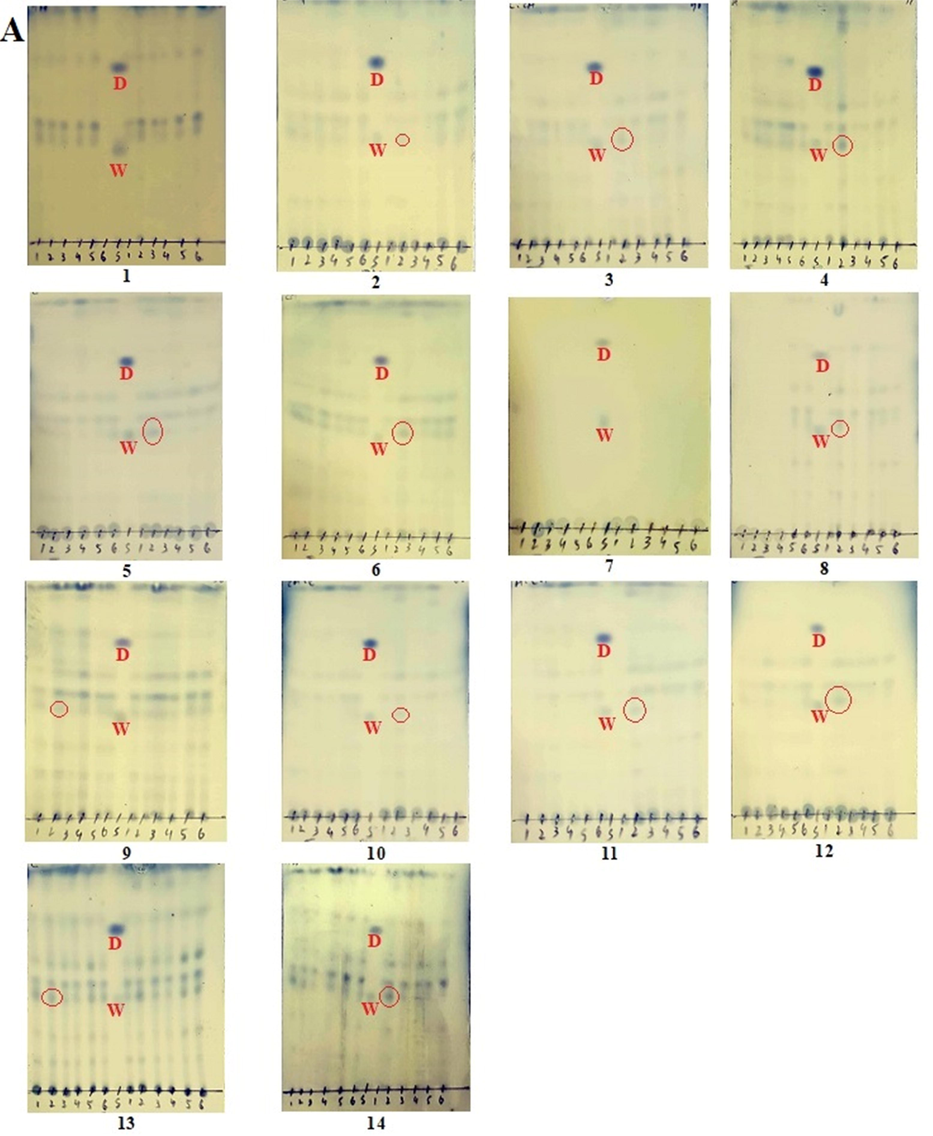
TLC detection (red circled) of withametelin (W) and daturaolone (D) in selected samples of D. innoxia leaves (A) and fruits (B). TLC method was optimized for the co-detection of withametelin and daturaolone. 1 µl of the standard solution was run in different mobile phases to select the best mobile phase for separation, elution and simultaneous detection of withametelin and daturaolone. Phosphomolybdic acid reagent was used for the final detection and analysis.
TLC detection (red circled) of withametelin (W) and daturaolone (D) in selected samples of D. innoxia leaves (A) and fruits (B). TLC method was optimized for the co-detection of withametelin and daturaolone. 1 µl of the standard solution was run in different mobile phases to select the best mobile phase for separation, elution and simultaneous detection of withametelin and daturaolone. Phosphomolybdic acid reagent was used for the final detection and analysis.
Analyte/Initial Concentration
Theoretical concentration after dilution added in the sample (µg/mL)
Amount recovered (µg/mL)
Recovery (%)
Mean (%)
RSD (%)
Withametelin (Concentration measured in the sample (LEa + EMzMay) = 3.96 µg)
0.5
4.48
100.65
100.74
0.33
4.51
101.20
4.47
100.38
1.0
4.94
99.62
100.41
0.72
4.97
100.25
5.02
101.38
1.5
5.45
99.94
100.62
0.65
5.48
100.42
5.54
101.51
Daturaolone (Concentration measured in the sample (FrEa + EIJuly) = 4.55 µg)
0.7
5.21
99.25
99.68
0.83
5.29
100.84
5.19
98.95
1.4
6.02
101.25
100.52
0.51
5.95
100.08
5.96
100.24
2.1
6.64
99.90
100.59
0.60
6.74
101.38
6.68
100.51
3.3 RP HPLC method was developed
High-performance liquid chromatography (HPLC) is a modern, powerful, and flexible separation technology that is usually used to separate, identify and quantify components of herbal mixtures to obtain their chemical profiles (Sarker and Nahar, 2015). The parameters for analysis of withametelin and daturaolone were determined for the first time by adjusting their analytical parameters respectively. It is aimed at identifying the best conditions for the analysis of compounds. Optimization was carried out using gradient elution for each compound. Subsequently, the time and composition of the eluent were adjusted until the optimal conditions were achieved. Moreover, gradient time changes are also used as an optimized parameter. Standard solutions of withametelin and daturaolone were injected. Data is processed using software linked to the HPLC system. Chromatogram met the criteria necessary to identify withametelin and daturaolone. In the absence of a valid method, a new method for analyzing new products is being developed. These methods are optimized and verified by test runs. An alternative method is proposed to replace the existing methodology in comparison laboratory data and implement it in practice, including all available benefits and disadvantages (Patil, 2017).
3.3.1 Optimization of chromatographic conditions
The first test was a single injection of standard withametelin and daturaolone at 500 ppm, injection volume being 50 μl. The various composition of mobile phase systems (methanol–water and methanol (100%)) was studied to obtain good chromatographic properties. Consequently, methanol-water (1:1) to 100% methanol was selected as a gradient system with the best elution behaviour. The limitation of the gradient elution system is the formation of ghost peaks, as shown by the standard daturaolone chromatogram at 254 nm (Fig. 2B). HPLC’s “ghost peak” can be caused by dilution of samples, contamination of reagents and inorganic impurities such as nitrates, organic substances in dissolved plastic containers and synthetic impurities such as methanol and acetonitrile. Even surfaces of glass containing detergent residues may cause an issue (SULASTRI et al., 2020). However, they did not affect the elution and quantification analysis.
3.3.2 Optimization of sample preparation conditions
Ultra sound assisted solid-liquid extracts from dry powders were obtained for the preparation of samples. Initially, the sample was dissolved using 1 mL of the first mobile phase. Results showed that this method was not satisfactory in terms of solubility and detection of the two compounds. However, methanol as a solubility agent produced good results. In combination with HPLC and suitable detectors, appropriate sample preparation techniques can provide valuable data for targeted applications. Proper sample preparation for HPLC results in efficient extraction, cleanup, and preconcentration in a single step, thus providing a pathway to tackle complex extract loading on HPLC. Ultrasonic assisted extraction is a state-of-the-art sampling technique that uses ultrasound waves to extract many compounds from a complex matrix. It provides higher extraction output and faster kinetics than other conventional extraction methods (Kanu, 2021).
3.3.3 Linearity, LOD and LOQ
The excellent relationship between the linearity and the standard analysis is shown in Table 2, with “Y” being the peak area ratio and “X” being the concentration of the analysis contained in the extracted sample, respectively. Calibration curves of withametelin and daturaolone were determined for five concentrations in the range of 0.31–10 ppm, respectively. LOD and LOQ values are also shown in Table 2.
3.3.4 Accuracy and precision
The retrieval of compounds was determined using a spiked sample with a known amount of withametelin and daturaolone standards. The recovered amounts were calculated from the found total and the original amount. The results are shown in Table 3, in line with the recommendations of the ICT (Guideline, 2005). The intra and inter-day precision data are shown in Table 4. The results show that the variation coefficient is lower than the recommended value i.e. 5%. There were no significant differences in the results of the intra-day and inter-day tests, indicating that the accuracy of the proposed method was satisfactory. Normal phase thin layer chromatography (TLC), Leaves (L), fruit (Fr), Islamabad (I), Muzaffargarh (Mz), n-hexane (nH), chloroform (C), acetone (A), ethyl acetate (Ea), methanol (M), ethanol (E), water (W), August (Aug), September (Sep) and October (Oct). 118 samples that gave positive detections in TLC analysis were further analyzed for quantification analysis via RP HPLC. RP HPLC results are shown as mean ± standard deviation after triplicate analysis.
Analyte
Concentration
Intra-day precision (n = 3)
Inter-day precision (n = 3)
RSD %
accuracy
RSD%
Accuracy
Withametelin
1.25
0.36
100.56
0.32
100.61
2.5
0.45
99.87
0.49
100.24
5
0.48
100.28
0.52
99.95
Daturaolone
1.25
0.78
99.58
0.80
100.59
2.5
0.52
101.20
0.61
101.92
5
0.59
100.73
0.44
100.26
Withametelin (µg/mg dry powder)
13
LCIMay
1.19 ± 0.21
40
LEaIAug
1.31 ± 0.14
68
LEMzJune
3.85 ± 0.21
128
LC + MMzJune
3.65 ± 0.38
156
LEa + MMzOct
0.61 ± 0.02
14
LCIJune
1.43 ± 0.33
43
LEaMzMay
2.68 ± 0.42
69
LEMzJuly
3.32 ± 0.34
139
LA + EaMzMay
3.29 ± 0.41
157
LEa + EIMay
1.28 ± 0.03
17
LCISep
0.77 ± 0.24
44
LEaMzJune
2.94 ± 0.13
70
LEMzAug
1.19 ± 0.18
140
LA + EaMzJune
3.55 ± 0.42
158
LEa + EIJune
2.15 ± 0.21
18
LCIOct
0.58 ± 0.14
49
LMIMay
2.19 ± 0.13
71
LEMzSep
0.93 ± 0.31
145
LEa + MIMay
0.72 ± 0.02
159
LEa + EIJuly
0.96 ± 0.19
20
LCMzJune
1.47 ± 0.12
50
LMIJune
3.52 ± 0.21
92
LnH + CMzJune
0.94 ± 0.09
146
LEa + MIJune
1.28 ± 0.03
161
LEa + EISep
0.64 ± 0.11
23
LCMzSep
0.63 ± 0.13
54
LMIOct
0.63 ± 0.32
97
LnH + EaIMay
1.19 ± 0.04
147
LEa + MIJuly
0.65 ± 0.02
162
LEa + EIOct
0.68 ± 0.05
24
LCMzOct
0.55 ± 0.09
55
LMMzMay
3.81 ± 0.41
98
LnH + EaIJune
2.06 ± 0.23
149
LEa + MISep
0.41 ± 0.01
163
LEa + EMzMay
3.96 ± 0.32
25
LAIMay
1.35 ± 0.16
56
LMMzJune
4.48 ± 0.25
103
LnH + EaMzMay
1.58 ± 0.41
150
LEa + MIOct
0.39 ± 0.02
164
LEa + EMzJune
5.12 ± 0.28
26
LAIJune
1.82 ± 0.20
61
LEIMay
3.73 ± 0.31
104
LnH + EaMzJune
2.24 ± 0.51
151
LEa + MMzMay
1.34 ± 0.04
165
LEa + EMzJuly
4.66 ± 0.22
27
LAIJuly
1.61 ± 0.33
62
LEIJune
3.81 ± 0.33
107
LnH + EaMzSep
0.92 ± 0.32
152
LEa + MMzJune
3.15 ± 0.02
167
LEa + EMzAug
1.24 ± 0.37
32
LAMzJune
2.19 ± 0.37
63
LEIJuly
2.69 ± 0.23
108
LnH + EaMzOct
0.78 ± 0.33
153
LEa + MMzJuly
1.09 ± 0.03
168
LEa + EMzSep
0.76 ± 0.05
38
LEaIJune
1.93 ± 0.21
67
LEMzMay
2.47 ± 0.12
116
LC + EaMzJune
2.68 ± 0.56
155
LEa + MMzSep
0.74 ± 0.04
Daturaolone (µg/mg dry powder)
349
FrCIMay
2.19 ± 0.39
378
FrEaIOct
1.14 ± 0.24
437
FrnH + EaISep
0.91 ± 0.23
470
FrA + EaIJune
1.34 ± 0.26
488
FrEa + MMzJune
3.67 ± 0.32
350
FrCIJune
3.21 ± 0.21
388
FrMIAug
2.92 ± 0.21
438
FrnH + EaIOct
0.84 ± 0.11
471
FrA + EaIJuly
1.31 ± 0.17
489
FrEa + MMzJuly
3.49 ± 0.47
351
FrCIJuly
1.89 ± 0.24
389
FrMISep
2.63 ± 0.32
446
FrC + EaIJune
0.93 ± 0.16
472
FrA + EaIAug
1.15 ± 0.17
492
FrEa + MMzOct
2.66 ± 0.29
352
FrCIAug
0.93 ± 0.13
390
FrMIOct
2.11 ± 0.15
447
FrC + EaIJuly
0.84 ± 0.14
473
FrA + EaISep
0.85 ± 0.44
495
FrEa + EIJune
4.21 ± 0.43
353
FrCISep
0.88 ± 0.14
398
FrEIJune
4.33 ± 0.24
449
FrC + EaISep
0.97 ± 0.09
474
FrA + EaIOct
0.82 ± 0.07
496
FrEa + EIJuly
4.55 ± 0.40
354
FrCIOct
0.93 ± 0.16
399
FrEIJuly
2.66 ± 0.44
450
FrC + EaIOct
0.93 ± 0.08
476
FrA + EaMzJune
1.22 ± 0.07
497
FrEa + EIAug
5.18 ± 0.45
360
FrCMzOct
0.82 ± 0.21
400
FrEIAug
2.38 ± 0.53
459
FrC + MIJuly
1.65 ± 0.20
477
FrA + EaMzJuly
0.86 ± 0.08
498
FrEa + EISep
4.76 ± 0.42
373
FrEaIMay
2.36 ± 0.33
401
FrEISep
1.62 ± 0.33
460
FrC + MIAug
1.30 ± 0.07
483
FrEa + MIJune
2.87 ± 0.21
500
FrEa + EMzJune
2.44 ± 0.38
374
FrEaIJune
3.44 ± 0.25
402
FrEIOct
1.52 ± 0.12
461
FrC + MISep
0.99 ± 0.09
484
FrEa + MIJuly
2.38 ± 0.28
501
FrEa + EMzJuly
2.31 ± 0.40
375
FrEaIJuly
3.31 ± 0.27
407
FrEMzSep
0.86 ± 0.19
462
FrC + MIOct
0.86 ± 0.11
485
FrEa + MIAug
2.03 ± 0.31
503
FrEa + EMzSep
2.02 ± 0.31
376
FrEaIAug
3.18 ± 0.33
408
FrEMzOct
0.89 ± 0.12
467
FrC + MMzSep
0.94 ± 0.05
486
FrEa + MISep
1.68 ± 0.33
504
FrEa + EMzOct
2.42 ± 0.37
377
FrEaISep
2.64 ± 0.35
436
FrnH + EaIAug
0.92 ± 0.11
468
FrC + MMzOct
0.58 ± 0.10
487
FrEa + MMzMay
3.24 ± 0.31
Analyte
Agroclimatic Parameter
Correlation R2
P value
Withametelin
Temperature
0.8
<0.05
Humidity
–
–
UVA index
–
–
Soil Wetness
–
–
Daturaolone
Temperature
–
–
Humidity
0.7
<0.01
UVA index
–
–
Soil Wetness
0.9
<0.01
3.3.5 Robustness
The robustness of HPLC method had been evaluated to ensure that it was not sensitive to small changes under experimental conditions. In this study, the wavelength, column supplier and pH of the mobile phase were changed. None of these changes led to a significantly different responses in peaks of withametelin and daturaolone.
3.4 Two samples showed maximum quantification of withametelin and daturaolone via RP HPLC
The quantitative method developed here had been successfully applied to quantification analysis of withametelin and daturaolone in dry powders of D. innoxia. Based on the results of the study, the proposed method can be used easily for analysis. The quantitative results of the two compounds are shown in Table 3, Fig. 3(1) and Fig. 3(2). It appears that the distribution of withametelin is mostly found in leaves with a maximum quantified value of 5.12 ± 0.28 µg/mg dry powder when collected in June from the arid Mz region and extracted with Ea + E. During this period, earth temperature is at maximum. On contrary, the lowest humidity, soil wetness and UVA irradiance was noted. Quantity lowers down in months when the temperature falls whereas humidity and soil wetness rise. Withametelin quantity was also less in the mountainous Islamabad (I) region where soil wetness and UVA irradiance were high. Mainly, a positive correlation (P < 0.05) with temperature was observed. Temperature modulation is reported to cause the accumulation of alkaloids and their biological synthesis is promoted by high temperatures. Morphinane, phthalisoquinoline and benzylisoquinoline in Papaver somniferum was limited at low temperatures (Bernáth and Tetenyi, 1981). Similarly, the distribution of daturaolone is mostly found in fruits with a maximum quantified value of 5.18 ± 0.45 µg/mg dry powder when collected in August from the mountainous I region and extracted with Ea + E. Highest humidity and soil wetness were observed, and high UVA irradiance was noted. The quantity of daturaolone also lowers in months with a decline in humidity and soil wetness. Daturaolone quantity was less in the arid (Mz) region where soil wetness and UVA irradiance were low. Mainly, a positive correlation with soil wetness (P < 0.01) and humidity (P < 0.01) was noted. Extraction in green solvents i.e., EA: E (1:1) gave maximum results. Ethyl acetate is an environmentally benign green solvent (Häckl and Kunz, 2018). The updated GSK solvent selection guide also places it as relatively greener than most. But this does not mean that the end decision of solvent greenness is finally and definitively achieved (Byrne et al., 2016). Similarly, bio-solvents, i.e. solvents from renewable sources such as ethanol from sugar-containing feed fermentation, starch feeds and lignocellulosic feeds are used to avoid the use of fossil resources and CO2 emissions from fossil fuels into the environment (Capello et al., 2007).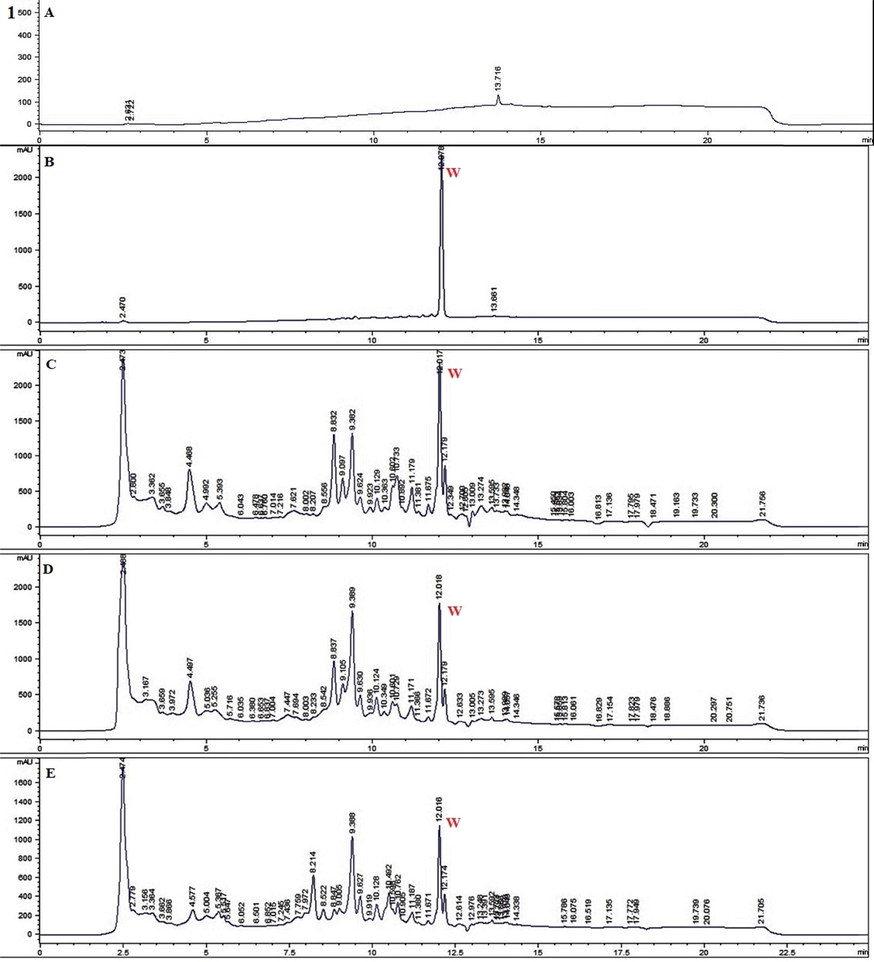
RP HPLC chromatograms of selected samples for detection (Red colour) of withametelin (1) and daturaolone (2). 1 = withametelin (W) blank (A), standard withametelin (B) LEa + EMzJune (C) LEMzJune (D) and LC + EaMzJune (E). 2 = daturaolone (D) blank (A) standard daturaolone (B) FrEa + EIJune (C), FrEa + MIJune (D) and FrA + EaIJune (E) of Datura innoxia.
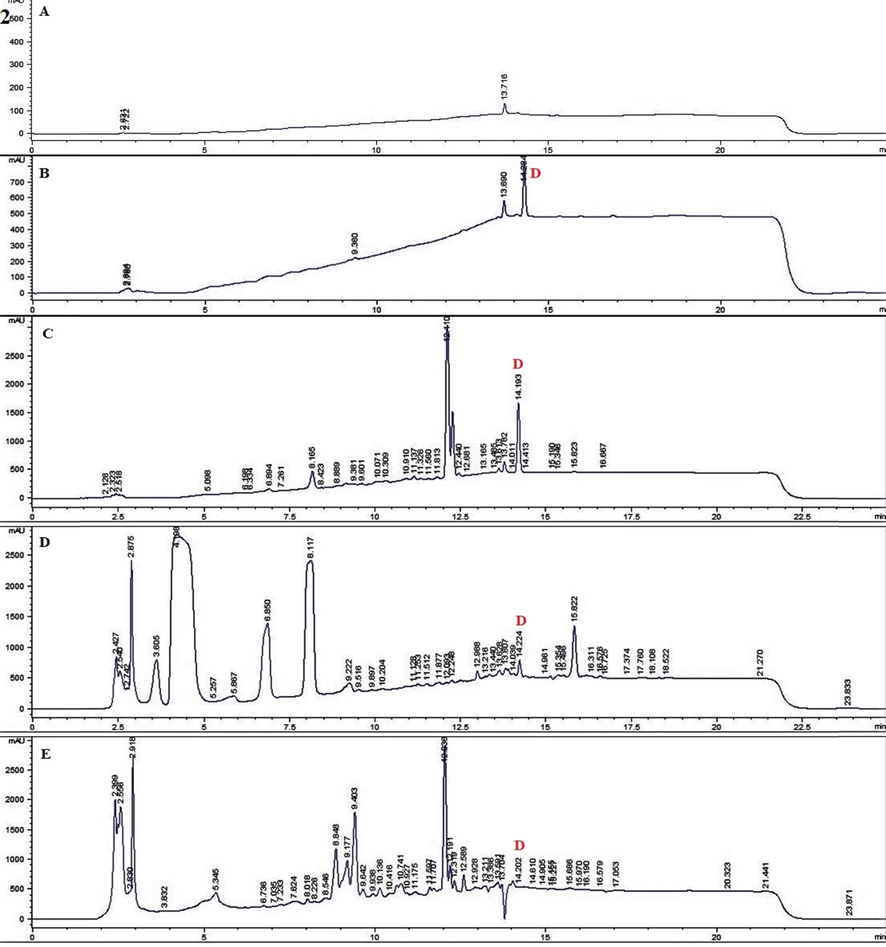
RP HPLC chromatograms of selected samples for detection (Red colour) of withametelin (1) and daturaolone (2). 1 = withametelin (W) blank (A), standard withametelin (B) LEa + EMzJune (C) LEMzJune (D) and LC + EaMzJune (E). 2 = daturaolone (D) blank (A) standard daturaolone (B) FrEa + EIJune (C), FrEa + MIJune (D) and FrA + EaIJune (E) of Datura innoxia.
4 Conclusion
Altogether, chromatographic methods were developed for the detection and quantification of withametelin and daturaolone. The study provides evidence of the selection of the best biomass and extraction medium for the yield enhancement of withametelin and daturaolone from Datura innoxia. Variation in withametelin and daturaolone content was observed depending upon the plant part, geographical area, collection time (month), agroclimatology parameters and extraction medium. Withametelin can be isolated in higher yield when leaves are collected in June from the arid Muzaffargarh region and extracted with ethyl acetate + ethanol. Similarly, fruits collection from mountainous Islamabad in June can give a higher yield of daturaolone when extracted with ethyl acetate + ethanol. However, the direct and interactive contributions of each factor cannot be considered from this data. The use of a controlled environment research to determine the quantitative relationship between various parameters is proposed.
CRediT authorship contribution statement
Muhammad Waleed Baig: Methodology, Software, Validation, Investigation, Writing – original draft, Funding acquisition. Ihsan-ul Haq: Supervision, Resources, Project administration, Writing – review & editing. Syeda Tayyaba Batool Kazmi: Methodology, Funding acquisition. Aroosa Zafar: Methodology, Funding acquisition.
Acknowledgements
HEC Pakistan is acknowledged for the funding through Indigenous PhD fellowship program for Muhammad Waleed Baig to execute the study.
Availability of data
Background data will be provided by corresponding author upon reasonable request.
Declaration of Competing Interest
The authors declare that they have no known competing financial interests or personal relationships that could have appeared to influence the work reported in this paper.
References
- Anti-inflammatory potential of daturaolone from datura innoxia mill.. in silico, in vitro and in vivo studies. Pharmaceuticals. 2021;14:1248.
- [Google Scholar]
- Withametelin: a biologically active withanolide in cancer, inflammation, pain and depression. Saudi Pharma. J.. 2020;28:1526-1537.
- [Google Scholar]
- The effect of environmental factors on growth, development and alkaloid production of Poppy (Papaver somniferum L.): II. interaction of light and temperature. Biochem. Physiol. Pflanzen. 1981;176:599-605.
- [Google Scholar]
- Tools and techniques for solvent selection: green solvent selection guides. Sustain. Chem. Process.. 2016;4:1-24.
- [Google Scholar]
- What is a green solvent? a comprehensive framework for the environmental assessment of solvents. Green Chem.. 2007;9:927-934.
- [Google Scholar]
- Thin-layer chromatography in testing the purity of pharmaceuticals. TrAC, Trends Anal. Chem.. 2006;25:778-789.
- [Google Scholar]
- GUIDELINE, I. H. T. 2005. Validation of analytical procedures: text and methodology. Q2 (R1), 1, 05
- TLC for pharmaceutical analysis in resource limited countries. J. Chromatogr. A. 2011;1218:2732-2736.
- [Google Scholar]
- KANU, A. B. 2021. Recent developments in sample preparation techniques combined with high-performance liquid chromatography: A critical review. Journal of Chromatography A, 1654, 462444
- Development and validation of a HPLC method for the quantification of three flavonoids in a crude extract of Dimorphandra gardneriana. Revista Brasileira de Farmacognosia. 2013;23:58-64.
- [Google Scholar]
- NASA 2022 (Accessed on 5 January, 2022).
- PATIL, M. P. N. 2017. HPLC Method Development–A Review. Journal of Pharmaceutical Research and Education, 1, 243-260
- PYKA, A. 2014. Detection progress of selected drugs in TLC. BioMed research international, 2014.
- Applications of high performance liquid chromatography in the analysis of herbal products. Evidence-Based Validation of Herbal Medicine: Elsevier; 2015.
- HPLC analysis, optimization of extraction conditions and biological evaluation of Corylopsis coreana Uyeki Flos. Molecules. 2016;21:94.
- [Google Scholar]
- Development and validation of a RP-HPLC method for a simultaneous analysis of quercetin and ascorbic acid in psidium guajava fruit extract at different ripening stages. J. Eng. Sci. Technol.. 2020;15:3615-3624.
- [Google Scholar]
- Impact of various factors responsible for fluctuation in plant secondary metabolites. J. Appl. Res. Med. Aromat. Plants. 2015;2:105-113.
- [Google Scholar]
- WOLFENDER, J.-L., GLAUSER, G., BOCCARD, J. & RUDAZ, S. 2009. MS-based plant metabolomic approaches for biomarker discovery. Natural Product Communications, 4, 1934578X0900401019.
- Current approaches and challenges for the metabolite profiling of complex natural extracts. J. Chromatogr. A. 2015;1382:136-164.
- [Google Scholar]
- Response of plant secondary metabolites to environmental factors. Molecules. 2018;23:762.
- [Google Scholar]
- Comparative proteomic analysis of the thermotolerant plant Portulaca oleracea acclimation to combined high temperature and humidity stress. J. Proteome Res.. 2012;11:3605-3623.
- [Google Scholar]


