

Translate this page into:
Chromophore doped DNA based solid polymer electrolyte for electrochromic devices
⁎Corresponding author. Tel.: +40 0213930; fax: +40 213154193. m_mindroiu@chim.upb.ro (Mihaela Vasilica Mîndroiu)
-
Received: ,
Accepted: ,
This article was originally published by Elsevier and was migrated to Scientific Scholar after the change of Publisher.
Peer review under responsibility of King Saud University.
Abstract
The paper presents the main results of our study on preparation and characterization of conducting biomembranes to be used as solid polymer electrolytes (SPEs). It bases on deoxyribonucleic acid (DNA), glycerol (GLY) and photosensitive chromophores, like Prussian Blue (PB). Its primary application is in fabrication of electrochromic windows. The new SPEs were characterized by UV-VIS and FTIR spectroscopy. They were used in preparation of small electrochromic devices (ECDs). The obtained devices were evaluated by cyclic voltammetry and also by spectroscopic methods. The results show their color change from blue pale to intense blue after application of a direct current (DC) electric field, making the composites very interesting for industrial applications in smart windows.
Keywords
Deoxyribonucleic acid
Solid polymer electrolytes
Electrochromic smart windows
Prussian Blue
Ionic conductivity

1 Introduction
Nowadays, the electrochromic cells find increasing interest because of their important potential for practical applications. It concerns, particularly, display (Oh et al., 2011), photovoltaic cells for solar energy conversion (O’Reagan and Grätzl, 1991) and electrochromic smart windows (ECWs) (Macedo et al., 1992). Although all these applications are important the ECWs technology attracts a particular attention because of its high potential for practical applications: for example, in security (conductor blindness by reflected light from rear car mirrors, aircrafts pilot protection against dazzling by the sun light, electrically controllable light attenuators, optical power limiting), and more particularly for energy conservation in buildings and a better inhouse comfort. In the last applications the transmitted light intensity is controlled by the applied electric field (Lee and DiBartolomeo, 2002; Granqvist, 2014).
The principle of ECWs operation bases on switching their states between colored and bleached ones by varying the applied electric field (Granqvist, 1995). The widely accepted explanation of the absorption change, or in other words, coloration in electrochromic thin films bases on the change of metal ions oxidation by the applied electric field, and as consequence, a modification of their absorption band. It is connected with the charge balance: electrochromic window is colored when electrons and ions meet in cathodic electrochromic layer, and is bleached when electrons and ions come together in anodic electrochromic layer (Pehliva, 2013). The ECD has a color memory, high contrast ratio, long lifetime, and an ability to adjust the transmittance through varying the applied electric field.
The ECD consists, generally of multilayers sandwiched between two electrons charge collectors coated glass substrates composed as following: an active electrochromic material; a counter-electrode; and separated by a liquid or solid polymer electrolyte (SPE) (Şenel et al., 2007). Good electrolytes for electrochromic devices (ECDs) are those in which the ions exhibit a high mobility and an ability to be intercalated or extracted from the electrochromic layer when a potential is applied.
Usually one uses the electrolyte layer in liquid-state electrolyte (LSE) (Monk et al., 2007) with high ionic conductivity. However, despite their good ionic conductivity, LSEs are not suitable for practical applications due to their tendency to leak (Gray, 1991) and difficulties related to a non-homogeneous response during the coloration process (Reiche et al., 1995). Polymer electrolytes present a particular interest, compared to other types of electrolytes used for electrochromic applications because of their long open circuit memory and uniform color changes they provide (Granqvist, 2012). Therefore they are frequently used as SPEs for ion-conducting layer.
In recent years, due to the environmental protection concerns (Florjanczyk et al., 2009), a new approach in the synthesis of polymer electrolytes was imposed through the use of biomaterials originating from renewable sources (Nogi and Yano, 2008). Thus, new SPEs for electrochromic devices were prepared from different polysaccharides (Pawlicka et al., 2008; Fuentes et al., 2007) and also from proteins as well as from deoxyribonucleic acid (DNA) (Singh et al., 2010; Pawlicka et al., 2010). The last one is one of the oldest naturally occurring polymers (Kwon et al., 2009). It attracted a special attention for applications in optoelectronics because of its particular structure consisting of double stranded helix (Samoc et al., 2006; Steckl, 2007). The important characteristics that make DNA both attractive and successful for a wide variety of applications are abundance, low extraction cost and biodegradability. Due to its ability to induce orientation of chromophores, the interaction between DNA and other molecules plays important roles in life science. Manipulating DNA molecules by physical and chemical means can lead to a variety of structures.
These materials present a unique and important practical applications property which is solid-state electrolytes. However, the ionic conductivity of SPEs made from biomaterials is relatively low. To improve it, different approaches, such as plasticization, grafting and crosslinking were utilized (Cha et al., 2004). In the previous work (Mîndroiu et al., 2014) we have shown that the ionic conductivity of DNA based membranes can be improved by doping them with different amounts of photosensitive chromophores, e.g. Nile Blue (NB). The NB molecules are intercalated between DNA double helix and cause important structural transformation of DNA (Ju et al., 2005), improving the ionic conductivity of membrane electrolytes.
The Prussian Blue (PB) molecule {Fe4[Fe(CN)6)3] nH2O} is another photosensitive chromophore which is also used for a variety of applications (Somani, 2010). It is the first synthetic pigment, discovered in 1704 by Disbatch. Its chemical structure is shown in Fig. 1. Prussian Blue, also called ferric ferrocyanide is a mixed valence compound with zeolite type structure.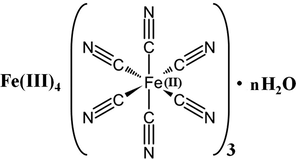
Chemical structure of Prussian Blue.
Due to its particular structure, and to redox, spectroscopic, charge transfer and physico-chemical properties, the large interest PB presents is for electrochromic applications. PB has a blue color in its original state, but under a negative potential can be bleached to a colorless one (reduced state). Under a positive potential PB returns to its original color state (oxidized state).
In this paper we describe the fabrication and characterization of a novel DNA–PB chromophore based solid polymer electrolyte to be used as biomembrane in electrochromic devices. The main purpose is obtaining a processable material with high ionic conductivity, good transmittance and applicable in electrochromic devices. The targeted new materials were obtained in the form of membranes, and were evaluated by various modern characterization techniques.
2 Materials and methods
2.1 Materials
Highly purified deoxyribonucleic acid (DNA), extracted from the waste produced by salmon processing industry was purchased at Ogata Research Laboratory, Ltd., Chitose, Japan. The average molecular weight (Mw) of the DNA used was 2 × 10⁷ g mol−1. The chromophore used, Prussian Blue was purchased from Fluka Analytical (Mw = 306.89 – anhydrous).
For electrochromic smart windows as electrodes WO3/ITO/glass (Solarska et al., 2006) and CeO2–TiO2/ITO/glass were used (Mîndroiu et al., 2014).
2.2 Experimental techniques
The infra red (IR) measurements were performed in the attenuated total reflection mode (ATR) using a Perkin Elmer Spectrum 100 FT-IR spectrophotometer. The studied samples were placed on a Diamond crystal. The investigated spectral range was from 4000 to 600 cm−1. The signal was obtained by averaging 4 scans at resolution of 4 cm−1. As it was sufficiently strong we did not need to make more scans. It is a routinely used procedure in that case.
The UV–VIS spectroscopic analysis was performed in the 200–800 nm spectral range, with a step of 0.5 nm, using a JASCO UV–VIS–NIR spectrophotometer, model V 670.
The surface wettability of the obtained membranes was analyzed using a Contact Angle Meter – KSV Instruments, model CAM 100.
The ionic conductivity measurements of obtained biomembranes were carried out by the electrochemical impedance spectroscopy (EIS), using an Autolab PGSTAT 302N potentiostat with general – purpose electrochemical system software. The measurements frequency range used was between 105 Hz and 10 mHz and the applied voltage amplitude of 10 mV.
The cyclic voltammetry measurements, performed on the ECDs based on the new biomembranes, were done using an Autolab PGSTAT 302 N device, applying tension ranging from −2 V to 2 V with the electric field scan step of 100 mV s−1.
The optical transmittance measurements of ECDs, containing the DNA based membranes with the highest ionic conductivity value, were performed with a Jasco V-670 Spectrophotometer between 380 nm and 800 nm. The ECW performance was measured by the evaluation of optical and electrochemical properties.
One the most important factor in evaluating the electrochromic material is the electrochromic contrast, defined as the percentage of the transmittance change (Δ%T) at the specified wavelength (Eq. (1)), where the electrochromic material has the highest optical contrast. The optical properties are evaluated through the whole transmittance range.
2.3 Preparation of solid polymer electrolytes (SPEs) and of electrochromic devices (ECDs)
The SPEs were prepared at room temperature in the form of thin membranes using a very simple casting technique. First, the glycerol water solution 50 g/L was mixed with Prussian Blue for 12 h. Then a DNA water solution, at the concentration of 10 g/L was added to the mixture of glycerol with chromophore and stirred for another 4 h until a homogenous gel was obtained. The resultant gel was cast in a Teflon box, placed in an oven where it was kept at the temperature of 50 °C over a period of 4 days.
In order to see the influence of Prussian Blue chromophore on the membrane characteristics several of them were prepared.
The gravimetric ratio between DNA and GLY was kept constant at 1:1 ratio, and the PB content was gradually increased from 0.5 (sample A – DNA1GLY1PB0.5) to 1%, 2% and 3% (samples: B – DNA1GLY1PB1, C – DNA1GLY1PB2, D – DNA1GLY1PB3). For a better analysis of the membranes more samples were fabricated in the same conditions: DNA membrane without both GLY and PB (sample E – DNA10g/L), DNA membrane with GLY and without PB (sample F – DNA1GLY1) and DNA membrane with PB and without GLY (sample G – DNA10g/LPB2%). The measured thickness of the membranes was between 80 and 130 μm.
ECDs were assembled in a sandwich like structure. The new SPE membrane was placed between two electrodes: glass/ITO/WO3 (Georg et al., 2008; Granqvist, 2000; Deb, 2008; Thakur et al., 2012; Campet et al., 1992) and CeO2-TiO2/ITO/glass. For a good contact between the layers, the new device was kept overnight in a spring-loaded support and then, for electrical contact, the edges of the device were sealed with copper-conducting tape.
3 Results and discussion
3.1 FT-IR analysis
The identification of functional groups in raw materials and also in all obtained membranes was performed by ATR/FT-IR analysis. The main absorption bands from IR spectra of the raw DNA and GLY are presented in Table 1.
DNA ν (cm−1)
Bands
DNA–GLY ν (cm−1)
Bands
3168
νNH and νOH as
3292
νOH
1682; 1647
νC⚌O (AI) and NH2 scissoring vibrations
2932, 2879
νC—H
1576, 1527
δNH (AII)
1416
δCH
1416, 1478
δCH2
1108
νC—O
1365, 1334
δCH3
1031
νC—O
1230
νC—N (AIII)
922
O—H bending
1060
–
–
1013
C—C
–
–
959
C⚌C trans
–
–
Prussian Blue is particularly attractive for infrared studies since the system contains the strongly absorbing CN functional group (Mîndroiu et al., 2014). PB is a ferric ferrocyanide (FeIII4 [FeII(CN)6]3) with iron(III) atom coordinated to nitrogen and iron (II) atom coordinated to carbon, as it was established by the spectroscopic investigation (Kulesza et al., 1996). In the 4000–600 cm−1 region, the IR spectrum of the raw Prussian Blue (Fig. 2a) (Fe4[Fe(CN)6]3) shows a strong absorption band at 2070 cm−1 attributable to the CN functional group (Karyakin, 2001; Ion et al., 2008). Fe—C—N—Fe bending, characteristic of PB can be seen in far infrared region (450–650 cm−1).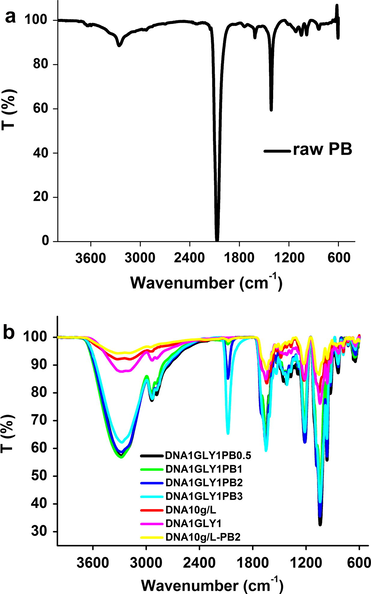
FT-IR spectra of raw Prussian Blue (a) and DNA based SPEs (b) with and without GLY or PB.
The IR spectra of DNA membranes, with and without GLY or PB (Fig. 2b) show the most representative bands as reported in Table 1.
The peak corresponding to stretching vibration of O—H (νO—H) from GLY and DNA and to N—H (νN—H) from DNA appeared in membranes at 3189–3284 cm−1 and is attributed also to intermolecular hydrogen bonds formation.
The presence of Prussian Blue in studied membranes may be checked by the IR bands at 2072 cm−1 in DNA and at 2078–2080 cm−1 DNA–GLY matrices, respectively. This band corresponds to the C—N stretching vibration in ferrocyanide ion Fe (CN)64− (Karyakin, 2001; Guo and Lin, 1997). It is an intense one and can be specifically used to identify PB because it occurs in a region where no other organic or inorganic groups absorb (Kendix et al., 2004).
The bands at 1687 cm−1 and 1642 cm−1 attributed to the stretching vibration of C⚌O (νC⚌O Amide I) and to NH2 scissoring vibrations from DNA membrane are observed in all DNA membranes with or without GLY and PB. But these bands appear at other wavenumbers like 1687–1708 cm−1 and between 1643 cm−1 and 1653 cm−1.
The absorption band corresponding to the deformation vibration of N—H from DNA (δNH Amide II) appears in all DNA membranes with or without GLY and NB at 1530 cm−1, with almost the same intensity.
The presence of DNA in the membranes composition is evidenced also by the band attributed to Amide III and to which appear at 1223 cm−1 in DNA membrane and at 1226 cm−1 in membranes with DNA and PB, and at 1213–1216 cm−1 in membranes with DNA and GLY with and without PB content. Also the symmetric PO2− stretching vibration ( ) observed at 1050 cm−1 in DNA membrane, appears at 1041–1054 cm−1 in membranes with DNA, GLY and PB dopant.
The O—H bending from GLY appears at around 927 cm−1 for all membranes containing GLY.
3.2 UV–VIS spectroscopy
The new SPEs membranes were characterized for their optical absorption in the wavelength range 200–800 nm. The ultraviolet–visible spectra of some SPEs with the same gravimetric ratios between DNA and GLY and different concentrations of PB are presented in Fig. 3.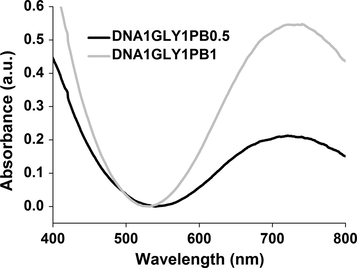
Optical absorption spectra of samples A (DNA1GLY1PB0.5) and B (DNA1GLY1PB1) membranes.
The spectra show an intense absorption band, located around 720 nm, which is due to the charge transfer during the process: Fe2+—CN—Fe3+ transformation of PB (Newman, 1979).
3.3 Ionic conductivity
For device application as ECDs the DNA based solid electrolyte has to exhibit good ionic conductivities. For this purpose the membranes were doped with PB chromophore at different levels. The results of ionic conductivity measurements of these DNA based membranes with as function of PB content, performed at the temperature range of 20–100 °C are displayed in Fig. 4.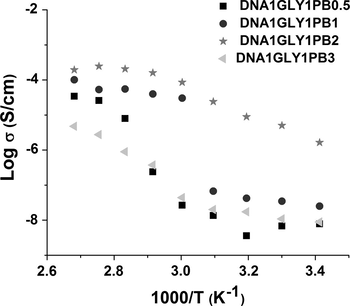
Logarithm of ionic conductivity as function of the inverse of temperature (in K) for the studied DNA based membranes with different Prussian Blue (PB) content.
The previous works (Mindroiu et al., 2014; Pawlicka et al., 2010) show that addition of GLY, used as plasticizer, to the membrane composition, improves their ionic conductivities. In this work we studied the influence of the amount of PB dopant in glycerol plasticized DNA membrane on its ionic conductivity.
All DNA based membranes with PB dopant exhibit ionic conductivities ranging from 10−9 to 10−7 S cm−1 at room temperature. At higher temperature, the ionic conductivity of all membranes increases, reaching a value of about 10−4 S cm−1 for sample C at the temperature close to 80 °C, as compared to the room temperature data. This behavior can be explained by the DNA denaturation process, which produces free guanine and adenine molecules. Also, the number of mobile charge carriers and the delocalization of π electrons in nucleobases increase (Apilux et al., 2007). The highest values of ionic conductivity were obtained for DNA based membrane with 2 w% of PB (DNA1GLY1PB2). In this case, the number of mobile charge carriers is optimal. Adding a higher amount of dopant leads to the chromophore aggregation, which leads to a decrease of ionic conductivity.
3.4 Contact angle measurements
In order to evaluate the influence of the environmental humidity variation on ionic conductivity behavior of SPEs, the wettability was registered.
The surface characterization by static contact angle measurements was recorded at the room temperature with an accuracy of ±1°, using a constant volume of distilled water drop deposited on the biomembrane surface and a number of 5 frames. This method is very sensitive to the surface changes although it does not give information about the type of groups present.
The controlling surface wettability is done in order to evaluate whether the change in chromophor concentrations used in SPE composition may lead to changes in contact angle values. The obtained results from the contact angle measurements are displayed in Table 2.
SPE
Contact angle (degrees)
A – DNA1GLY1PB0.5
125
B – DNA1GLY1PB1
124
C – DNA1GLY1PB2
119
D – DNA1GLY1PB3
117
E – DNA10g/L
136
F – DNA1GLY1
146
G – DNA10g/LPB2
108
It can be seen that the largest contact angle is observed for DNA based SPE without PB (sample F - DNA1GLY1), which means that this material has the most pronounced hydrophobic character. In the case of the DNA – chromophore based SPE and no glycerol (sample G - DNA10g/LPB2%) a pronounced decrease of hydrophobicity is observed. Adding glycerol and various concentrations of chromophore dopant in the SPE composition leads to decrease of the hydrophobic character as follows: lowest value of contact angle was observed for SPE with 3% PB (sample D - DNA1GLY1PB3) and its increase for 0.5 w% PB (sample A - DNA1GLY1PB0.5). The differences in contact angle values are not very large. All studied membranes exhibit a hydrophobic behavior, what means that the dopant content had less influence on the compounds wettability.
3.5 ECD characterization
Taking into account the results obtained from the ion conductivity measurements, we have selected sample C (DNA1GLY1PB2) as solid electrolyte to assemble the electrochromic device. Its composition is the following: DNA 10 g/L with GLY 50 g/L and PB 2%. To obtain ECD the membrane was sandwiched between two ITO/glass electrodes, on which thin layers of WO3 and CeO2–TiO2 (Munro et al., 1998) were previously deposited by the dip-coating method.
The chronoamperometry and the cycle voltammetry methods were used to characterize the assembled ECD. The results were correlated with the optical transmittance measurements.
The UV–VIS spectra of ECD with the structure: glass/ITO/WO3/DNA1GLY1PB2/CeO2-TiO2/ITO/glass are shown in Fig. 5 for 1000 charge insertion/extraction cycles.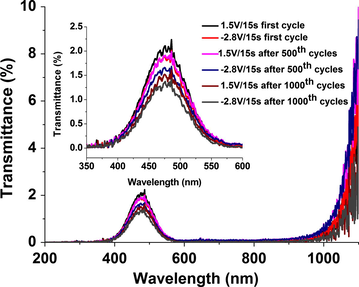
Optical transmittance for ECD with glass/ITO/WO3/DNA1GLY1PB2/CeO2–TiO2/ITO/glass structure after first, 500 and 1000 cycles of insertion and extraction of charges.
All transmittance spectra displayed in Fig. 3 show only bands corresponding to WO3 absorption. In inset to Fig. 5 only the UV–VIS spectra in the 350–600 nm range are presented, in order to evaluate the optical properties of the studied device. It was observed that for negative applied potentials (−2.8 V), transmittance is minimum due to the reduction of the WO3, according to the following reaction WO3 (bleached) + x e− + xM+ ↔ MxWO3 (intense blue color). At the positive potential the value of transmittance increases as a result of WO3 oxidization.
The electrochromic contrast (Δ%T) of the device is low, thus, for first insertion/extraction cycle the value of Δ%T is 0.3. It decreases with the number of cycles to 0.25 after 500 cycles and to 0.2 after 1000 cycles, respectively.
At the same time, the transmittance decreases from 2.1% at 1.5 V/15 s after first to 1.5% at 1.5 V/15 s after 1000 charge insertion/extraction cycles.
Fig. 6a shows that the device charge density response depends on the time at which the potential values are applied. Thus, the inserted charge increases from −2.4 mC/cm2 at 15 s/15 s to −4.3 mC/cm2 at 60 s/60 s. In all studied cases the charge extraction at 1.5 V is faster than insertion at −2.8 V.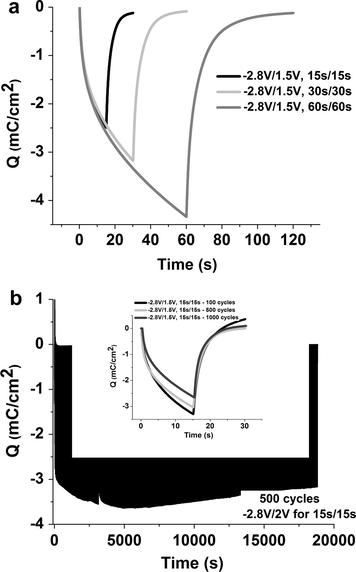
Charge density results (a) for different applied time at potentials −2.8 V and +1.5 V; and (b) as a function of the chronoamperometric cycles of insertion and extraction of charges for ECD with WO3/DNA1GLY1PB2/CeO2–TiO2 configuration (inset shows charge density after 100, 500 and 1000 cycles). The applied potentials were −2.8 V/15 s and 1.5 V/15 s.
In order to evaluate the reversibility of the studied ECD, the samples were subjected to chronoamperometric cycling coupled to a spectral analysis by applying the potentials of −2.8 V and +1.5 V for 15 s/15 s. Fig. 6b shows the results of the charge density modification during 1000 cycles with color change from intense blue color to colorless as indicated in Fig. 5.
The mechanism of electrons and ions insertion/extraction during the cathodic and anodic polarization process of the ECDs based DNA solid electrolyte was explained in some previous works (Neto et al., 2014; Mindroiu et al., 2014; Pawlicka et al., 2011).
Confirming the spectral analysis (Fig. 5), the negative voltage application onto electrochromic device with WO3/DNA1GLY1PB2/CeO2–TiO2 configuration promotes a blue color appearance associated with WO3 reduction by simultaneous electrons and ions insertion. The glass/ITO/WO3 electrode became less colored after applied voltage to +1.5 V because of WO3 oxidation, but at the device level, the color change intensity is barely perceptible, due to the fact that the membrane does not change its color (Fig. 7), remaining blue from PB. Therefore, the color change takes place at the WO3 layer only and not at the electrolyte.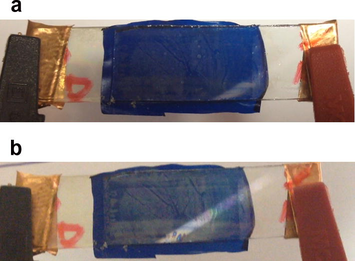
Photograph of ECD with WO3/DNA1GLY1PB2/CeO2–TiO2 configuration at (a) −2.8 V/15 s (cathodic polarization) and (b) at 1.5 V/15 s (anodic polarization).
This affirmation is sustained by the transmittance spectra (Fig. 5), which show only their change at around 475 nm corresponding to WO3, while the transmittance peak corresponding to the electrolyte, at around 633 nm is not present (Assis et al., 2013).
The variation between the intense blue colored to colorless of WO3 remains almost constant with a small increase of charge density during the first 2 h of test (Fig. 6b), from −3 mC cm−2 to −3.6 mC cm−2. After 500 cycles the charge density decreases to −3.1 mC cm−2. It decreases also after 1000th charge insertion/extraction cycles to −2.6 mC cm−2, as it can be seen in the inset to Fig. 6b.
In order to evaluate the reversibility of the studied electrochromic device we have presented (Fig. 8a) their cyclic voltammograms in function of the scan rate.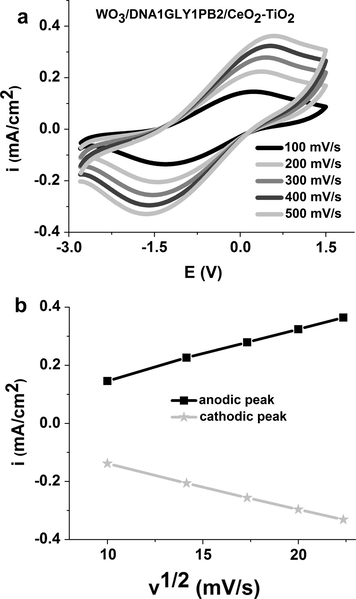
(a) Cyclic voltammograms between −2.8 V and 1.5 V at different scan rates and (b) anodic and cathodic peak current densities against the square root of CV scan rate for ECD with WO3/DNA1GLY1PB2/CeO2–TiO2 configuration.
All voltammograms put in evidence the presence of a cathodic peak with a maximum centered at −1.64 V (for 500 mV/s), which is associated with blue color and is due to the reduction of WO3 layer. The presence of an anodic peak, centered at −0.54 V (for 500 mV/s), indicates the bleaching reaction, which is reversible. These results confirm that the occurence of the device color change is due exclusively to the WO3 electrode. This is caused by the fact that in this studied potential range the cyclic voltammograms do not present another peak which can be attributed to the electrolyte.
The studied ECD system with DNA based membrane is a reversible one because of its dependence on the scan rate (Pawlicka et al., 2011). The oxidation peak current values increase with the scan rate (Fig. 8a) and shift to higher potentials. Plots of the cathodic and anodic peak currents against the square root of the scan rate are displayed in Fig. 8b. They show that the peak current is proportional to the square root of the scan rate, indicating a diffusion control of the mass transfer at the electrode surface (Pawlicka et al., 2011).
4 Conclusions
New optical DNA based SPEs with different amount of PB chromophore were successfully prepared, as it was demonstrated by the FT-IR and UV-VIS analyses.
The contact angle and ionic conductivity measurements have shown that increasing the chromophore concentration in the SPEs composition leads to a less hydrophobic behavior and to a higher ionic conductivity. Moreover, the optimum number of mobile charge carriers was observed for DNA based membrane with 2 w% of PB (sample C - DNA1GLY1PB2).
An electrochromic device was assembled in a sandwich having the following structure glass/ITO/WO3/DNA1GLY1PB2/CeO2-TiO2/ITO/glass and was analyzed. The applicability of the obtained SPE in smart windows was demonstrated by chronoamperometry and cyclic voltammetry measurements. The electrochemical measurements results were sustained by the optical transmittance measurements, confirming that this DNA - PB chromophore based SPE is a promising material for electrochromic devices.
Acknowledgments
This work was funded by the UEFISCDI organism, under Contract Number 279/7.10.2011, Code Project PN-II-ID-PCE-2011-3-05053 and by the FP7 program, Grant Number FP7 PIRSES-GA-2009-247544, project BIOMOLEC.
References
- Electrochemical behaviors of native and thermally denatured fish DNA in the presence of cytosine derivatives and porphyrin by cyclic voltammetry using boron-doped diamond electrode. Bioelectrochemistry. 2007;70:435-439.
- [Google Scholar]
- A green–yellow reflective electrochromic device. Electrochim. Acta. 2013;111:299-304.
- [Google Scholar]
- Electrochromism and electrochromic windows. Active Passive Elec. Comp.. 1992;14:225-231.
- [Google Scholar]
- Ionic conductivity studies of polymeric electrolytes containing lithium salt with plasticizer. Electrochim. Acta. 2004;50:335-338.
- [Google Scholar]
- Opportunities and challenges in science and technology of WO3 for electrochromic and related applications. Sol. Energy Mater. Sol. Cells. 2008;92:245-258.
- [Google Scholar]
- Synthetic and natural polymers in modern polymeric materials. Part I. Polymers from renewable resources and polymer nanocomposites. Polimery. 2009;54:691-705.
- [Google Scholar]
- Lithium ion conductivity of molecularly compatibilized chitosan–poly(aminopropyltriethoxysilane)–poly(ethylene oxide) nanocomposites. Electrochim. Acta. 2007;53:1417-1421.
- [Google Scholar]
- Gray F.M., ed. Solid Polymer Electrolytes, Fundamentals and Technological Applications. New York: Wiley-VCH; 1991.
- Electrochromics for smart windows: oxide-based thin films and devices. Thin Solid Films. 2014;564:1-38.
- [Google Scholar]
- Handbook of Inorganic Electrochromic Materials. Amsterdam, The Netherlands: Elsevier; 1995.
- Oxide electrochromics: an introduction to devices and materials. Sol. Energy Mater. Sol. Cells. 2012;99:1-13.
- [Google Scholar]
- Electrochromic tungsten oxide films: review of progress 1993–1998. Sol. Energy Mater. Sol. Cells. 2000;60:201-262.
- [Google Scholar]
- An electrochemical study of Prussian Blue microcrystallines mixed in PEO400 polymer electrolyte by solid-state voltametry. Chem. Res. Chin. Univ.. 1997;13:304-311.
- [Google Scholar]
- Spectral analysis of original and restaurated ancient paper from romanian gospel. Rom. J. Phys.. 2008;53:781-791.
- [Google Scholar]
- Interaction between Nile Blue and immobilized single- or in electrochemical recognition. Electrochim. Acta. 2005;50:1361-1367.
- [Google Scholar]
- Prussian Blue and its analogues: electrochemistry and analytical applications. Electroanalysis. 2001;13:813-819.
- [Google Scholar]
- The use of micro-Raman spectroscopy in architectural paint analysis. J. Raman Spectrosc.. 2004;35:796-799.
- [Google Scholar]
- In Situ FT-IR/ATR spectroelectrochemistry of Prussian Blue in the solid state Pawel. Anal. Chem.. 1996;68:2442-2446.
- [Google Scholar]
- Application issues for large-area electrochromic windows in commercial buildings. Sol. Energy. Mater. Sol. Cells.. 2002;71:465-491.
- [Google Scholar]
- Electrochromism and Electrochromic Devices. Cambridge, UK: Cambridge University Press; 2007.
- Development of electrochromic cells by the sol–gel process. Sol. Energy Mater. Sol. Cells.. 1998;54:131-137.
- [Google Scholar]
- Ionic liquids for solid-state electrolytes and electrosynthesis. J. Electroanal. Chem.. 2014;714–715:63-69.
- [Google Scholar]
- Some applications of infrared spectroscopy in the examination of painting materials. J.A.I.C.. 1979;19:42-62.
- [Google Scholar]
- Transparent nanocomposites based on cellulose produced by bacteria offer potential innovation in the electronics device industry. Adv. Mater.. 2008;20:1849-1852.
- [Google Scholar]
- Highly efficient full-color display based on blue LED backlight and electrochromic light-valve coupled with front-emitting phosphors. Opt. Exp.. 2011;19(17):16022-16031.
- [Google Scholar]
- A low-cost, high-efficiency solar cell based on dye-sensitized colloidal TiO2 films. Nature. 1991;353(6346):737-740.
- [Google Scholar]
- Polymer Electrolytes: Properties and Applications. Cambridge: Woodhead Publishing Limited; 2010. pp. 95–128
- Influence of plasticizer type on the properties of polymer electrolytes based on chitosan. J. Phys. Chem. A. 2008;112:8888-8895.
- [Google Scholar]
- Ionically conducting DNA-based membranes for eletrochromic devices. Synth. Metals. 2011;161:2329-2334.
- [Google Scholar]
- Pehliva, İ.B., 2013. Digital Comprehensive Summaries of Uppsala Dissertations from the Faculty of Science and Technology, p. 1057.
- Optical properties of Deoxyribonucleic Acid (DNA) polymer host. Proc. SPIE.. 2006;6401 640106-1-10
- [Google Scholar]
- Electrochromic and photoelectrochemical characteristics of nanostructured WO3 films prepared by a sol–gel method. C. R. Chimie. 2006;9:301-306.
- [Google Scholar]
- Prakash R., ed. Prussian Blue (s): Multifunctional Material (s). India: Applied Science Innovations Pvt. Ltd.; 2010.
- Synthesis and proton conductivity of anhydrous dendritic electrolytes. Cent. Eur. J. Chem.. 2007;5:546-556.
- [Google Scholar]
- Hybrid materials and polymer electrolytes for electrochromic device applications. Adv. Mater.. 2012;24:4071-4096.
- [Google Scholar]


