

Translate this page into:
Cinnabaris modified with SiO2 nanoparticles stabilized Pickering emulsion to improve the photostability of volatile oil: A Lingzhu San case study
⁎Corresponding author. 2051078@sntcm.edu.cn (Junbo Zou)
-
Received: ,
Accepted: ,
This article was originally published by Elsevier and was migrated to Scientific Scholar after the change of Publisher.
Peer review under responsibility of King Saud University. Production and hosting by Elsevier.
Abstract
The pharmacological activity of volatile oils (VOs) is significant, but they can generate peroxides under light conditions, reducing the VO content and affecting their stability. This study aims to introduce Pickering emulsion technology to enhance the antioxidant activity of VOs and improve the photostability and efficacy of solid formulations. In this work, Cinnabaris was used as a stabilizer in the formulation of Lingzhu San to prepare Pickering emulsions using high-speed shearing. By controlling the duration of light exposure, the retention rate, degree of oxidation, and changes in volatile components of the volatile oil of Acorus tatarinowii Schott (AT-VO) were compared between the crude oil group and the Pickering emulsion group. Compared with the crude oil group, the Pickering emulsion group significantly improved the retention rate, reduced the degree of oxidation, and mitigated the changes in volatile components. GC–MS analysis of the quantitative and qualitative changes showed that the volatile components of the oil retained by the Pickering emulsion were closer to the untreated AT-VO in the light environment. In addition, the Pickering emulsion with water as the outer phase and oil as the inner phase retarded the formation of peroxides in the VOs and achieved the goal of maintaining the photostability of the VOs.
Keywords
Lingzhu San
Acorus tatarinowii Schott
Volatile Oil
Cinnabaris
Pickering emulsion technology
Photostability study

1 Introduction
Febrile seizures in children are a common emergency condition in pediatric practice, especially prevalent in toddlers. The occurrence of febrile seizures is generally due to high fever and upper respiratory tract infections, with a high risk of recurrence. Repeated episodes without apparent improvement often raise concerns about varying degrees of irreversible brain damage in affected children, leading to potential intellectual disability and damage to the central nervous system (Chen et al., 2021). Lingzhu San, a time-honored proprietary medicine from Lei Yun Shang Pharmaceutical Company, has shown notable effectiveness in treating febrile seizures in children. The formula is composed of saiga tatarica horn, pearl powder, cow bezoar, Arisaema Cum Bile, stiff silkworm, Cinnabaris, amber, borneol, and the volatile oil of Acorus tatarinowii Schott (AT-VO), exhibiting the effect of reducing heat, detoxication, arresting convulsion, and soothing nerves (Zhou et al., 2021). Its long-lasting pharmacological action effectively prevents abnormal discharges of lesions in the central nervous system, hence reducing the phenomenon of recurrent seizures in children (Kuang et al., 2022; Sun et al., 2022). However, the method of direct spraying used for AT-VO in this formula leads to easily damaged active ingredients and poor stability, significantly reducing the effectiveness of the formulation.
Solid preparations containing oil frequently suffer from instability given the oil's volatile properties. Susceptible to issues such as oxidation and evaporation, these formulations are especially vulnerable when exposed to light during usage and storage. Such conditions prompt a reduction in the volatile oil (VO) content within the product's lifespan, thereby degrading the medicinal quality. This degradation brings into question the guaranteed assurance of the formulation's clinical efficacy, as the intended therapeutic benefits could potentially be diminished (Asbahani et al., 2015; Barradas et al., 2021). Light exposure primarily affects the stability of VO through various pathways such as photooxidation or autoxidation. Photochemical reactions play a significant role in studying changes in the content and composition of VO (Zhang et al., 2021). Current strategies to improve the stability of VO mainly involve cyclodextrin encapsulation technology. Though this technology possesses high safety and stable properties, shortcomings such as low encapsulation rate and small drug loading still exist. Moreover, the poor water solubility of cyclodextrin could potentially affect the release process of the VO both in vitro and in vivo. Existing research tends to modify the structure of cyclodextrin to enhance its solubility. However, such modifications could result in new issues like poor biocompatibility and bioaccumulation (Arora et al., 2019; Zhu et al., 2023).
Pickering emulsions, defined as new emulsions where solid particles replace surfactants, have potential applications as next-generation emulsifiers due to their absence of surfactants, which overcomes the environmental and health issues associated with classic emulsifiers (Chevalier et al., 2013; Umair et al., 2019; Zehu et al., 2023). The stabilization process of Pickering emulsions involves an irreversible reaction where solid particles are adsorbed on the surface of emulsion droplets, minimizing the interfacial energy between two immiscible phases. This process does not interfere with the behavior of volatile oil (VO) in vitro and in vivo while boasting high stability and safety (Sharkawy et al., 2020; Zhou et al., 2023; Shuang et al., 2024). Research conducted by scholars has demonstrated that peony seed oil exhibits a higher oxidative stability when incorporated into an emulsion compared to when used alone (Zhang et al., 2021). This finding serves as evidence of the protective effect provided by emulsions. Under the condition of the same oil content, the antioxidant activity of the emulsion is greater than that of pure vanilla oil. After storage for 24 h, the antioxidant activity of the emulsion is enhanced, and the vanilla essential oil is slowly released into the emulsion (Wang et al., 2022). VO of traditional Chinese medicine is a kind of oily liquid extracted from aromatic traditional Chinese medicine, which has various biological activities and is widely used in clinical applications. However, due to the unstable physicochemical properties of VO, affected by many factors such as light, temperature, oxygen, etc., it is easy to undergo oxidation, decomposition, isomerization, photocycle addition, and other reactions, and the active ingredients are transformed, and the changes in its content and composition lead to the decline in the quality of VO and the increase in clinical risk. How to protect the active ingredients of VO through the preparation technology to maintain the stability of the physicochemical properties of volatile oil is a key issue.
Based on our research group's preliminary work, an initial exploration following the “combination of medicine and adjuvant” concept was conducted to assess the suitability of preparing AT-VO solid particle emulsion using the Lingzhu San Prescribed medicines as a stabilizer. Pearl powder from the Lingzhu San prescription was identified as a suitable stabilizer, and the emulsion showed the best stability when the oil accounted for 40 % (Peng et al., 2023). Cinnabaris was found to be a relatively suitable stabilizer but is unstable in forming an emulsion on its own. Therefore, this research primarily focuses on particle design around Cinnabaris particles to develop a suitable stabilizer, considering light exposure as a factor influencing the volatility of the oil, aiming to prepare a stable Pickering emulsion. By modifying mineral medications into suitable stabilizers through particle design technology, we aim to provide a reference for enhancing the stability of VO in other traditional Chinese medicine oil-containing solid preparations.
2 Experimental
2.1 Instruments
HG-3 type magnetic heating stirrer (Changzhou Guohua Electric Co., Ltd.); JY3002 type analytical balance with a precision of one hundred thousandth (Shanghai Puchun Instrument Co., Ltd.); IKA T18 digital high-speed disperser (Shanghai Tushen Vision Technology Co., Ltd.); TENSOR-27 Fourier Transform Infrared Spectrometer (Bruker Corporation, Germany); ANTIRISII Fourier Transform Near-Infrared Spectrometer (Thermo Fisher Scientific Inc., USA); N-300 M biological microscope (Leica Microsystems Trading Co., Ltd.); RE100-Pro Rotary evaporator (DLAB Dalong Instruments); 416 centrifuge (CENESPEED Company); TESCAN VEGA3 tungsten filament scanning electron microscope (TESCAN Trading (Shanghai) Co., Ltd.); Microtrac S3500 laser particle size analyzer; Zetasizer Nano ZS90 laser particle size analyzer (Malvern Instruments, UK); Drug Stability Test Chamber (BINDER, Germany), Agilent 7890B/5977B Gas Chromatography-Mass Spectrometry (GC–MS) system (Agilent Technologies Inc., USA); UV–visible spectrophotometer (Shanghai Youke Instrument & Equipment Co., Ltd.).
2.2 Materials
The AT-VO (Xi'an Deshengyuan Biotechnology Co., Ltd.,); Cinnabaris (Lei Yun Shang Pharmaceutical Group Co., Ltd.,); SiO2 (Shanghai Maiklin Biochemical Technology Co., Ltd., batch number C14567078); methylene blue (Shanghai Yuanye Biotechnology Co., Ltd., batch number: L11D10H105480); Sudan III (Shanghai Yuanye Biotechnology Co., Ltd., batch number: 20190710); n-hexane (Shanghai Yuanye Biotechnology Co., Ltd., batch number 20220923); chloroform CHCl3 (Tianjin Tianli Chemical Reagent Co., Ltd., batch number 20200203); 2-thiobarbituric acid (TBA, Shanghai Kefeng Industrial Co., Ltd., batch number 20220921); trichloroacetic acid (Shanghai Yuanye Biotechnology Co., Ltd., batch number 20220428); 1,1,3,3-tetraethylpropane (Shanghai Yuanye Biotechnology Co., Ltd., batch number O12GS163530); Water was Watson's distilled water; Other chemicals were analytical grade and all from commercial source.
2.3 Preparation of stabilizers
Based on preliminary experiments, the preparation conditions were determined as follows (Jiang et al., 2018): SiO2 and Cinnabaris powder were accurately weighed at a mass ratio of 7:1, anhydrous ethanol was added, and ultrasonication was carried out for 15 min at a temperature of 30 °C. Magnetic stirring was carried out for 24 h so that the SiO2 completely coated the Cinnabaris. The solvent was then evaporated using a rotary evaporator. The residue was dried in a vacuum oven for 24 h and finally dried and sieved to obtain the sample.
2.4 Preparation of Pickering emulsion
The effects of stabilizer dosage (15, 20, 25, 30 mg), oil phase volume fraction (50 %, 55 %, 60 %, 65 %), emulsification time (2, 2.5, 3, 3.5 min), emulsification speed (8,000, 10,000, 12,000, 14,000 rpm), and emulsion temperature (20, 25, 30, 35 °C) on the stability of Pickering emulsions were investigated in the experiments. The optimum process parameters for the stable preparation of the Pickering emulsion using modified Cinnabaris particles as emulsifiers were determined as follows: the weight of the stabilizer modified Cinnabaris 20 mg (Cinnabaris powder 12.5 wt%, SiO2 87. 5 %), the oil phase volume fraction of 60 % (the proportion of 40 % pure water and 60 % of the AT-VO), the use of a high speed dispersing machine to prepare Pickering emulsion, the emulsification speed was set at 10,000 rpm, the emulsification time was 2.5 min and the temperature was 25 °C.
2.5 Investigation on the photostability of AT-VO
2.5.1 Preparation of AT-VO
The AT-VO, the oil–water mixture (with an oil content of 60 %), and the Pickering emulsion were placed separately in 40 x 25 flat-bottomed weighing bottles. These bottles were then exposed to a light intensity of 4500 lx in a testing chamber. Samples were taken after 1, 3, and 5 days. The oil–water mixture and Pickering emulsion groups were centrifuged at 10,000 rpm for 10 min to separate the oil phase, and the volume was recorded. Three parallel experiments were performed for each condition.
2.5.2 Determination of malondialdehyde value (MDA) experiment
2.5.2.1 Standard curve plotting
Weigh exactly 0.315 g of 1,1,3,3-tetraethoxypropane into a 1000 mL volumetric flask. It was diluted with water and made up to the mark to give a 0.1 g/L MDA stock solution. 0, 0.02, 0.04, 0.06, 0.08, and 0.1 mL of this stock solution were taken and transferred to separate 10 mL volumetric flasks. These volumes were diluted to the mark with water to obtain standard solutions with mass concentrations of 0, 0.2, 0.4, 0.6, 0.8, and 1.0 mg/L of MDA. From each standard solution, 5.00 mL was removed and 5.00 mL of thiobarbituric acid (TBA) solution was added. The solutions were mixed well and heated in a water bath at 90 °C for 40 min. After removal from the water bath, the solutions were allowed to cool at 25 °C. Then, 5.00 mL of chloroform was added, and each solution was shaken well and allowed to stand for 1 h. The supernatant was collected and its absorbance was measured at 532 nm (Tai et al., 2019).
2.5.2.2 Sample preparation and determination
For the different samples of the AT-VO, 500 μL of each sample was taken and transferred to a 10.00 mL volumetric flask. The volume was made up to the mark with a mixed solution prepared by dissolving trichloroacetic acid (37.50 g) and sodium ethylenediaminetetraacetate (0.50 g) in water to a final volume of 500 mL. The solution was sonicated for 10 min and then filtered. Transfer 5.00 mL of the filtrate into a conical flask. Add 5.00 mL of TBA solution was added and the mixture was heated in a water bath at 90 °C for 40 min. It was then removed from the water bath and allowed to cool at 25 °C in the dark for 1 h. Then, 5.00 mL of chloroform was added, the mixture was shaken vigorously, and allowed to stand for 1 h. The supernatant was removed and its absorbance was measured at 532 nm.
2.5.3 Determination of peroxide value (POV) experiment
Precisely 500 μL of different samples of the AT-VO were collected. 10.00 mL of a mixture of chloroform and glacial acetic acid (V1/V2 = 4:6) was transferred to a conical flask. 1.00 mL of saturated potassium iodide solution was added, the conical flask was sealed, and it was shaken for 0.5 min. It was left in a dark place for 3 min, then removed and 30.00 mL of water was added. 1.00 mL of 1 % starch indicator was added, and the mixture was titrated with 0.001 mol/L sodium thiosulfate standard solution (prepared by dissolving 26.00 g of sodium thiosulfate and 0.20 g of anhydrous sodium carbonate in 1000 mL of water, gently boiling for 10 min, and then cooling) until the blue color of the solution disappeared. The volume of consumed sodium thiosulfate standard solution was recorded to calculate the POV value (Peng et al., 2022).
2.6 GC–MS analysis of changes in volatile components
2.6.1 Preparation of internal standard solution
A precision measurement of 100 mg of Docosane standard was taken and placed in a 10 mL volumetric flask. Hexane was added up to scale and then shaken until uniform to obtain a Docosane internal standard reserve solution with a mass concentration of 10 mg/mL.
2.6.2 Preparation of the test solution
Separately, 100 uL of samples from different groups of AT-VO were placed in a 10 mL volumetric flask. An appropriate amount of anhydrous sulfuric acid was added to remove water. Precisely 100 uL of the Docosane internal standard reserve fluid was added and filled up to the scale line with hexane, then it was gently shaken until uniform to obtain the test solution. Precisely 2 mL of the sample solution was taken, placed in a liquid-phase flask through a filtration membrane, and used for GC–MS for the measurement.
2.6.3 GC–MS test conditions
The HP-5MS quartz capillary column (30 m, 0.25 um) was utilized, with helium as the carrier gas (with a purity of 99.999 %) moving at a flow rate of 1 mL/min. The injection volume was 1 uL and the split ratio was 10:1. The inlet temperature was set at 230 °C. The heating program was as follows: held at 50 °C for 2 min, increased to 110 °C at 5 °C/min, and held for 2 min. Continued to increase to 120 °C at 2 °C/min and hold for 5 min, then increased to 125 °C at 0.5 °C/min, held for 10 min. Continued to increase to 200 °C at 4 °C/min, held for 2 min, and then increased to 250 °C at 10 °C/min held for 2 min (Tai et al., 2020). The ionization mode was EI, with the electron energy at 70 eV. The quadrupole temperature was 150 °C, the ion source temperature was 230 °C, and the scan range was m/z 35–500. The solvent delay was 3 min.
2.7 Experiment on quantitative changes in AT-VO
The internal standard method was used to calculate the correction factor as well as the relative content of different components in different groups at different light exposure durations. The different components identified using R-language could be divided into two categories: upregulated differential components and downregulated differential components. The physicochemical property parameters of upregulated and downregulated differential components were separately queried, including relative molecular weight, melting point, boiling point, flash point, water solubility, density, polarization rate, surface tension, etc. The normalized values of different physicochemical parameters were calculated, and the average values of each physicochemical parameter for different distribution behaviors were determined (Wei et al., 2019).
2.8 Screening for differential components
After the GC–MS analysis data was collected, the Agilent database analysis software Data Analysis was used to call the NIST 14.0 database for the analysis of volatile oil components. The R language Limma package (Ritchie et al., 2015) was used to combine and summarize the data of 30 groups from 1, 3, and 5 days. The original oil group at different light exposure durations was compared with the AT-VO without light exposure for differential analysis. Using a logFC cutoff ≥ 1 and P < 0.05 as criteria, differentially expressed components at different light exposure durations were selected. A volcano plot was then plotted, with log2(FC) as the x-axis and -log10(p-value) as the y-axis, to visualize the differential components at different light exposure durations. The results were classified as UP for significantly upregulated components, DOWN for significantly downregulated components, and NOT for non-significant components. The weighted differential components were used to plot PCA plots, concentration change plots, and line plots.
2.9 Experiment on qualitative changes in AT-VO
The AT-VO without light treatment was compared and analyzed with the AT-VO treated by different illumination times, to explore the VO quality change components changes in different groups. The omicshare tools (https://www.omicshare.com/tools/) functional analysis was applied. The Upset plot was used to dynamically count and display the common/specific element information between sets. The column name of the table represented the set, the row name represented the element, and the common and specific components between the columns were statistically analyzed. Components newly produced and disappeared under different light exposure times were screened out. The component change characteristics were displayed in two dimensions: heat map + stacked figure combined graph.
2.10 Statistical analysis
The results were expressed as means ± standard deviation (SD) from at least three independent experiments. All data were analyzed using SPSS 25.0 software. One-way analysis of variance (ANOVA) was employed to compare the differences among groups, and t-tests were used to compare data between two groups. P < 0.05 was considered statistically significant. A probability value of P < 0.05 was considered statistically different. All statistical Figures were performed using GraphPad Prism software 5.0. (See Fig. 1).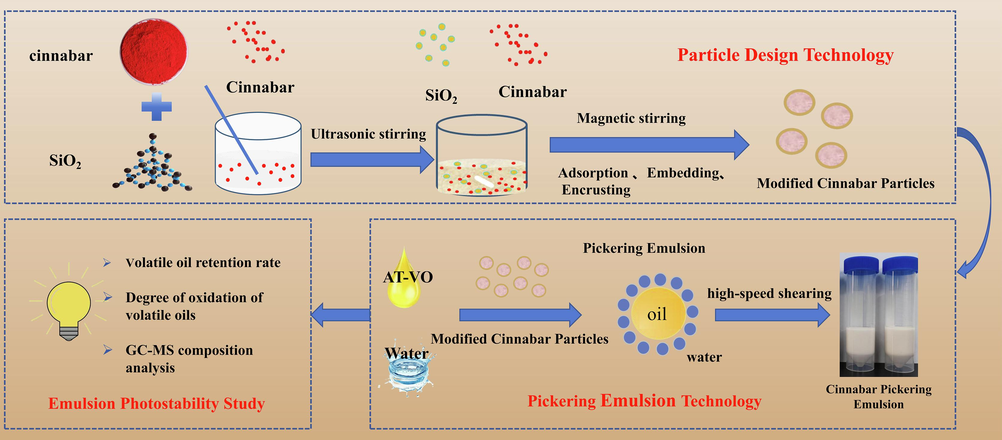
Flow chart of Pickering emulsion technique to improve the Photostability of VO.
3 Results and discussion
3.1 SEM characterization of preparation of stabilizers
A small amount of the tested sample was applied to a conductive adhesive and was observed under a scanning electron microscope after vacuum gold sputter coating to view the surface morphology of the sample. From the image (Fig. 2A-D), it could be seen that the Cinnabaris powder appeared as block-like structures with a smooth surface. The SiO2 appeared as spherical particles with some fine particles coating or protruding on the surface. The physical mixture of the two showed a simple mixture, with a higher adhesion of spherical SiO2. The surface of the modified Cinnabaris particles appeared as block-like structures with SiO2 adsorption, mainly showing the morphological characteristics of the Cinnabaris powder.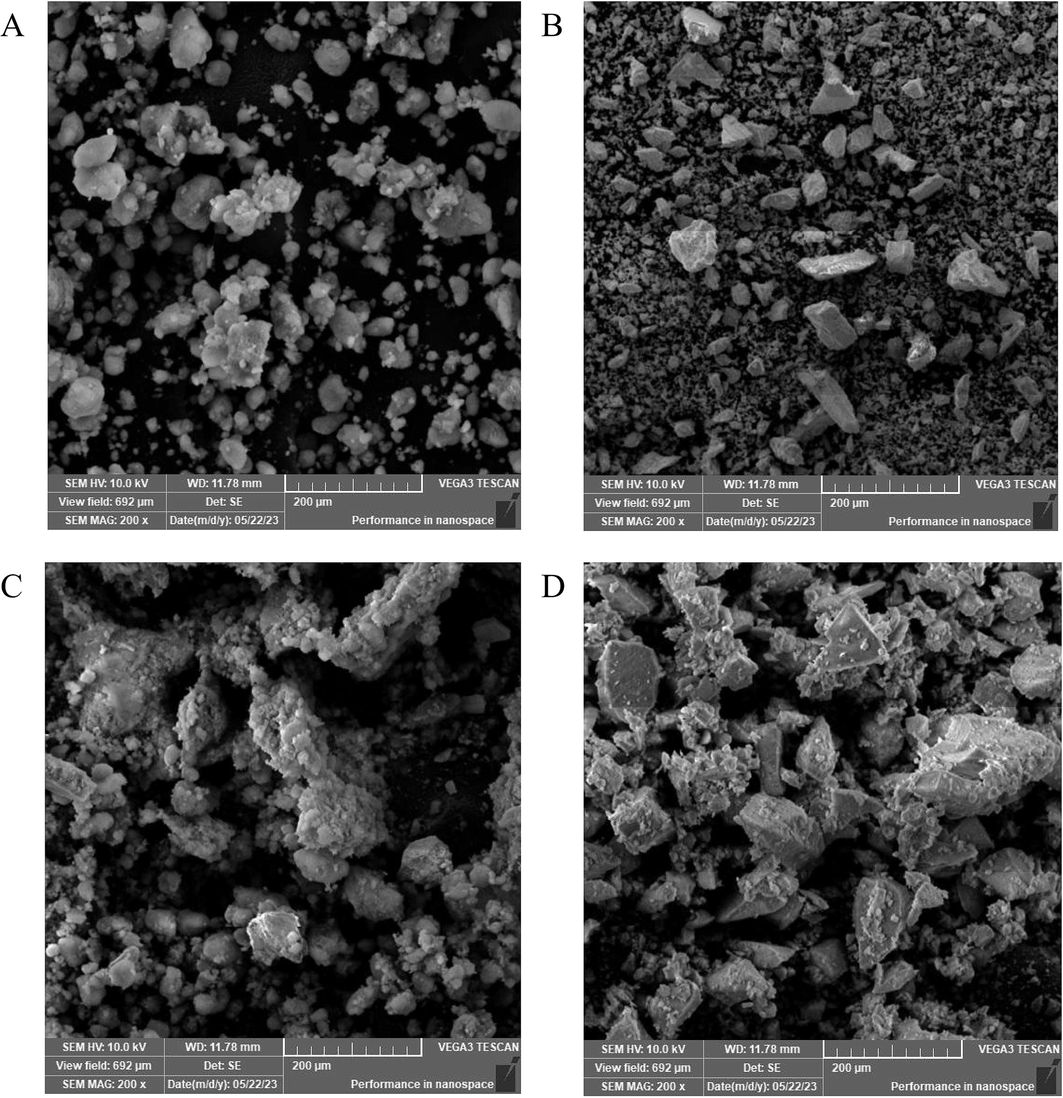
SEM images of SiO2 (A), Cinnabaris (B), physical mixture(C), and modified Cinnabaris particles (D).
3.2 Characterization of Pickering emulsion
3.2.1 Pickering emulsion type
Absorb the right amount of emulsion droplets onto the filter paper and observe the unfolding phenomenon (Fig. 3A).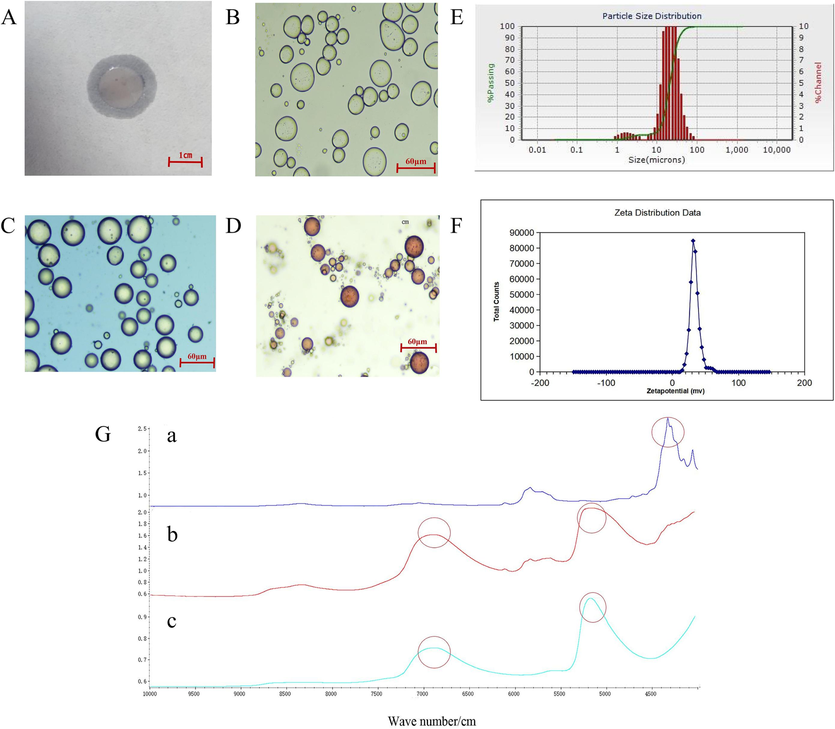
Characterization diagram of modified Cinnabaris particle Pickering emulsion. Filter paper method was used to identify the type of modified Cinnabaris particles (A), the microstructure of Pickering original emulsion (B), the microstructure of Pickering emulsion with methylene blue solution (C), the microstructure of Pickering emulsion with Sudan III solution (D), the particle size diagram of Pickering emulsion (E), the Zeta potential diagram of Pickering emulsion (F), the near-infrared spectrum of AT-VO(a), Cinnabaris suspension (b) and Pickering emulsion (c) (G).
3.2.2 Microscopic observation
The water phase could be stained with a methylene blue solution, and the oil phase could be stained with a Sudan III solution. 15 μL of Pickering emulsion were taken and placed on a glass slide for observation under 40x magnification. As shown in Fig. 3B-D, the outer phase was water, and the inner phase was oil, indicating that it was an O/W type emulsion. Under microscopy, the Pickering emulsion appeared as circular or elliptical shapes.
3.2.3 Particle size and Zeta potential
The particle size of the modified Cinnabaris Pickering emulsion was measured using a Microtrac S3500 laser particle size analyzer. The measurement was conducted in triplicate, and the characteristic value of the emulsion particle size distribution, d90, was recorded as 35.800 ± 0.955 µm (Fig. 3D). This indicated that the particle size of the modified Cinnabaris Pickering emulsion was in the micrometer range.
The Zeta potential of the Pickering emulsion was analyzed using a Zetasizer Nano ZS90 laser particle size analyzer. The modified Cinnabaris stabilizer is positively charged and the charge of the Pickering emulsion is positively correlated with the charge of the stabilizer, and the Pickering emulsion is also positively charged (Hajipour et al., 2016; Zhang et al., 2019). The higher the zeta potential, the better the stability of the Pickering emulsion. A suitable amount of the Pickering emulsion sample prepared using the optimal process was diluted 5 times with purified water, thoroughly mixed, and then the Zeta potential was measured. Measurements of each sample in triplicate at 25 °C resulted in 33.57 ± 0.45 mV (Fig. 3F).
3.2.4 Near-infrared spectroscopy (NIRS)
An appropriate amount of the AT-VO, Cinnabaris suspension, and Pickering emulsion sample were placed in a 2 mm quartz cuvette for spectrum collection. The spectral range was set at 4000~10000 cm−1, the collection temperature was room temperature, the scanning times were set at 32, the resolution was set at 8 cm−1, and the gain was set at × 1. Spectral data were collected by subtracting the background using air as a reference. Each sample was collected in triplicate, and the average NIRS data were obtained.
NIRS is more intuitive and obvious to observe the encapsulation of AT-VO by the Pickering emulsion as well as the characteristic peaks of the vermilion suspension. By observing the NIRS spectra (Fig. 3G), it was found that the characteristic absorption peaks of the AT-VO at wave numbers 8330, 7061, and 5838 cm−1 were weakened in the Pickering emulsion. The absorption peaks of the Pickering emulsion and modified Cinnabaris exhibited similar fluctuations, while the characteristic peaks of Cinnabaris were retained. The Pickering emulsion did not show any significant new absorption peaks, indicating that no new chemical bonds were formed in the Pickering emulsion.
3.3 Photostability experiment
3.3.1 Determination of VO retention
As depicted in Fig. 4A, the volume of the AT-VO in the crude oil group, oil–water mixture group, and Pickering emulsion group were measured under different durations of light. The results revealed that, under the conditions of placing in a lightbox with a light intensity of 4500 lx for 1, 3, and 5 days, the retention rate of volatile oil in the Pickering emulsion group had significantly increased compared to the AT-VO group and oil–water mixture group.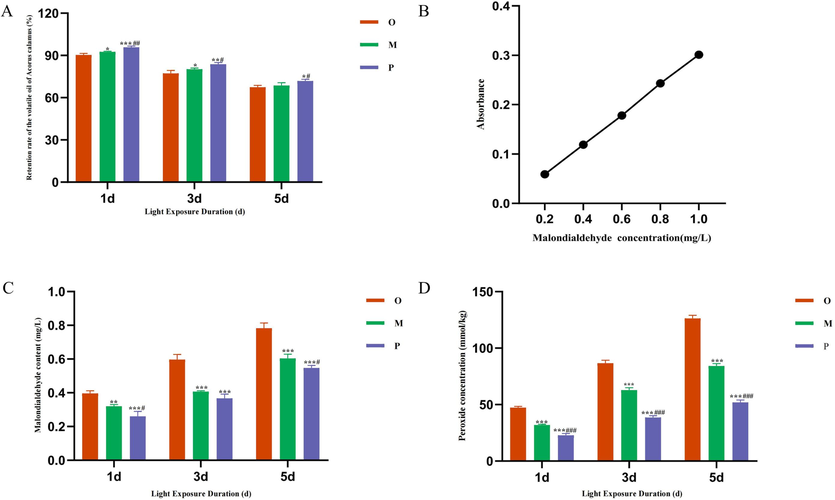
Retention of AT-VO at different light exposure durations (A). The standard curve of malondialdehyde (B). content of malondialdehyde at different light exposure durations (C). content of peroxide at different light exposure durations (D). Compared with crude oil group *P < 0.05, **P < 0.01, ***P < 0.001; compared with oil–water mixture group #P < 0.05, ##P < 0.01, ###P < 0.001. Note: O: Crude oil group; M: Oil-water mixture group (with oil content at 60 %); P: Pickering emulsion group.
3.3.2 MDA determination
A standard curve of MDA concentration was plotted with mass concentration as the X-axis and absorbance as the Y-axis. As shown in Fig. 4B, the linear regression equation had been Y = 0.3001X-0.0006, and the R2 = 0.9997. The MDA concentration in different samples had been calculated based on the standard curve. It was found that compared to the crude oil group (Fig. 4C), the Pickering emulsion group had shown a significant reduction in MDA content.
3.3.3 POV determination
The POV content of the AT-VO in different groups at various light times had been calculated. The results showed that there had been a significant reduction in peroxide content in the Pickering emulsion group compared to the crude oil group and the oil–water mixture group (Fig. 4D).
3.4 Feature analysis of volatile components of AT-VO
As was shown in Fig. 5, the total ion chromatogram of the GC–MS analysis of the AT-VO, under these chromatography conditions, the components could be separated and the peaks were clearly defined. This indicated that this analytical method had good separation and was suitable for subsequent relative content study requirements. The relative content of VO-sensitive compounds of different groups of A. tatarinowii Schott (AT) was calculated using the internal standard method (Table. 1), By analyzing the total ion flow diagram and summarizing the analysis results of different groups at different light exposure durations, a total of 71 types of volatile components in the AT-VO were identified.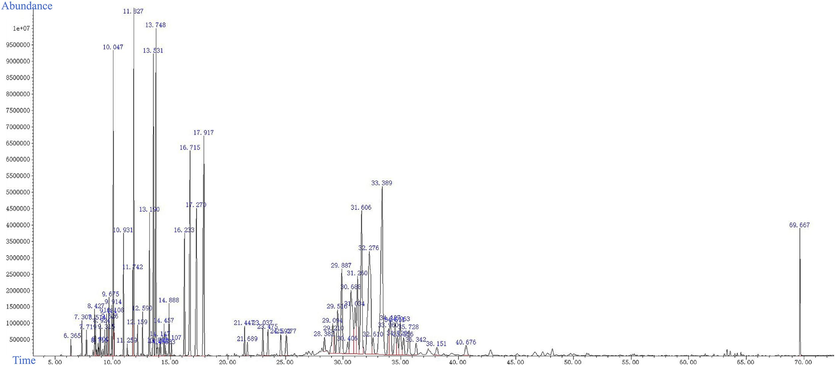
Total ion flow diagram for GC–MS analysis of the AT-VO. The horizontal coordinate is the time of the peak. The vertical coordinate is the relative abundance of ions.
CAS
Ingredient Name
Y
1 M
1O
1P
3 M
3O
3P
5 M
5O
5P
000111-84-2
Nonane
0.15 ± 0.00
0.00 ± 0.00
0.00 ± 0.00
0.15 ± 0.00
0.00 ± 0.00
0.00 ± 0.00
0.16 ± 0.01
0.00 ± 0.00
0.00 ± 0.00
0.15 ± 0.01
007785-26-4
(1S)-2,6,6-Trimethylbicyclo[3.1.1]hept-2-ene
0.34 ± 0.01
0.15 ± 0.02
0.18 ± 0.00
0.31 ± 0.00
0.00 ± 0.00
0.00 ± 0.00
0.29 ± 0.00
0.00 ± 0.00
0.00 ± 0.00
0.12 ± 0.00
005794-04-7
2,2-dimethyl-3-methylene-, (1S)-Bicyclo[2.2.1]heptane
0.29 ± 0.01
0.14 ± 0.01
0.16 ± 0.00
0.26 ± 0.00
0.00 ± 0.00
0.00 ± 0.00
0.24 ± 0.01
0.00 ± 0.00
0.00 ± 0.00
0.11 ± 0.00
003387-41-5
4(10)-Thujene
0.49 ± 0.01
0.28 ± 0.02
0.31 ± 0.00
0.42 ± 0.01
0.14 ± 0.01
0.14 ± 0.01
0.40 ± 0.01
0.00 ± 0.00
0.00 ± 0.00
0.24 ± 0.00
000127-91-3
beta-pinene
0.37 ± 0.01
0.20 ± 0.02
0.22 ± 0.00
0.33 ± 0.01
0.10 ± 0.01
0.10 ± 0.01
0.31 ± 0.01
0.00 ± 0.00
0.00 ± 0.00
0.18 ± 0.01
000500-00-5
Cyclohexene,4-methyl-1-(1-methylethyl)
0.13 ± 0.00
0.05 ± 0.05
0.09 ± 0.00
0.12 ± 0.00
0.00 ± 0.00
0.00 ± 0.00
0.11 ± 0.00
0.00 ± 0.00
0.00 ± 0.00
0.07 ± 0.00
000110-93-0
5-Hepten-2-one, 6-methyl-
0.13 ± 0.00
0.10 ± 0.00
0.10 ± 0.00
0.10 ± 0.00
0.08 ± 0.00
0.08 ± 0.00
0.08 ± 0.00
0.00 ± 0.00
0.00 ± 0.00
0.07 ± 0.00
000123-35-3
7-Methyl-3-methylene-1,6-octadiene
0.32 ± 0.01
0.21 ± 0.01
0.23 ± 0.00
0.26 ± 0.00
0.13 ± 0.00
0.12 ± 0.01
0.26 ± 0.00
0.00 ± 0.00
0.00 ± 0.00
0.17 ± 0.00
000124-18-5
Decane
0.08 ± 0.00
0.00 ± 0.00
0.00 ± 0.00
0.00 ± 0.00
0.00 ± 0.00
0.00 ± 0.00
0.00 ± 0.00
0.00 ± 0.00
0.00 ± 0.00
0.00 ± 0.00
000099-83-2
α-phellandrene
0.31 ± 0.00
0.21 ± 0.01
0.22 ± 0.00
0.26 ± 0.00
0.12 ± 0.00
0.12 ± 0.01
0.25 ± 0.00
0.00 ± 0.00
0.00 ± 0.00
0.16 ± 0.00
007785-70-8
2,6,6-trimethylbicyclo[3.1.1]hept-1-ene
0.42 ± 0.00
0.29 ± 0.02
0.31 ± 0.00
0.38 ± 0.00
0.18 ± 0.01
0.18 ± 0.01
0.37 ± 0.00
0.05 ± 0.04
0.00 ± 0.00
0.26 ± 0.00
000470-67-7
1-Methyl-4-(1-methylethyl)-7-oxabicyclo[2.2.1]heptane
0.36 ± 0.00
0.09 ± 0.16
0.29 ± 0.00
0.29 ± 0.00
0.14 ± 0.12
0.22 ± 0.01
0.24 ± 0.00
0.04 ± 0.07
0.03 ± 0.03
0.20 ± 0.00
029050-33-7
(+)-4-Carene
0.61 ± 0.01
0.42 ± 0.02
0.44 ± 0.00
0.50 ± 0.01
0.24 ± 0.01
0.23 ± 0.01
0.49 ± 0.00
0.15 ± 0.09
0.30 ± 0.04
0.30 ± 0.00
000099-87-6
1-methyl-4-(1-methylethyl)-benzen
0.54 ± 0.01
0.53 ± 0.01
0.57 ± 0.01
0.69 ± 0.02
0.53 ± 0.00
0.58 ± 0.02
0.60 ± 0.00
0.33 ± 0.11
0.33 ± 0.05
0.66 ± 0.00
000464-17-5
2-Bornene
3.51 ± 0.24
2.97 ± 0.08
3.12 ± 0.01
3.49 ± 0.05
2.21 ± 0.06
2.23 ± 0.10
3.36 ± 0.03
1.05 ± 0.34
0.88 ± 0.18
2.65 ± 0.02
000470-82-6
Eucalyptol
0.35 ± 0.01
0.30 ± 0.01
0.31 ± 0.00
0.30 ± 0.01
0.24 ± 0.00
0.24 ± 0.01
0.26 ± 0.00
0.14 ± 0.04
0.12 ± 0.02
0.22 ± 0.00
000508-32-7
Tricyclo[2.2.1.02,6]heptane, 1,7,7-trimethyl-
1.33 ± 0.02
1.07 ± 0.03
1.09 ± 0.01
1.14 ± 0.00
0.77 ± 0.02
0.75 ± 0.03
1.12 ± 0.01
0.39 ± 0.10
0.33 ± 0.05
0.81 ± 0.01
000586-67-4
Cyclohexene,4-methyl-1-(1-methylethenyl)
0.14 ± 0.00
0.12 ± 0.00
0.12 ± 0.00
0.13 ± 0.00
0.08 ± 0.02
0.07 ± 0.00
0.12 ± 0.00
0.00 ± 0.00
0.00 ± 0.00
0.08 ± 0.00
000586-62-9
4-Isopropylidene-1-cyclohexene
4.29 ± 0.10
3.85 ± 0.06
3.91 ± 0.02
3.98 ± 0.03
3.13 ± 0.05
3.10 ± 0.07
3.93 ± 0.04
1.97 ± 0.40
1.79 ± 0.21
3.13 ± 0.02
000078-70-6
1,6-Octadien-3-ol, 3,7-dimethyl-
0.32 ± 0.01
0.30 ± 0.00
0.30 ± 0.00
0.30 ± 0.00
0.31 ± 0.00
0.31 ± 0.00
0.30 ± 0.00
0.30 ± 0.01
0.31 ± 0.00
0.32 ± 0.00
001632-73-1
Fenchol
0.51 ± 0.01
0.48 ± 0.00
0.48 ± 0.01
0.48 ± 0.00
0.49 ± 0.00
0.50 ± 0.00
0.48 ± 0.00
0.47 ± 0.02
0.48 ± 0.01
0.51 ± 0.00
000586-82-3
3-Cyclohexen-1-ol, 1-methyl-4-(1-methylethyl)-
1.78 ± 0.03
1.75 ± 0.00
1.76 ± 0.01
1.74 ± 0.02
1.79 ± 0.00
1.82 ± 0.01
1.73 ± 0.01
1.77 ± 0.05
1.81 ± 0.02
1.82 ± 0.01
000138-87-4
b-Terpineol
4.80 ± 0.09
4.86 ± 0.04
4.85 ± 0.05
4.86 ± 0.01
4.95 ± 0.02
5.05 ± 0.04
4.80 ± 0.04
4.98 ± 0.11
5.13 ± 0.03
5.00 ± 0.02
000106-23-0
Citronellal
4.97 ± 0.09
4.88 ± 0.03
4.93 ± 0.05
4.88 ± 0.05
4.56 ± 0.04
4.70 ± 0.04
4.62 ± 0.05
4.20 ± 0.18
4.43 ± 0.06
4.48 ± 0.19
000124-76-5
DL-Isoborneol
0.17 ± 0.01
0.17 ± 0.00
0.17 ± 0.00
0.17 ± 0.00
0.17 ± 0.00
0.17 ± 0.00
0.16 ± 0.00
0.25 ± 0.01
0.25 ± 0.00
0.18 ± 0.01
000464-45-9
L(-)-Borneol
0.23 ± 0.00
0.22 ± 0.00
0.22 ± 0.00
0.23 ± 0.01
0.23 ± 0.00
0.23 ± 0.00
0.22 ± 0.00
0.24 ± 0.00
0.24 ± 0.00
0.24 ± 0.00
000562-74-3
4-methyl-1-(1-methylethyl)-3-Cyclohexen-1-ol
0.37 ± 0.01
0.36 ± 0.00
0.36 ± 0.01
0.37 ± 0.01
0.37 ± 0.00
0.38 ± 0.00
0.36 ± 0.00
0.37 ± 0.00
0.37 ± 0.01
0.39 ± 0.00
055722-59-3
3,7-dimethyl-3,6-octadienal
0.13 ± 0.00
0.12 ± 0.00
0.11 ± 0.00
0.11 ± 0.01
0.11 ± 0.01
0.10 ± 0.01
0.11 ± 0.00
0.09 ± 0.01
0.09 ± 0.00
0.09 ± 0.00
000098-55-5
alpha-Terpineol
0.66 ± 0.01
0.65 ± 0.00
0.65 ± 0.01
0.65 ± 0.01
0.68 ± 0.00
0.69 ± 0.01
0.65 ± 0.00
0.70 ± 0.01
0.72 ± 0.00
0.70 ± 0.00
000586-81-2
1-Methyl-4-(1-methylethylidene)cyclohexan-1-ol
0.19 ± 0.01
0.18 ± 0.00
0.18 ± 0.00
0.18 ± 0.00
0.19 ± 0.00
0.19 ± 0.00
0.18 ± 0.00
0.19 ± 0.00
0.20 ± 0.00
0.19 ± 0.00
001117-61-9
6-Octen-1-ol, 3,7-dimethyl- (R)-
2.20 ± 0.03
2.17 ± 0.01
2.15 ± 0.03
2.17 ± 0.02
2.26 ± 0.01
2.27 ± 0.02
2.17 ± 0.01
2.37 ± 0.02
2.40 ± 0.01
2.34 ± 0.01
000106-26-3
Neral
4.18 ± 0.01
4.18 ± 0.03
4.17 ± 0.02
4.05 ± 0.04
4.19 ± 0.01
4.23 ± 0.03
4.15 ± 0.02
4.18 ± 0.05
4.25 ± 0.01
4.06 ± 0.02
000106-24-1
Geraniol
3.29 ± 0.04
3.30 ± 0.02
3.28 ± 0.03
3.29 ± 0.00
3.41 ± 0.01
3.45 ± 0.02
3.29 ± 0.01
3.58 ± 0.03
3.65 ± 0.02
3.49 ± 0.01
000141-27-5
geranial
5.15 ± 0.07
5.44 ± 0.41
5.64 ± 0.38
5.16 ± 0.03
5.29 ± 0.02
5.36 ± 0.04
5.15 ± 0.04
5.74 ± 0.25
5.51 ± 0.03
5.31 ± 0.02
002792-39-4
(6E)-2,6-dimethylocta-2,6-diene
0.51 ± 0.01
0.51 ± 0.00
0.50 ± 0.00
0.51 ± 0.00
0.53 ± 0.00
0.54 ± 0.00
0.52 ± 0.00
0.56 ± 0.01
0.57 ± 0.00
0.57 ± 0.01
000097-53-0
Eugenol
0.26 ± 0.00
0.27 ± 0.00
0.24 ± 0.01
0.25 ± 0.00
0.30 ± 0.05
0.26 ± 0.01
0.24 ± 0.00
0.23 ± 0.05
0.18 ± 0.00
0.26 ± 0.00
000141-12-8
Neryl acetate
0.61 ± 0.01
0.58 ± 0.00
0.58 ± 0.01
0.58 ± 0.01
0.63 ± 0.01
0.63 ± 0.00
0.59 ± 0.00
0.67 ± 0.01
0.68 ± 0.01
0.68 ± 0.01
000515-13-9
(-)-beta-Elemene
0.57 ± 0.01
0.57 ± 0.00
0.57 ± 0.00
0.57 ± 0.00
0.60 ± 0.00
0.60 ± 0.00
0.57 ± 0.01
0.62 ± 0.00
0.63 ± 0.00
0.59 ± 0.00
000469-61-4
(−)-α-Cedrene
0.51 ± 0.01
0.53 ± 0.01
0.52 ± 0.00
0.52 ± 0.00
0.56 ± 0.02
0.56 ± 0.01
0.52 ± 0.00
0.57 ± 0.00
0.59 ± 0.02
0.54 ± 0.00
000546-28-1
1H-3a,7-Methanoazulene,octahydro-3,8,8-trimethyl-6-methylene-, (3R,3aS,7S,8aS)-
0.72 ± 0.01
0.74 ± 0.01
0.73 ± 0.01
0.72 ± 0.01
0.77 ± 0.00
0.77 ± 0.01
0.74 ± 0.00
0.81 ± 0.00
0.83 ± 0.03
0.77 ± 0.00
094535-52-1
(1R,3aS,4aS,8aS)-1,4,4,6-Tetramethyl-1,2,3,3a,4,4a,7,8-octahydrocyclopenta[1,4]cyclobuta[1,2]benzene
0.45 ± 0.01
0.83 ± 0.04
0.65 ± 0.19
0.49 ± 0.02
0.94 ± 0.06
0.90 ± 0.05
0.49 ± 0.01
0.78 ± 0.41
0.97 ± 0.05
0.92 ± 0.03
103827-22-1
2-isopropenyl-4a,8-dimethyl-1,2,3,4,4a,5,6,7-octahydronaphthalene
1.29 ± 0.07
1.35 ± 0.12
1.31 ± 0.06
1.22 ± 0.03
1.43 ± 0.05
1.40 ± 0.14
1.30 ± 0.04
1.58 ± 0.01
1.54 ± 0.04
1.42 ± 0.01
030021-74-0
gamma-muurolene
0.64 ± 0.02
0.68 ± 0.03
0.65 ± 0.04
0.62 ± 0.01
0.72 ± 0.03
0.72 ± 0.02
0.65 ± 0.00
0.78 ± 0.02
0.78 ± 0.01
0.73 ± 0.02
014912-44-8
Tricyclo[4.4.0.02,7]dec-3-ene, 1,3-dimethyl-8-(1-methylethyl)-, stereoisomer
1.70 ± 0.04
1.74 ± 0.07
1.67 ± 0.03
1.66 ± 0.01
1.71 ± 0.06
1.69 ± 0.07
1.68 ± 0.05
1.76 ± 0.02
1.70 ± 0.04
1.62 ± 0.01
017066-67-0
Naphthalene,decahydro-4a-methyl-1-methylene-7-(1-methylethenyl)-, (4aR,7R,8aS)-
3.26 ± 0.04
3.53 ± 0.08
3.43 ± 0.02
3.31 ± 0.01
3.77 ± 0.08
3.87 ± 0.07
3.52 ± 0.05
4.23 ± 0.05
4.31 ± 0.04
3.87 ± 0.01
005951-61-1
Naphthalene, 1,2,4a,5,8,8a-hexahydro-4,7-dimethyl-1-(1-methylethyl)-, (1R,4aS,8aR)-rel-
0.46 ± 0.01
0.55 ± 0.06
0.47 ± 0.01
0.45 ± 0.01
0.51 ± 0.08
0.54 ± 0.07
0.50 ± 0.02
0.61 ± 0.01
0.55 ± 0.08
0.55 ± 0.01
000473-13-2
alpha.-Selinene
4.36 ± 0.04
4.62 ± 0.04
4.52 ± 0.01
4.49 ± 0.06
4.80 ± 0.06
4.88 ± 0.06
4.57 ± 0.01
5.17 ± 0.06
5.21 ± 0.04
4.71 ± 0.01
029621-78-1
1,3-Cyclohexadiene, 1-methyl-4-(1,2,2-trimethylcyclopentyl)-
1.94 ± 0.00
1.97 ± 0.01
1.93 ± 0.04
1.90 ± 0.00
1.83 ± 0.02
1.79 ± 0.02
1.91 ± 0.01
1.72 ± 0.02
1.67 ± 0.01
1.64 ± 0.01
010208-80-7
(-)-alpha-muurolene
2.97 ± 0.02
3.15 ± 0.02
3.12 ± 0.01
3.09 ± 0.01
3.30 ± 0.02
3.35 ± 0.02
3.12 ± 0.01
3.55 ± 0.04
3.61 ± 0.04
3.23 ± 0.02
016982-00-6
Benzene, 1-methyl-4-(1,2,2-trimethylcyclopentyl)-, (R)-
5.74 ± 0.10
6.25 ± 0.15
6.18 ± 0.08
6.14 ± 0.04
6.70 ± 0.03
6.85 ± 0.05
6.18 ± 0.10
7.27 ± 0.08
7.52 ± 0.11
6.52 ± 0.02
028400-12-6
alpha-alaskene
7.91 ± 0.06
8.37 ± 0.04
7.65 ± 1.16
8.22 ± 0.08
8.63 ± 0.05
8.71 ± 0.05
8.27 ± 0.04
9.06 ± 0.10
9.22 ± 0.12
8.24 ± 0.03
016204-67-4
1H-Indene, 2,3-dihydro-1,1,4,5,6-pentamethyl-
0.59 ± 0.01
0.62 ± 0.01
0.62 ± 0.01
0.61 ± 0.00
0.63 ± 0.00
0.64 ± 0.00
0.61 ± 0.00
0.66 ± 0.01
0.67 ± 0.01
0.59 ± 0.01
000483-76-1
delta.-Cadinene
10.10 ± 0.07
10.82 ± 0.07
10.80 ± 0.06
10.61 ± 0.10
11.13 ± 0.05
11.23 ± 0.08
10.71 ± 0.07
11.63 ± 0.14
11.81 ± 0.15
10.41 ± 0.04
053585-13-0
Cyclohexene, 4-(1,5-dimethyl-4-hexenylidene)-1-methyl-, (4E)-
1.50 ± 0.05
1.61 ± 0.09
1.59 ± 0.01
1.50 ± 0.06
1.96 ± 0.53
2.24 ± 0.53
1.55 ± 0.03
2.53 ± 0.04
2.50 ± 0.02
2.31 ± 0.01
024406-05-1
Naphthalene,1,2,4a,5,6,8a-hexahydro-4,7-dimethyl-1-(1-methylethyl)-, (1S,4aR,8aR)-
1.32 ± 0.01
1.38 ± 0.01
1.38 ± 0.01
1.35 ± 0.01
1.42 ± 0.01
1.45 ± 0.01
1.37 ± 0.00
1.48 ± 0.03
1.53 ± 0.03
1.34 ± 0.00
000515-17-3
gamma.-Selinene
0.72 ± 0.01
0.76 ± 0.01
0.76 ± 0.01
0.74 ± 0.00
0.79 ± 0.01
0.80 ± 0.00
0.75 ± 0.01
0.83 ± 0.01
0.85 ± 0.00
0.75 ± 0.00
021391-99-1
α-Calacorene
1.42 ± 0.01
1.53 ± 0.01
1.53 ± 0.01
1.50 ± 0.01
1.60 ± 0.01
1.62 ± 0.00
1.52 ± 0.01
1.69 ± 0.03
1.72 ± 0.02
1.48 ± 0.00
017627-44-0
Cyclohexene,4-(1,5-dimethyl-1,4-hexadien-1-yl)-1-methyl-
0.69 ± 0.00
0.71 ± 0.00
0.70 ± 0.01
0.68 ± 0.01
0.72 ± 0.00
0.72 ± 0.00
0.69 ± 0.00
0.75 ± 0.02
0.75 ± 0.01
0.69 ± 0.00
021657-90-9
(S,3E,7E)-α,α,4,8-Tetramethyl-3,7-cyclodecadiene-1-methanol
1.05 ± 0.01
1.08 ± 0.01
1.08 ± 0.02
1.07 ± 0.01
1.14 ± 0.00
1.15 ± 0.00
1.09 ± 0.01
1.21 ± 0.03
1.24 ± 0.02
1.12 ± 0.01
158930-41-7
Eremophila ketone
0.47 ± 0.00
0.50 ± 0.01
0.50 ± 0.00
0.50 ± 0.01
0.53 ± 0.00
0.53 ± 0.00
0.50 ± 0.00
0.56 ± 0.01
0.57 ± 0.01
0.51 ± 0.00
020321-73-7
7-Methoxy-2,2-dimethyl-2,3-dihydro-4H-chromen-4-one
0.39 ± 0.01
0.41 ± 0.00
0.41 ± 0.01
0.38 ± 0.00
0.43 ± 0.02
0.43 ± 0.01
0.40 ± 0.01
0.46 ± 0.02
0.46 ± 0.01
0.37 ± 0.02
000077-53-2
Cedrol
0.54 ± 0.03
0.57 ± 0.03
0.55 ± 0.00
0.55 ± 0.01
0.61 ± 0.03
0.60 ± 0.02
0.55 ± 0.01
0.67 ± 0.01
0.67 ± 0.01
0.63 ± 0.01
002050-24-0
Benzene, 1,3-diethyl-5-methyl-
0.12 ± 0.00
0.04 ± 0.07
0.08 ± 0.07
0.12 ± 0.00
0.12 ± 0.00
0.08 ± 0.07
0.12 ± 0.00
0.13 ± 0.00
0.13 ± 0.00
0.12 ± 0.00
000629-97-0
Docosane
1.59 ± 0.07
1.64 ± 0.03
1.66 ± 0.04
1.64 ± 0.01
1.73 ± 0.03
1.77 ± 0.11
1.73 ± 0.04
1.89 ± 0.05
1.85 ± 0.13
1.74 ± 0.12
997083-73-1
Isopulegol
0.09 ± 0.00
0.08 ± 0.00
0.05 ± 0.05
0.09 ± 0.00
0.08 ± 0.00
0.03 ± 0.05
0.08 ± 0.00
0.00 ± 0.00
0.00 ± 0.00
0.00 ± 0.00
092471-23-3
(1R,2S,4R)-2-Hydroxy-α,α,4-trimethylcyclohexanemethanol
0.00 ± 0.00
0.00 ± 0.00
0.00 ± 0.00
0.21 ± 0.01
0.21 ± 0.03
0.00 ± 0.00
0.18 ± 0.00
0.24 ± 0.02
0.00 ± 0.00
0.00 ± 0.00
001197-01-9
2-(4-Methylphenyl)propan-2-ol
0.00 ± 0.00
0.00 ± 0.00
0.00 ± 0.00
0.00 ± 0.00
0.10 ± 0.00
0.12 ± 0.01
0.00 ± 0.00
0.12 ± 0.01
0.16 ± 0.00
0.14 ± 0.00
913176-41-7
4,11,11-Trimethyl-8-methylene-bicyclo[7.2.0]undec-3-en-5-ol
0.00 ± 0.00
0.00 ± 0.00
0.00 ± 0.00
0.00 ± 0.00
0.15 ± 0.18
0.00 ± 0.00
0.00 ± 0.00
0.15 ± 0.25
0.13 ± 0.22
0.00 ± 0.00
019912-62-0
T-muurolol
0.00 ± 0.00
0.00 ± 0.00
0.00 ± 0.00
0.00 ± 0.00
0.20 ± 0.18
0.00 ± 0.00
0.00 ± 0.00
0.35 ± 0.01
0.32 ± 0.02
0.29 ± 0.00
043219-80-3
(1R,4S,5S)-1,8-Dimethyl-4-(prop-1-en-2-yl)spiro[4.5]dec-7-ene
0.00 ± 0.00
0.00 ± 0.00
0.00 ± 0.00
0.00 ± 0.00
0.08 ± 0.15
0.00 ± 0.00
0.00 ± 0.00
0.30 ± 0.00
0.29 ± 0.02
0.26 ± 0.01
997332-93-7
2-Pentenoic acid, 3-methyl-5-(2,6,6-trimethyl-1-cyclohexenyl)
0.00 ± 0.00
0.00 ± 0.00
0.00 ± 0.00
0.00 ± 0.00
0.00 ± 0.00
0.00 ± 0.00
0.00 ± 0.00
0.00 ± 0.00
0.12 ± 0.20
0.00 ± 0.00
3.4.1 Heatmap of the average relative content of the AT-VO
Draw a heat map of the average content differences among different groups under different light exposure times, Docosane (CAS: 000629-97-0) and the distinctive components of unexposed AT-VO (CAS: 000124-18-5) were excluded, and a total of 69 types of volatile components in Calamus oil were identified (Fig. 6). From the plot, it was observed that the volatile component results of the heat map, following the clustering relationships, could be divided into five categories: ① 9 ingredients including 7-Methoxy-2,2-dimethyl-2,3-dihydro-4H-chromen-4-one (CAS: 020321-73-7), gamma.-Selinene (CAS: 000515-17-3); ② 8 ingredients including Cyclohexene, 4-(1,5-dimethyl-4-hexenylidene)-1-methyl-, (4E)- (CAS: 053585-13-0); Naphthalene,decahydro-4a-methyl-1-methylene-7-(1-methylethenyl)-, (4aR,7R,8aS)- (CAS: 017066-67-0); ③ 10 ingredients including alpha-alaskene (CAS: 028400-12-6); (-)-beta-Elemene (CAS: 000515 13-9); ④ 3 ingredients including Nonane (CAS: 000111-84-2); Benzene, 1,3-diethyl-5-methyl- (CAS: 002050-24-0); ⑤39 ingredients including: (+)-4-Carene (CAS: 029050-33-7); Cyclohexene,4-methyl-1-(1-methylethyl) (CAS: 000500-00-5). Among these, the fifth category contained the most content.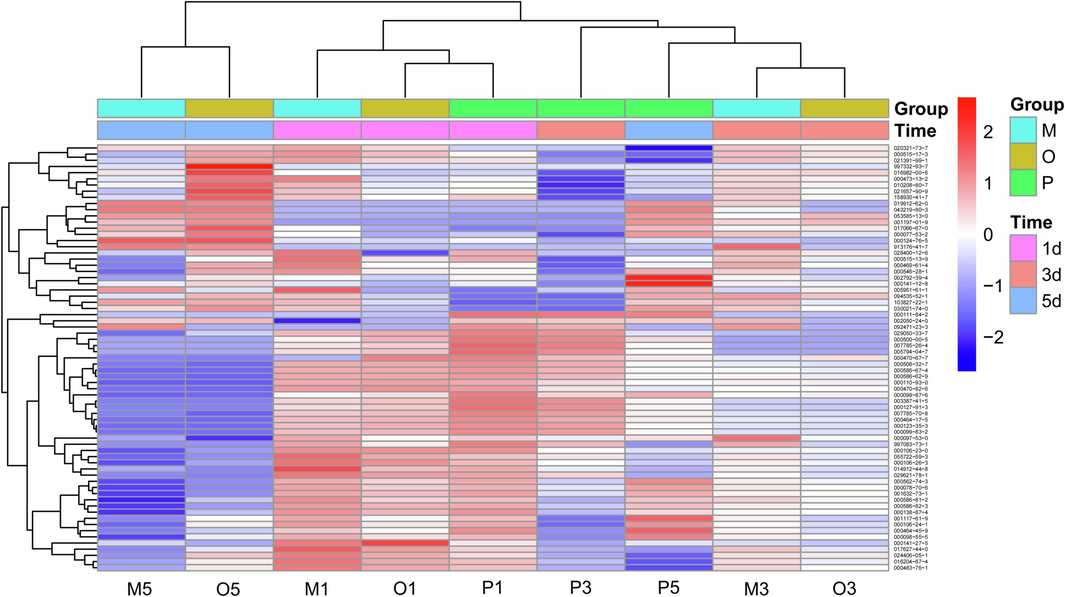
Heatmap of compounds analyzed by GC–MS of the AT-VO. Note: O1, M1, P1: average relative content of crude oil groups, oil–water mixture groups, and Pickering milk groups for light for 1 day; O3, M3, P3: average relative content of crude oil groups, oil–water mixture groups, and Pickering milk groups for light for 3 days; and O5, M5, P5: average relative content of crude oil groups, oil–water mixture groups, and Pickering milk groups for light for 5 days.
3.4.2 Differential component analysis
From the volcano plots (Fig. 7A-C) at different time points, a total of 24 unique differential components were identified after consolidating the differential components between the Crude oil group and the VO from untreated AT at different light exposure durations. The 24 differential components were as follows: 043219-80-3, 007785-70-8, 003387-41-5, 000099-83-2, 000127-91-3, 000123-35-3, 005794-04-7, 007785-26-4, 019912-62-0, 000508-32-7, 000586-62-9, 000470-67-7, 000464-17-5, 000470-82-6, 094535-52-1, 029050-33-7, 000099-87-6, 029621-78-1, 053585-13-0, 000106-23-0, 014912-44-8, 017066-67-0, 000586-82-3, and 000106-26-3.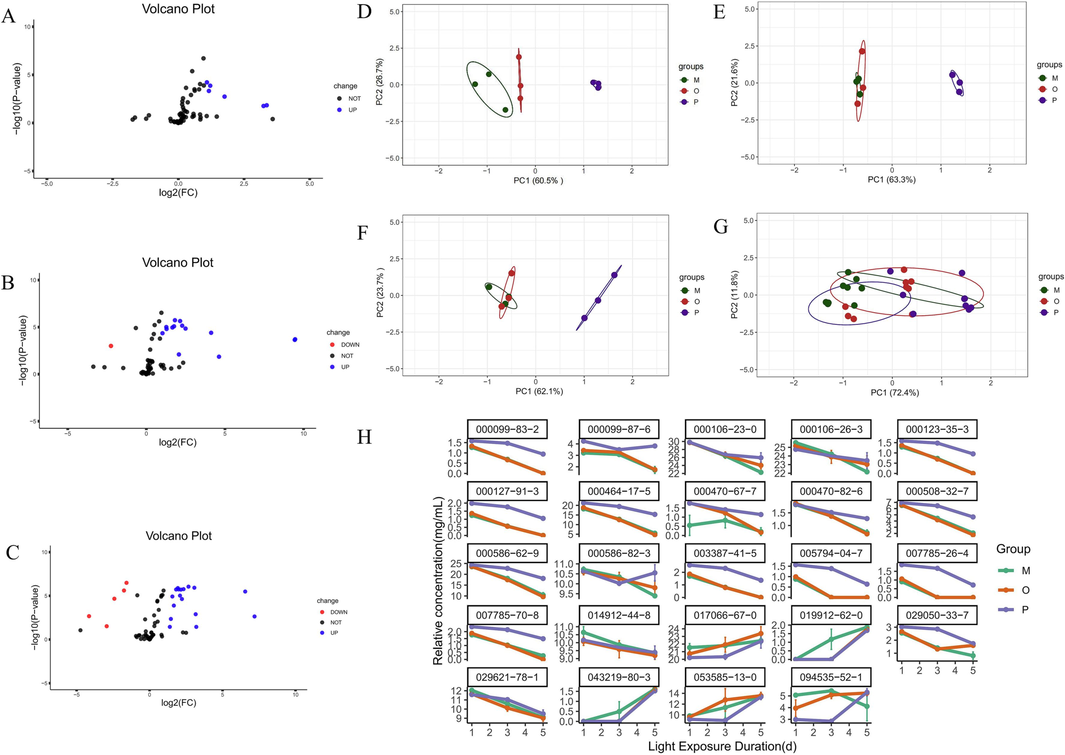
Difference composition volcano diagram between un-light-treated AT-VO and light-exposed for 1-day crude oil group (A); Difference composition volcano diagram between un-light-treated AT-VO and light-exposed for 3-day crude oil group (B); Difference composition volcano diagram between un-light-treated AT-VO and light-exposed for 5-day crude oil group (C); PCA plot of differential fractions for 1 day of light (D); PCA plot of differential fractions for 3 days of light (E); PCA plot of differential fractions for 5 days of light (F); Total PCA diagram of different components under different light exposure durations (G); line charts of different components in each group at different light exposure durations(H). Note: O: Crude oil group; M: Oil-water mixture group (with oil content at 60 %); P: Pickering emulsion group.
A principal component analysis was performed on the differential components of the VO product of different Calamus groups, and a PCA plot was drawn. As shown in Fig. 7D-G, there were three categories: the green represented the crude oil group, the red represented the oil–water mixture group, and the purple represented the Pickering emulsion group. In the PC1 axis, the Pickering emulsion group overall leaned towards the positive distribution, while the original oil group and the oil–water mixture group leaned towards the negative distribution. The Pickering emulsion group was distant from the other two groups, indicating significant differences between them. However, there was a partial overlap between the original oil group and the oil–water mixture group, suggesting a high degree of similarity and insignificant differences between their samples. In Fig. 7D, the variance contribution rate of PC1 was 60.5 %, and that of PC2 was 26.7 %, accounting for a total of 87.2 %. In Fig. 7E, the contribution rate of PC1 was 63.3 %, and that of PC2 was 21.6 %, with a total interpretability of 84.9 %. In Fig. 7F, the variance contribution rate of PC1 was 62.1 % and that of PC2 was 23.1 %, with a total interpretability of 85.2 %. Lastly, in Fig. 7G, the variance contribution rate of PC1 was 72.4 %, and that of PC2 was 11.8 %; the total interpretability was as high as 84.2 %. This underlined the high degree of similarity between the samples and verified the reliability of the results.
In Fig. 7H, By comparing line charts of different groups, it was observed that compared to the crude oil group, the decline trends in the relative content of 000099-83-2, 000099-87-6, 000106-23-0, 000123-35-3, 000127-91-3, 000464-17-5, 000470-67-7, 000470-82-6, 000508-32-7, 000586-62-9, 000586-82-3, 003387-41-5, 005794-04-7, 007785-26-7, 007785-70-8, 029050-33-7, and 029621-78-1 in the Pickering emulsion group had been slowed down. Similarly, the increase trends in the relative content of 017066-67-0, 019912-62-0, 043219-80-3, 053585-13-0, and 094535-52-1 in the Pickering emulsion group had also slowed down. This indicated that compared to the crude oil group, the stability of the Pickering emulsion group under light exposure was better.
3.5 Quantitative changes of AT-VO
3.5.1 Analysis of factors affecting the distribution of differential components
The relative molecular weight in the upregulated and downregulated differential components was the same and did not show specificity (Fig. 8A-B). The refractive index of the upregulated differential components was the highest, the boiling point was relatively high, and the water solubility and polarizability were low. The remaining factors were distributed in the middle. The flash point and water solubility of the downregulated differential components were the highest, and the boiling point was the lowest.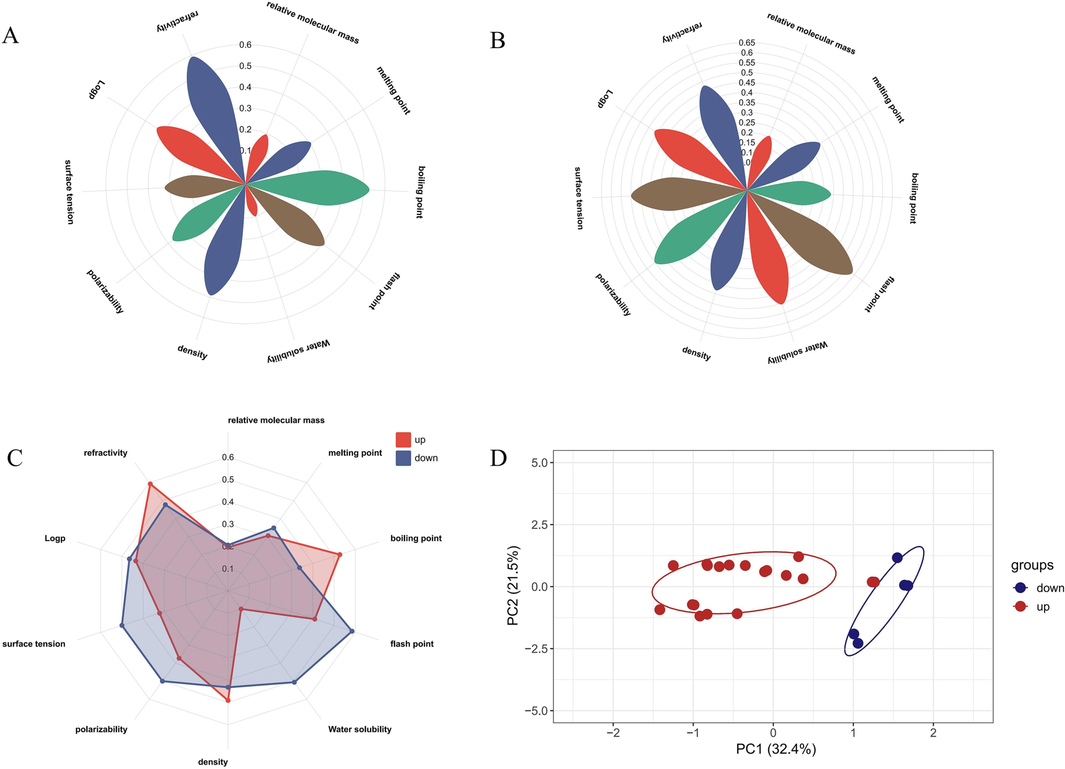
Physicochemical properties of upregulated differential components Petalogram (A); Physicochemical properties of downregulated differential components Petalogram (B); Radar plots of differentially upregulate versus downregulate components (C); PCA plots affecting the distribution of volatile differential components of AT (D).
According to Fig. 8D, further principal component analysis was conducted based on different physicochemical parameters to explore the primary factors affecting the distribution behavior of the components. After the analysis, a total of 10 principal components were obtained. The principal components PC1 and PC2 had larger variance contribution rates, and their cumulative variance contribution rate reached 53.9 %. These could be regarded as the main factors influencing the distribution patterns of the differential volatile components of AT. Specifically, PC1, which had a variance contribution rate of 32.4 %. The boiling point, flash point, and refractive index were positively correlated with PC1. On the other hand, PC2 had a variance contribution rate of 21.5 %. The water solubility was positively correlated with PC2, whereas the relative molecular weight, polarization rate, and surface tension were negatively correlated. The specific contributions of their physical and chemical properties are shown in Table 2.
relative molecular weight
melting point
boiling point
flash point
water solubility
density
polarizability
surface tension
Log p
refractive index
PC1 contribution
+0.48
+0.18
+0.51
+0.43
+0.03
−0.15
−0.14
−0.15
+0.28
+0.38
PC2 contribution
−0.19
−0.13
−0.05
−0.15
0.18
−0.28
−0.63
−0.63
−0.11
+0.01
When PC1 ranged from − 2.0 to 1.0 and PC2 ranged from − 2.5 to 2.5, the main contributors were the upregulated differential components. However, when PC1 ranged from 1.0 to 2.0 and PC2 from −2.5 to 2.5, the main contributors were the downregulated differential components. Based on the composition of the principal components, it could be seen that the relative molecular weight, boiling point, flash point, water solubility, polarization rate, and surface tension were key physicochemical property parameters that impacted the distribution behavior of the components. Specifically, components with a higher boiling point, higher refractive index, and lower water solubility tended to be distributed in the system of increased differential components. Conversely, components with a higher flash point, higher water solubility, and lower boiling point were more likely to be distributed in the system of decreased differential components.
3.6 Qualitatively changes of AT-VO
As shown in Fig. 9A, there were a total of 52 common components. Once the newly generated and disappeared components had been summarized and deduplicated, there were 6 newly generated components, with code numbers as follows: 092471-23-3, 001197-01-9, 913176-41-7, 019912-62-0, 043219-80-3, 997332-93-7, and 13 disappeared components with the following code numbers: 000124-18-5, 997083-73-1, 000111-84-2, 007785-26-4, 005794-04-7, 000500-00-5, 007785-70-8, 003387-41-5, 000127-91-3, 000110-93-0, 000123-35-3,000099-83-2 and 000586-67-4.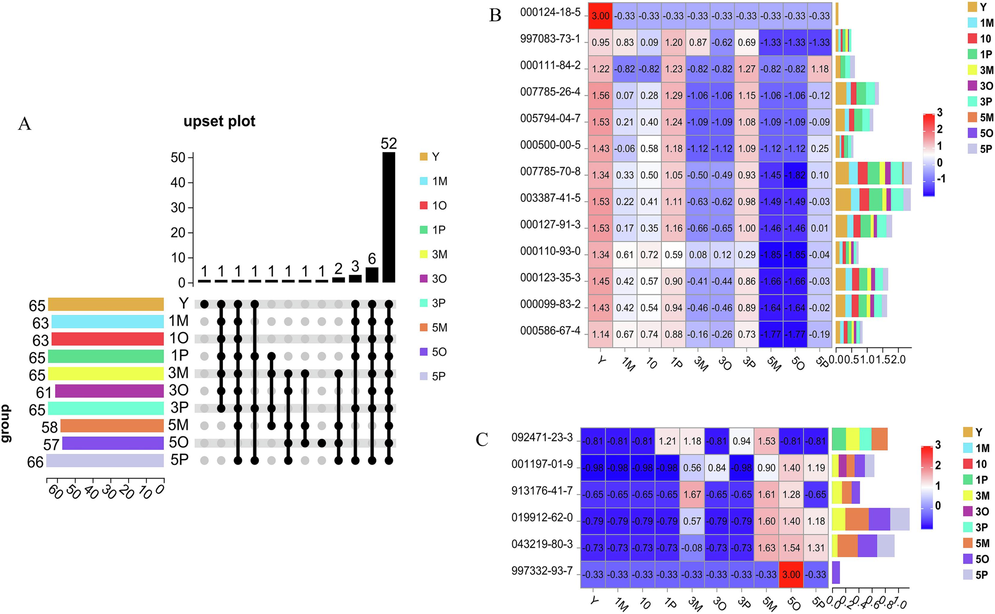
Changes in the composition of the AT-VO in different groups. unique and common components of the AT-VO in different groups (A); stacked dynamic thermograms of the disappearing components of the AT-VO in different groups (B); stacked dynamic thermograms of the newly generated components of the ATVO in different groups (C).
From the stacked dynamic thermograms of the disappearing components of the AT-VO in Fig. 9B, on the 1st, 3rd, and 5th day, compared with the crude oil group and the oil–water mixed solution group, the components of the AT-VO in the Pickering emulsion group were more similar to those of the untreated the AT-VO, and the content of volatile components was higher, indicating that the retention rate and stability of volatile components in the Pickering emulsion group were higher. The dynamic heatmap stacked Fig. 9C of newly generated components showed that there were fewer newly generated components compared with the untreated AT-VO. Among them, 092471-23-3 was a newly generated component unique to the oil–water mixed solution and Pickering emulsion, which continued to decrease and eventually disappeared as the light exposure time increased in the Pickering emulsion group. Among the other newly generated components, compared with the crude oil group and the oil–water mixed solution group on the 1st and 3rd day, there were no new components generated in the Pickering emulsion group, compared with the 5th day, the content of new components in the Pickering emulsion group was significantly reduced. This indicated that the Pickering emulsion technology had a certain protective effect on the AT-VO, thereby improving its stability.
3.7 Analysis of factors affecting the distribution of newly generated and disappeared components
Compared to crude oil without light treatment, the sensitive components screened out from the UpSet plot were divided into two categories, one being newly generated components, and the other being disappeared components. We separately searched for the physicochemical property parameters of new and disappeared components, including relative molecular weight, melting point, boiling point, flash point, water solubility, density, polarization rate, surface tension, etc. We normalized the different physicochemical parameters and calculated the average values of each physicochemical parameter with different distribution behaviors. The physical and chemical properties of the disappeared component 997083-73-1 and the newly formed component 997332-93-7 could not be found in the available databases. Among them, the newly generated components had higher relative molecular weight, melting point, flash point, water solubility, polarization rate, and lower Log P and refractive index. The remaining factors were distributed in the middle. The disappeared components had higher boiling points, density, refractive index, and the lowest water solubility and polarization rate, and the remaining factors were in the middle (Fig. 10A-B).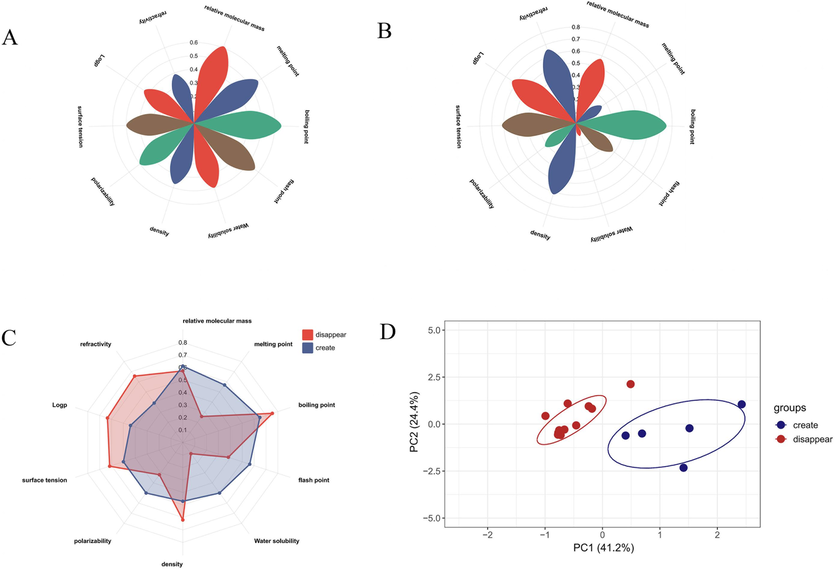
Physicochemical properties of newly generated components Petalogram (A); Physicochemical properties of disappearing components Petalogram (B); Radar plots of newly generated and disappearing components (C); PCA plots of the distribution of newly generated and disappearing components of AT (D).
Furthermore, based on the different physicochemical parameters of Fig. 10A-B, we explored the main components influencing the distribution behavior of the components. Through the analysis, we obtained 10 principal components. The variance contribution rates of principal components PC1 and PC2 were larger, and the cumulative variance contribution rate reached 65.6 %. Therefore, they could be considered the main components of the distribution laws of newly generated and disappeared components in AT-VO. The variance contribution rate of PC1 was 41.2 %, and the relative molecular weight, melting point, boiling point, flash point, and density were positively correlated with the principal components, while the refractive index was negatively correlated with the principal component. The variance contribution rate of PC2 was 24.4 %, and the water solubility and polarization were negatively correlated with the principal components. The specific contributions of their physical and chemical properties are shown in Table 3.
relative molecular weight
melting point
boiling point
flash point
water solubility
density
polarizability
surface tension
Log p
refractive index
PC1 contribution
+0.38
+0.29
+0.41
+0.43
+0.28
+0.34
−0.13
−0.19
−0.22
−0.34
PC2 contribution
−0.30
0.27
−0.27
−0.47
−0.37
−0.11
−0.50
−0.47
−0.30
+0.15
It was seen that when PC1 was between − 1.5 and 0.0 and PC2 was between − 2.5 and 2.5, the components mainly disappeared, while when the range of PC1 was from 0.0 to 2.5 and PC2 from −2.5 to 2.5, the components were mainly newly generated. Combined with the composition of the main components, it was determined that the key physicochemical property parameters affecting component distribution behavior were the relative molecular weight, melting points, boiling point, flash point, density, water solubility, polarizability, and refractive index. That was, components with higher relative molecular weight, higher melting point, higher flash point, and lower refractive index were more likely to be distributed in the newly generated components. Components with higher boiling points, higher density, lower water solubility, and lower polarizability were more likely to distribute in the disappeared component system. The specific mechanism of this effect required further in-depth research.
VOs, also known as essential oils, are a category of oily liquids that can be obtained from distillation with water vapor and are incompatible with water. They are commonly found in families such as Asteraceae, Rutaceae, Lamiaceae, Umbelliferae, Myrtaceae, etc. (Chen et al., 2023). Chinese medicinal VOs are mixtures composed of various chemical components, biosynthesized, accumulated, and stored in the form of oil droplets in the specialized tissue structures of aromatic plants (Ren et al., 2022). They are mainly composed of terpenes, aromatic compounds, and other oxygen-containing derivatives. They are susceptible to photolysis, initially producing peroxides through oxidation, and then degrading into secondary oxidation products, reducing the quality of the volatile oil (Wu et al., 2022, Costa et al., 2016). The oxidation of the AT-VO is a reaction between its unsaturated components and oxygen. Sunlight accelerates the formation of alkyd free radicals by promoting the absorption of hydrogen formed in the VO self-oxidation reaction, thus, accelerating the autoxidation reaction (Zhang et al., 2023). Research has found that light can excite the start of a volatile oil photooxidation reaction as it converts 3O2 in the air into singlet oxygen 1O2. 1O2 is a non-radical electrophilic molecule, which can directly undergo an olefin reaction with the double bond structure of terpene components, forming allyl peroxide. Further reactions can produce hydroperoxides, epoxides, and related compounds. These compounds, by changing the volatile oil's component content, affect the stability of the VO (Khayyat et al., 2018). Researchers have studied the photolysis process of the main components carvacrol and thymol in oregano volatile oil under quartz halogen lamp irradiation and found evident photooxidative degradation in both carvacrol and thymol under the conditions. This indicates that the 1O2 excited by quartz halogen lamp irradiation is the inherent cause of the photooxidative degradation of carvacrol and thymol in oregano volatile oil (Dimarco Palencia et al., 2020).
Guided by the idea of a “combination of medicine and adjuvant”, this research uses particle design technology to modify Cinnabaris particles, intentionally regulating their surface wettability to make them suitable stabilization agents. We incorporate Pickering emulsion technology, optimize processing parameters, and perform relevant characterization. The successful preparation of the Pickering emulsion resulted in an oil-in-water type emulsion. The zeta potential indicates good emulsion stability, and the near-infrared spectra show that the AT-VO is wrapped by the Cinnabaris particles without generating new absorption peaks. Studies on the stability of the AT-VO to light reveal that, compared to pure AT-VO, the Pickering emulsion prepared in this experiment significantly enhanced the retention rate of the volatile oil and significantly reduced the content of MDA and POV. By examining the changes in the VO composition of different AT groups, and comparing the trends in the content changes of different components, we observe that the change trends in the Pickering emulsion group are noticeably slower, indicating that the oxidation reaction rate is slower. This substantiates the technological advantage of Pickering emulsion in improving the stability of AT-VO. When examining the degraded components of AT-VO in different groups, we noticed that both the newly generated and disappeared components in the Pickering emulsion group were significantly less than those in the crude oil group and the oil–water mixture group. This shows that the Pickering emulsion group's AT-VO is closer to the untreated AT-VO, confirming the effective protection of the AT-VO in the Pickering emulsion group. This research also conducted a preliminary investigation on the distribution rule of the effects of component physicochemical properties on the differential components and the newly generated and disappeared components of the AT-VO. It initially demonstrated the rule of physicochemical properties affecting component distribution, providing practical reference value for similar research.
4 Conclusion
In conclusion, the modified Cinnabaris Pickering emulsion was prepared by the high shear method using SiO2 nanoparticles modified Cinnabaris powder as a stabilizer to improve the instability of VOs in oily formulations. A series of characterization experiments on the Pickering emulsion demonstrated the coating effect of the emulsion on the AT-VO. The Pickering emulsion is important to improve the stability of VOs under the strong oxidizing environment of light. In addition, the degree of oxidation of the volatile oil was thoroughly analyzed from both macroscopic and microscopic perspectives to elucidate the role of Pickering emulsion in enhancing the stability of VOs. These results indicate that the Pickering emulsion prepared by modified Cinnabaris has a promising application in Chinese medicine preparations. Meanwhile, this study also provides an optional method for the facile preparation of mineral drug stabilizers for traditional Chinese medicine.
Author contributions
H-R conducted the experiments and wrote the manuscript. F-L, X-FZ, D-YG, B-TZ, J-S, and D-KZ performed the data analysis. J-BZ and Y-JS designed the study and amended the paper. All authors have read and agreed to the published version of the manuscript.
Funding
This work was supported by the National Natural Science Foundation of China (82274105), Shaanxi Province Traditional Chinese Medicine Pharmaceutical Key Discipline Funding Project (303061107), Discipline Innovation Team Project of Shaanxi University of Chinese Medicine (2019-YL11) and Shaanxi Provincial Administration of Traditional Chinese Medicine Key Discipline of Traditional Chinese Medicine Pharmaceutical Engineering (2017001).
Institutional Review Board Statement
Not applicable.
Informed Consent Statement
Not applicable.
Acknowledgement
This is a short text to acknowledge the contributions of specific colleagues, institutions, or agencies that aided the efforts of the authors.
Declaration of competing interest
The authors declare that they have no known competing financial interests or personal relationships that could have appeared to influence the work reported in this paper.
References
- Cyclodextrin-based delivery systems for dietary pharmaceuticals. Environ. Chem. Lett.. 2019;17:1263-1270.
- [Google Scholar]
- Essential oils: from extraction to encapsulation. Int. J. Pharm.. 2015;483:220-243.
- [Google Scholar]
- Nanoemulsions of essential oils to improve solubility, stability and permeability: a review. Environ. Chem. Lett.. 2021;19:1153-1171.
- [Google Scholar]
- Treatment of pediatric febrile seizure based on Syndromes Identification of “Heat, Phlegm, Fright, wind “. J Nanjing Univ Traditional Chin Med. 2021;37:290-293.
- [Google Scholar]
- Classification and quality control analysis of solid preparations of traditional Chinese Medicines Containing Volatile Oils in the 2020 edition of Chinese Pharmacopeia. Chin. Tradit. Patent Med.. 2023;45:2275-2280.
- [Google Scholar]
- Emulsions stabilized with solid nanoparticles: Pickering emulsions. Colloids Surf A Physicochem Eng Asp. 2013;439:23-34.
- [Google Scholar]
- Using near infrared spectroscopy to classify soybean oil according to expiration date. Food Chem.. 2016;196:539-543.
- [Google Scholar]
- Oregano essential oil interactions with photogenerated singlet molecular oxygen. Photochem. Photobiol.. 2020;96:13265.
- [Google Scholar]
- Silica-grafted basic amino acids as environmentally benign catalysts for the solventless synthesis of cyclic carbonates from epoxides and CO2 under metal-free and halide-free conditions. Synlett. 2016;27:929-933.
- [Google Scholar]
- Preparation and characterization of SiO2 solid dispersions of Curcumae longae Rhizoma extract. Chin. Tradit. Patent Med.. 2018;40:320-325.
- [Google Scholar]
- Recent progress in photochemical reaction on main components of some essential oils. J. Saudi Chem. Soc.. 2018;22:855-875.
- [Google Scholar]
- The study on the efficacy of Ling Zhu San in the preventive treatment of recurrent febrile seizures in children. Shenzhen J. Integrated Tradit. Chin. Western Med. 2022;30:22-24. (in Chinese)
- [Google Scholar]
- Pickering emulsion technology based on the concept of “the combination of medicine and adjuvant” to enhance the oxidation stability of volatile oils in solid preparations-taking Lingzhu Pulvis as an example. RSC Adv.. 2022;12
- [Google Scholar]
- Research on Pickering emulsification technology based on the concept of “combination of medicine and adjuvant” to improve the pH stability of volatile oil in solid preparations—taking Lingzhu Pulvis as an Example. AAPS Open. 2023;9
- [Google Scholar]
- Study of the volatilization rules of volatile oil and the sustained-release effect of volatile oil solidified by porous starch. Sci. Rep.. 2022;12:8153.
- [Google Scholar]
- limma powers differential expression analyses for RNA-sequencing and microarray studies. Nucleic Acids Res.. 2015;43:e47.
- [Google Scholar]
- Chitosan-based Pickering emulsions and their applications: a review. Carbohydr. Polym.. 2020;250:116885
- [Google Scholar]
- Carboxylated chitin nanowhiskers enhanced stabilization of Pickering and high internal phase Pickering emulsions. Food Hydrocoll.. 2024;146:109206
- [Google Scholar]
- Brain metabolomics reveals the antipyretic effects of combined use of Ling–Zhu–San and acetaminophen in young rats using gas chromatography-mass spectrometry. J. Nanjing Univ. Tradit. Chin. Med.. 2022;38:409-418.
- [Google Scholar]
- Study on stability of volatile oil in foeniculi fructus and screening its antioxidants in accelerated oxidation environment. Chin. J. Exp. Tradit. Med. Formulae. 2019;34:108-115.
- [Google Scholar]
- GC-MS analysis of extraction kinetics of volatile oil from Acori Tatarinowii Rhizoma by steam distillation. Chin. Tradit. Herb. Drug. 2020;51:59-66.
- [Google Scholar]
- Porous multifunctional fluoropolymer composite foams prepared via humic acid modified Fe3O4 Nanoparticles stabilized Pickering high internal phase emulsion using cationic fluorosurfactant as co-stabilizer. Arab. J. Chem.. 2019;12:559-572.
- [Google Scholar]
- Octenyl succinic acid starch-stabilized vanilla essential oil pickering emulsion: preparation, characterization, antioxidant activity, and storage stability. Foods. 2022;11:987.
- [Google Scholar]
- Oil-water distribution characteristics of volatile oil from Dalbergiae Odoriferae Lignum by steam distillation. Chin. Tradit. Herb. Drug. 2019;50:3784-3793.
- [Google Scholar]
- Influencing factors, changing mechanisms and protection strategies of volatile oil from traditional Chinese medicine. Chin. Tradit. Herb. Drug. 2022;53:6900-6908.
- [Google Scholar]
- Facile fabrication of hollow molecularly imprinted polymer microspheres via pickering emulsion polymerization stabilized with TiO2 nanoparticles[J] Arab. J. Chem.. 2023;16:105304
- [Google Scholar]
- Research progress of Pickering emulsion drug delivery systems[J] Acta Pharm. Sin.. 2019;54:2232-2239.
- [Google Scholar]
- Volatile composition analysis of tree peony (Paeonia section Moutan DC.) seed oil and the effect of oxidation during storage. J. Food Sci.. 2021;86:3467-3479.
- [Google Scholar]
- Mechanism, indexes, methods, challenges, and perspectives of edible oil oxidation analysis. Crit. Rev. Food Sci. Nutr.. 2023;63:4901-4915.
- [Google Scholar]
- Exploring the mechanism of Lingzhu San in treating febrile seizures by using network pharmacology. Comb. Chem. High Throughput Screen.. 2021;24:1168-1182.
- [Google Scholar]
- Pickering water in oil emulsions prepared from biocompatible gliadin/ethyl cellulose complex particles. Food Hydrocoll.. 2023;134:108050
- [Google Scholar]
- Encapsulation of hydroxycitronellal in β-cyclodextrin and the characteristics of the inclusion complex. Pol. J. Chem. Technol.. 2023;25:20-27.
- [Google Scholar]


