

Translate this page into:
Coating of silver nanoparticles (AgNPs) on glass fibers by a chemical method as plasmonic surface-enhanced Raman spectroscopy (SERS) sensors to detect molecular vibrations of Doxorubicin (DOX) drug in blood plasma
⁎Corresponding authors. amin.hadi@yums.ac.ir (Amin Hadi), hbardania@gmail.com (Hassan Bardania)
-
Received: ,
Accepted: ,
This article was originally published by Elsevier and was migrated to Scientific Scholar after the change of Publisher.
Peer review under responsibility of King Saud University.
Abstract
In the present study, Doxorubicin (DOX) drug in healthy blood plasma was the focus of the investigation by surface-enhanced Raman scattering (SERS). In recent years, chemotherapy has been the most popular treatment for various types of cancer; however, its adverse side effects on the patient's health have made a negative aspect regarding the use of this technique. DOX is the most common chemotherapy drug and is used for the treatment of an extensive range of human malignancies. The surface-enhanced Raman scattering (SERS) is a precise technique for the detection of chemicals and biomaterials with significantly low concentrations. The glass fiber substrates coated with silver nanoparticles (AgNPs) have been used to detect DOX. First, the Tollens' method was applied to prepare the AgNPs, and the characteristics of fabricated AgNPs were evaluated using ultraviolet–visible spectroscopy (UV–Vis) and X-ray diffraction (XRD). Then, AgNPs were coated on the glass fiber substrate by a chemical method. Finally, the enhancement of the Raman signal resulted from the molecular vibrations of DOX was evaluated using these SERS-active substrates as plasmonic and Raman spectroscopy sensors. Afterward, for making the sensors practical, the DOX in blood plasma were deposited on the fabricated sensors, and the Raman vibrations were evaluated. The SERS-active substrates, AgNPs deposited on glass fiber substrates, were fabricated for the detection of DOX in and out of the blood plasma; the limit of detection (LOD) for both was 10−10 M, and the mean relative standard deviation at concentrations of 10−10 M of DOX out of blood plasma, and 10−10 M of DOX in blood plasma were obtained to be 3.76% and 3.61%, respectively for ten repeated measurements in which the AgNPs were SERS-active substrates of the biosensors for detecting the DOX. In addition, the enhancement factor was calculated both experimentally and via finite-difference time-domain (FDTD) simulation, which was 29.76 × 10³ and 24.95 × 10³, respectively. Therefore, these SERS-active substrates can be used to develop microsensors and show positive results for SERS-based investigations.
Keywords
Doxorubicin (DOX) drug
Blood plasma
Silver nanoparticles (AgNPs)
Glass fiber substrates
Plasmonic substrates
Surface-enhanced Raman spectroscopy (SERS)
Plasmonic nanosensor

1 Introduction
In recent years, chemotherapy has been the most popular treatment for various types of cancer. The main limitations related to chemotherapy are its adverse side effects on the patient's health as well as the calculation of the drug doses using the surface area of the body (Gurney, 2002). Moreover, the drug levels in the blood serum and plasma include the most valuable biochemical information for therapeutic drug monitoring (TDM) in patients undergoing continuous chemotherapy for rapid clinical decision-making (Kang and Lee, 2009). Doxorubicin (DOX) is among most common chemotherapy drugs and is used to treat an extensive range of human malignancies. Inhibition of topoisomerase II, production of free radicals, and the interlayer penetration of DNA justify the anticancer effects of DOX (Gerweck et al., 1999). However, the clinical use of this drug has been controversial due to its nature. Therefore, the TDM of this drug may assist physicians in controlling the dosage for patients undergoing continuous chemotherapy so that its toxicity to be reduced and its therapeutic efficacy be increased. The TDM of DOX has been so far reported by electrochemical sensors (Soleymani et al., 2017), spectrophotometric method (Eman and El-Yazbi, 2016), mass spectrometry/liquid chromatography mass spectrometry (MS/LC-MS) (Ibsen et al., 2013), high-performance liquid chromatography (HPLC) (Daeihamed et al., 2015), etc. Moreover, TDM of DOX with a concentration of more than 50 nM has been reported using surface-enhanced Raman spectroscopy (SERS) connected to a complex microfluidic system (Sun et al., 2016). However, the main challenges with these technologies are the time and cost of sample preparation, which makes clinical samples significantly difficult. Therefore, the development of a rapid and sensitive tool for TDM to assess the patient by a better method as an option for individual therapy is of great importance. Raman spectroscopy is an excellent approach to identify the composition of various substances, including biological and chemical species; however, the Raman signals of biological and chemical species are considerably low, especially at low concentrations (Wang et al., 2019; Su et al., 2019). In the SERS method, the intensity of Raman signals can be enhanced as a result of interaction between the metal surface plasmons and the species by placing different biological and chemical species near or physically adsorbing them on the surface containing metal nanoparticles. Thus, SERS can also be applied to quickly and accurately detect biological and chemical species (Zhou et al., 2014). Due to the excellent optical properties of metal nanoparticles, such as gold or silver nanoparticles, various methods have been proposed for the fabrication of layers consisting of these particles (Yu et al., 2011). Raman scattering results from the inelastic scattering of light from matter, and this effect develops very detailed information about the structure of a molecule. Raman spectroscopy not only allows the study of molecules under normal conditions but also provides the evaluation of catalytic processes as well as those procedures occurring in the metal-electrolyte interface (Cyrankiewicz et al., 2007). However, the Raman signal is inherently weak, which leads to the detection being challenging (Duan et al., 2016). The use of metal nanostructures is among the Raman signal enhancement techniques that can significantly enhance the scattering signal due to the surface plasmon resonance. This selective and sensitive approach is called Surface-enhanced Raman Scattering (SERS), which results in enhanced Raman scattering of molecules adsorbed on metal structures (Wang and Fang, 2006). Metals such as gold, silver, copper, and platinum have been applied to observe this phenomenon. Among the various metals, the greatest attention has been paid to silver and gold because of their plasmonic resonance in the visible and infrared region, greater stability, and easy fabrication methods to identify biological and chemical species (Canamares et al., 2008). Although much progress has been made in the field of TDM using the SERS technique, the clinical and practical studies of this technology are still challenging. Testing SERS substrates of pure dilutions may yield promising results; however, the use of undiluted body fluids for TDM still seems complicated because the plasmonic metal surface alone cannot survive the non-specific interaction of protein components in body fluids leading to rapid surface deposition and blockage of SERS hotspots, and in turn, affect the capability in performing assays. This obstacle can be eliminated by reducing the deposition of a substrate with minor changes (Zhang et al., 2011; Liang et al., 2010). Fabrication of SERS substrate is one of the most important and key processes in the analysis of biomaterials and chemicals. Glass fibers, due to their solidity, low cost, portability, and good absorption, is considered a suitable substrate for being coated by nanoparticles for providing a SERS biosensor (Lee and Lee, 2018). On the other hand, since glass fiber substrates have non-uniform surfaces, they are suitable substrates for SERS-based biosensors. In the present study, the silver nanoparticles (hereafter called AgNPs) were coated by a chemical method and at room temperature on glass fiber substrates with high mechanical adhesion and through a fast and cost-effective procedure, to be utilized as SERS-active substrates (hereafter called SAS) and plasmonic sensors for the purpose of detecting molecular vibrations of DOX at low concentrations. In this study, the detection range of DOX in blood plasma was equal to 10−10 M; the first report that is presented without high dilution and using the SERS method. A numerical approach called finite-difference time-domain (FDTD) method is used for modeling computational electrodynamics and has recently been applied to investigate SERS for the purpose of understanding the underlying physics as well as better design and fabrication of SERS substrates (Zeng et al., 2016). In the present investigation, the enhancement factor (EF) was calculated both experimentally and by FDTD simulation, which were in acceptable ranges and confirmed that these substrates can be used as SERS-active substrates to detect different materials.
2 Materials and methods
2.1 Fabrication and detection methods
2.1.1 Chemicals used
Silver nitrate (AgNO3) with a molar mass of 169.87 g/mol and a purity higher than 99.95%, sucrose (C12H22O11) with a molar mass of 342.30 g/mol and a purity higher than 99.98%, potassium hydroxide (KOH) with a molar mass of 56.10 g/mol and purity of higher than 99.98%, ammonia (NH4OH) with a molar mass of 17.031 g/mol and a purity higher than 99.99%, (3-Aminopropyl) triethoxysilane (APTES) prepared by Sigma Aldrich Company, Doxorubicin (DOX) C27H29N1O11, with a molar mass of 543.5 g/mol, Glass fiber as a substrate, acetone with a molar mass of 58.09 g/mol and a purity higher than 99.95%, ethanol with a molar mass of 46.069 g/mol and a purity higher than 99.95% prepared by Merck Company, and blood plasma are the materials used in this study.
2.1.2 Fabrication method of SAS as plasmonic sensors
Glass fibers were cut as substrates with dimensions of 1.0 cm × 2.5 cm. After washing with soap and water, acetone, and ethanol, the samples were heated in a furnace at 400 °C for 30 min to remove organic contaminants from the surface of the glass fibers and provide hydrophilic surfaces for coating these fibers with AgNPs. These glass fibers were then placed in a piranha solution at 80 °C. After 30 min, the glass fibers were washed with DI water and immediately transferred into a boiling solution. Again, after 30 min, they were washed with DI water, and the activated surface of the glass fibers was immersed in a 1% APTES solution of ethanol for 24 h. The functionalized surface of the glass fibers was washed several times with ethanol to remove excess reagents from the surface and finally dried for 1 h at 110 °C (Zhu et al., 2013). The Tollens' chemical method was applied to fabricate AgNPs. Three aqueous solutions, including (1) 12 ml of 0.1 M AgNO3 solution, (2) 20 ml of 0.05 M potassium hydroxide solution, and (3) 10 ml of 0.07 M sucrose solution, were used in this method. By adding sucrose solution to the ammonia AgNO3 and KOH and by immersing the glass fibers inside the solution at room temperature, AgNPs were fabricated on the glass fibers after about 120 min (Yin et al., 2002), a deposition process was performed, and the substrates coated with AgNPs were dried at laboratory temperature. In order to detect DOX, the concentrations of 10−1-10−10 M of this drug were prepared with DI water solution, and the volume of 10 μL of each of the prepared concentrations was sprayed separately by dropping method on SAS plasmonic sensors. After drying in the presence of air, the Raman spectrum of DOX deposited on glass fibers and the SERS of DOX deposited on SAS plasmonic sensors were measured and analyzed, and then the molecular vibrations of DOX were detected in blood plasma as a sample by SAS plasmonic sensors and Raman spectroscopy. In addition, DOX was prepared in the blood plasma taken from the centrifuged blood at 14,000 rpm for 30 min to obtain a concentration of 10−1 M. Then, different concentrations of DOX (10−1 M to 10−10 M) were prepared in undiluted blood serum. In addition, all SERS measurements were performed by dropping 10 μL of each concentration from the prepared analytes, and then the incubation was performed for 10 min at room temperature.
2.1.3 Characterization
UV–Vis spectroscopy for the colloidal solution of AgNPs and SAS as plasmonic sensors was performed using a Perkin-Elmer Lambda 25 device, and the X-ray diffraction (hereafter called XRD) pattern of silver powder and silver-coated glass fiber substrate as a SERS biosensor was made X'Pert PRO MPD devices, manufactured by Panalytical Company, with Cu Kα monochromic light with voltage, current, and wavelength of 40 kV, 40 mA, and 0.154 nm, respectively, at room temperature. A Hitach S4160 was used to analyze the images from a field emission scanning electron microscope (FE-SEM). Moreover, the SERS and Raman spectra of samples were measured using Lab Ram HR confocal Raman spectroscopy fabricated by Horiba Company with a 633 nm laser light and 17 mW output power.
2.2 FDTD simulation
Finite-difference time-domain (FDTD) simulation was conducted using FDTD solutions (version 8.19) software provided by Lumerical Solutions, Inc (Kim et al., 2013). For performing this simulation, three spherical AgNPs of diameters 80 nm with a distance of 60 nm from together, deposited on the glass substrate, were modeled, and then the DOX analyte was added to the substrate coated with AgNPs. In addition, a gap between the AgNPs and the substrate was established and fixed to be 1 nm for modeling the “hotspot” phenomenon.
3 Results and discussion
3.1 UV–Vis absorption spectrum and XRD spectrum of the colloidal solution of AgNPs
The Tollens' method and sucrose, as a reductant, were used to chemically fabricate the AgNPs; their absorption spectra are shown in Fig. 1-(A). The formation of AgNPs is confirmed by the emergence of a plasmonic resonance peak at 418 nm (Ngumbi et al., 2018); spherical or quasi-spherical morphologies of silver and gold nanoparticles are shown by the appearance of a peak in the absorption spectra of nanoparticles (Baytekin et al., 2015). The XRD pattern of AgNPs is shown in Fig. 1-(B). It is noteworthy that this pattern indicates the FCC structure. At 2θ, the significant and main peaks are equal to 38.22, 44.38, 64.58, and 77.49°and are respectively related to the formed crystal plates 111, 200, 220, and (3 1 1). Using the Debye Scherrer equation defined as Eq. (1), the average grain size was roughly equal to 28 ± 1 nm.
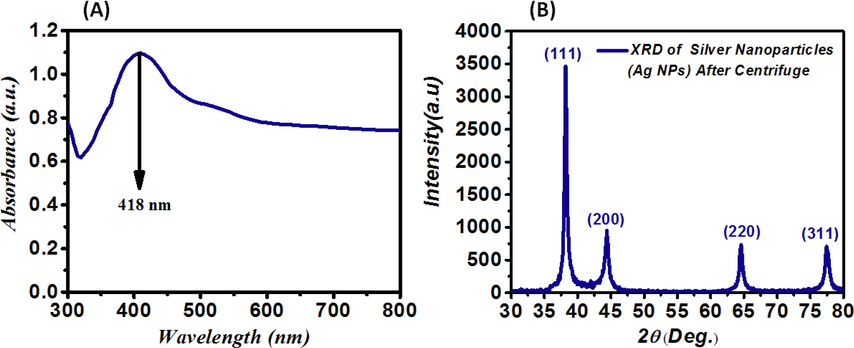
(A)- Absorption spectrum of AgNPs with 0.05 M AgNO3 at 23 ± 1 °C (fabrication temperature) and the sucrose as a reductant with a maximum absorption (wavelength = 418 nm) at 2 h; (B)- XRD pattern from AgNPs fabricated with 0.05 M AgNO3 at 23 ± 1 °C (fabrication temperature) prepared by the sucrose as reductant and the Tollens' method.
3.2 UV–Vis extinction spectrum, XRD spectrum, FE-SEM images, and energy-dispersive X-ray (EDX) of colloidal solution of AgNPs deposited on a glass fiber substrate
Fig. 2-(A) and Fig. 2-(B) indicates the FE-SEM images of glass fiber substrates in the scalebars of 50 μm and 10 μm, respectively. In Fig. 2-(C), Fig. 2-(D), Fig. 2-(E), and Fig. 2-(F), FE-SEM images are relevant to the AgNPs-coated glass fiber substrate as a SERS plasmonic sensor at scalebars of 50 μm, 10 μm, 2 μm, and 1 μm, respectively. Moreover, Fig. 2-(G) demonstrates the EDX spectrum of AgNPs-coated glass fiber substrate as a SERS plasmonic sensor that indicates the elements and their mass and atomic percentages in the sample. In Fig. 2-(F), through magnifying on a scalebar of 1 μm, it is confirmed that AgNPs are present on the glass fiber substrate. In Fig. 2-(F), it is clear that the concentration of AgNO3 and the amount of AgNPs are key parameters in the formation of AgNPs on glass fiber substrates since the full coating of AgNPs on the glass fiber substrate is not performed in the case of low concentrations of AgNO3. The selective growth of spherical AgNPs on the glass fiber substrate has been caused by the concentration of AgNPs and AgNO3. As shown in Fig. 2-(G), through analyzing the EDX spectrum, it is confirmed that AgNPs are present on the glass fiber substrate. The larger particles appear whiter and brighter, and significant electric near-fields are created by smaller AgNPs around themselves, which are the results of the resonance of silver surface plasmons. Various chemical variants of DOX in and out of blood plasma will experience electric near-fields if they are placed at these positions. The light emitted to larger particles with insignificant electric near-fields strengthens the electric far-field or scatters from the surface of these particles (Ding et al., 2017). Fig. 2-(H) indicates the size distribution of deposited AgNPs on a glass fiber substrate as SERS biosensors for Fig. 2-(E) that were measured by Digimizer software (version 4.2). As shown in this figure, the AgNPs have sizes between 100 nm and 1700 nm, and the number of nanoparticles with sizes in the range of 1400–1500 nm is more than other nanoparticles. Fig. 2-(I) shows the extinction spectrum of AgNPs coated on SAS. As indicated in Fig. 1-(C), through depositing AgNPs on the glass fiber substrate and the appearance of a plasmon resonance peak at 430 nm, it is confirmed that AgNPs are formed on the glass fiber substrate. By changing the media containing these particles, which change from water to glass fiber and air, the displacement occurs at the wavelength of the plasmonic peak, its height decreases, and the width of the peaks increases since the position of the plasmonic peak depends on the refractive index of the media (Bohren et al., 1983). According to Fig. 1-(C), in contrast to a stable colloidal solution, in which AgNPs are dispersed in aqueous solution at certain distances from each other, by depositing AgNPs on glass fibers, the particles are placed next to each other during the drying process, and clumps of nanoparticles are formed on the substrates so that these clumps can be considered to be larger particles leading an increase in the width of the spectrum (Bohren et al., 1983). Moreover, the decrease in peak intensity is also due to the scattering of light from the clumps (Bohren et al., 1983). Due to the reflection and scattering of light from the surface of the glass fiber, the background of the extinction spectrum (absorption spectrum + scattering spectrum) of SAS has occurred at higher values compared to the absorption spectrum. Fig. 2-(J) shows the XRD pattern of AgNPs deposited on glass fibers as SAS (Olusanya et al., 2017). As shown in Fig. 2-(J), all AgNPs have similar structures and morphologies. The high crystallinity of the substrate is also shown in Fig. 2-(J). It is noteworthy that the Ag deposited on the glass fiber substrate oxidizes after some time in the laboratory and the peak appearing at 2θ (equal to 24.11°) is related to Ag2O.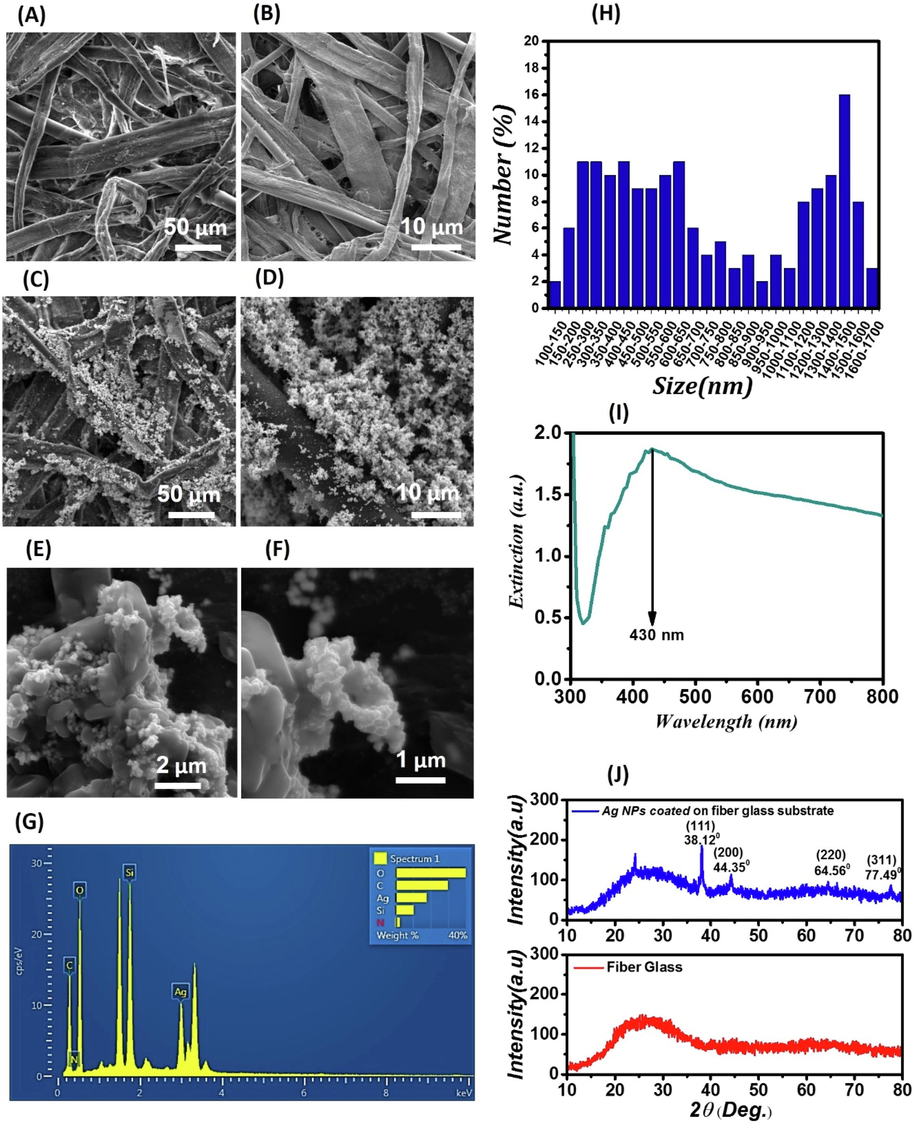
(A)- FE-SEM images of glass fiber substrates at a scalebar of 50 μm; (B)- FE-SEM images of glass fiber substrates at a scalebar of 10 μm; (C)- FE-SEM images of the AgNPs-coated glass fiber substrate (as a SERS plasmonic sensor) at a scalebar of 50 μm; (D)- FE-SEM images of the AgNPs-coated glass fiber substrate at a scalebar of 10 μm; (E)- FE-SEM images of the AgNPs-coated glass fiber substrate at a scalebar of 2 μm; (F)- FE-SEM images of the AgNPs-coated glass fiber substrate at a scalebar of 1 μm; (G)- EDX spectrum of the AgNPs-coated glass fiber substrate; (H)- Size distribution of deposited AgNPs on a glass fiber substrate; (I)- Extinction spectrum of AgNPs deposited on glass fibers; (J)- XRD spectrum of glass fibers and AgNPs deposited on glass fibers.
The formed AgNPs were found to have FCC structures based on the number of plates. Using the Debye Scherrer formula, the average grain size on the plate 111 was roughly equal to 129 ± 1 nm (1). The angle 2θ of the plate 111 is 38.12°, and the full width at high maximum (FWHM) is equal to 0.579. The significant peaks are at 38.12, 44.35, 64.56, and 77.49°, and respectively correspond to the crystal plates 111, 200, 220, and (3 1 1). The presence of AgNPs is confirmed by the crystal plates that appeared on the glass fibers (Olusanya et al., 2017; Nangmenyi et al., 2009).
3.3 Calibration curve for intensity variations of Raman spectrum for detecting DOX using AgNPs coated on glass fiber substrates as plasmonic sensors
The Raman spectrum of glass fiber substrates, the Raman spectrum of 10−1 M DOX deposited on glass fiber substrates, and the SERS spectrum of 10−1 M DOX deposited on SAS are presented in Fig. 3-A. In the Raman spectrum of the DOX deposited on glass fiber substrates (blue curve), there are no molecular vibrations related to DOX. Thus, in practice, the detection of these chemicals, even in the concentration of 10−1 M and using Raman spectroscopy, is significantly difficult and somehow impossible. Molecular vibrations of DOX appear by depositing 10−1 M DOX on the SAS. Molecular vibrations of DOX are indicated as dashed lines (Gautier et al., 2013) on the spectra of the DOX in Fig. 3-A. In the case of DOX deposited on the SAS, Ring stretch CO, Ring stretch C = O, Skeletal deformation, Skeletal deformation, Skeletal deformation, Skeletal deformation, Ring stretch HO, Skeletal deformation, Ring stretch symmetry A1 + Ring stretch OH, Ring stretch symmetry B1 + Ring stretch OH, Ring stretch CO, Ring stretch CC-O, Ring stretch C = O, Ring stretch C = O appear at Raman signals of 439 cm−1, 507 cm−1, 608 cm−1, 770 cm−1, 878 cm−1, 916 cm−1, 1007 cm−1, 1081 cm−1, 1208 cm−1, 1243 cm−1, 1297 cm−1, 1440 cm−1, 1573 cm−1, and 1640 cm−1, respectively. Raman signal is enhanced because of employing SAS due to light scattering from roughness spots. The Raman signals of the larger silver particles observed in Fig. 2-C are enhanced by scattering the incident laser light and reaching the scattered light to the DOX. The surface plasmon resonance of smaller silver particles, or similarly, the strong electric fields around these nanoparticles, is another cause for the enhancement of the Raman signal, in addition to the scattering of light from larger silver particles. Fig. 2-(C) illustrates that the AgNPs behave as optical lenses, concentrating incident laser light around themselves. As a result, the electric field's intensity rises near the nanoparticles. The nanoparticles are exposed to a higher electric field intensity and become more polarized when the DOX is placed around them; therefore, their molecular vibrations are enhanced, and stronger signals are generated (Chen et al., 2015; Granger et al., 2016).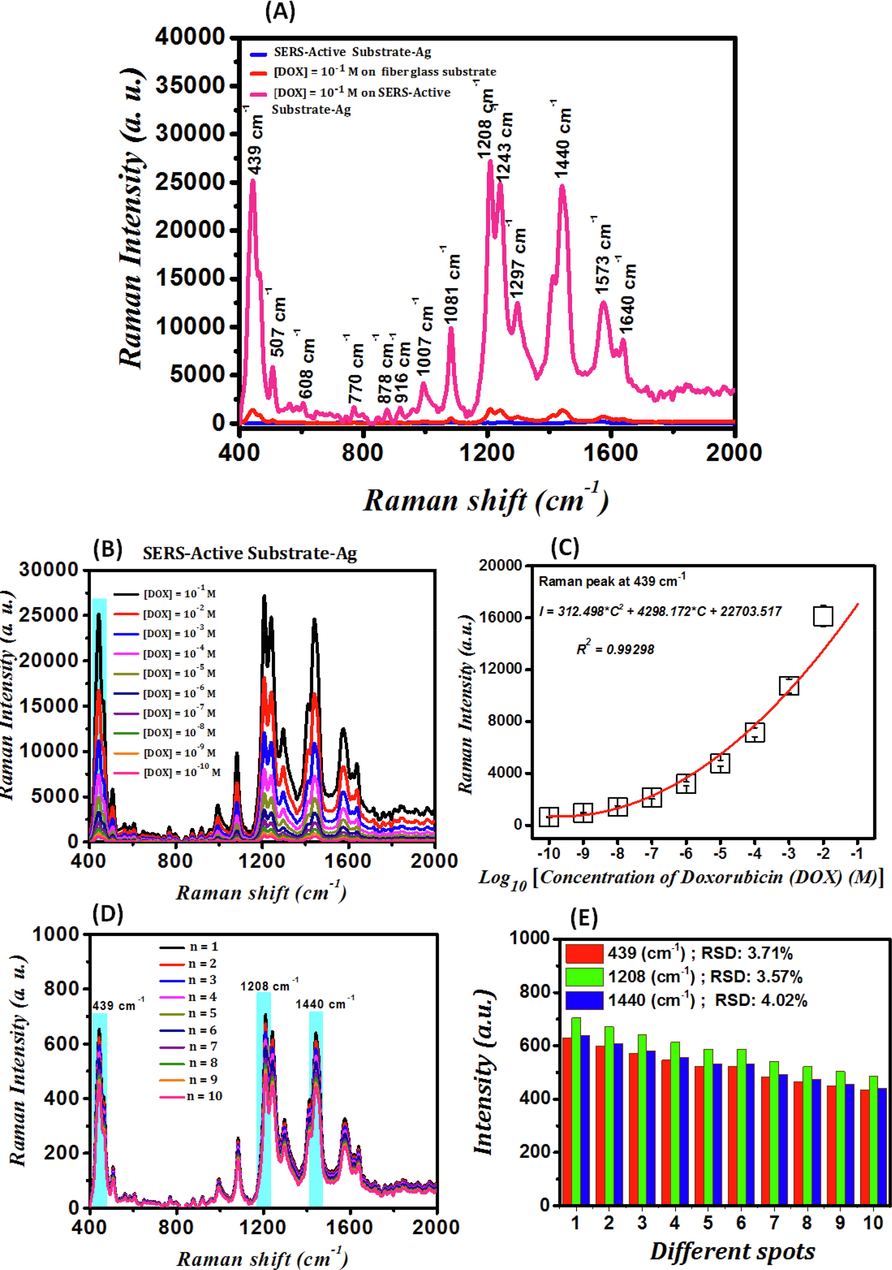
(A)- Raman spectrum of glass fiber substrates (blue curve), the Raman spectrum of 10−1 M DOX deposited on glass fiber substrates (red curve), and the SERS spectrum of 10−1 M DOX deposited on SAS (pink curve); (B)- SERS spectra of DOX detected by SAS at different concentrations; (C)- Calibration curve of intensity variations (I) of the SERS signal related to Ring stretch C-O at the wavenumber of 439 cm−1 in logarithmic changes of DOX concentration (C); (D)- SERS spectra of 10 distinct spots of 10 μL of the 10−10 M DOX deposited on the SAS and the variations diagram for the ten continuous experiments for 10−10 M DOX drug; (E)- Bar charts of the variations in the calculation of RSD for the peaks at 439 cm−1 (red diagram), 1208 cm−1 (green diagram), and 1440 cm−1 (blue diagram).
The SERS spectra of DOX detected by SAS at concentrations of 10−1 M, 10−2 M, 10−3 M, 10−4 M, 10−5 M, 10−6 M, 10−7 M, 10−8 M, 10−9 M, and 10−10 M are indicated in Fig. 3-(B). The intensity of the DOX drug's peak molecular vibrations decreases as its concentration decreases, which is attributed to the reduction in the number of its molecules, and therefore the number of its molecular vibrations so that the DOX drug's vibrations are not easily visible at concentrations lower than 10−10 M. Hence, the SAS is sensitive enough to detect DOX at concentrations as low as 10−10 M. The calibration curve of intensity variations (I) of the SERS signal related to Ring stretch C-O at the wavenumber of 439 cm−1 in logarithmic changes of DOX concentration (C) is indicated in Fig. 3-(C) and follows the fitting by Eq. (2).
Ten continuous experiments were conducted on the 10−10 M DOX over one day to achieve the repeatability of the fabrication of SAS. The SERS spectra of 10 distinct spots of 10 μL of the 10−10 M DOX deposited on the SAS are shown in Fig. 3-(D). At a concentration of 10−10 M, all SERS spectra of the DOX drug are well-matched, and the position and characteristics of the spectra do not change. Eq. (3) was used to calculate the relative standard deviation (RSD) to assess the repeatability of SAS fabrication at a concentration of 10−10 M of DOX drug and for the peaks at 439 cm−1, 1208 cm−1, and 1440 cm−1 (Granger et al., 2016).
3.4 Calibration curve of area under the curve of intensity variations of Raman spectrum for detecting DOX using AgNPs coated on glass fiber substrates as plasmonic sensors
The SERS spectra of DOX at concentrations of 10−1 M, 10−2 M, 10−3 M, 10−4 M, 10−5 M, 10−6 M, 10−7 M, 10−8 M, 10−9 M, and 10−10 M detected by SAS plasmonic sponsors are shown in Fig. 4-(A). Moreover, the calibration curve of intensity variations (I), including the area under the curve of the SERS signal related to molecular vibrations at the wavenumbers ranging from 400 cm−1 to 478 cm−1 in logarithmic changes of the concentration of DOX (C) on SAS, which is extracted from Fig. 4-(A), is shown in Fig. 4-(B). The SERS spectra demonstrated in Fig. 4-(A) for DOX at concentrations of 10−1 M, 10−2 M, 10−3 M, 10−4 M, 10−5 M, 10−6 M, 10−7 M, 10−8 M, 10−9 M, and 10−10 M deposited on AgNPs coated on glass fiber substrates as plasmonic sensors are presented with the areas under the curve calculated by Arean software for Fig. 4-(C),4-(D), 4-(E), 4-(F), 4-(G), 4-(H), 4-(I), 4-(J), 4-(K), and 4-(L) to be equal to 1024482.77 cm2, 682988.55 cm2, 455325.67 cm2, 303550.45 cm2, 202366.96 cm2, 134911.31 cm2, 89940.87 cm2, 59960.58 cm2, 39973.72 cm2, 266491.14 cm2, respectively, which are represented only for the wavenumbers ranging from 400 cm−1 to 478 cm−1. By employing this diagram, it is possible to identify the concentrations of unknown amounts of DOX by observing the intensity of the peak molecular vibrations that only fall within the range of 400–478 cm−1. The intensity of the DOX drug's peak molecular vibrations decreases as its concentration decreases, which is attributed to the decrease in the number of its molecules, and therefore the number of its molecular vibrations so that the DOX drug's vibrations are not easily visible at concentrations lower than 10−10 M. Hence, the SAS is sensitive enough to detect DOX at concentrations as low as 10−10 M. The calibration curve for intensity variations (I), which includes the area under the curve of the SERS signal related to molecular vibrations at the wavenumbers ranging from 400 cm−1 to 478 cm−1 in logarithmic changes of the concentration of DOX (C) on SAS, which is extracted from Fig. 4-(A) and follows the curve fitting of Eq. (4).
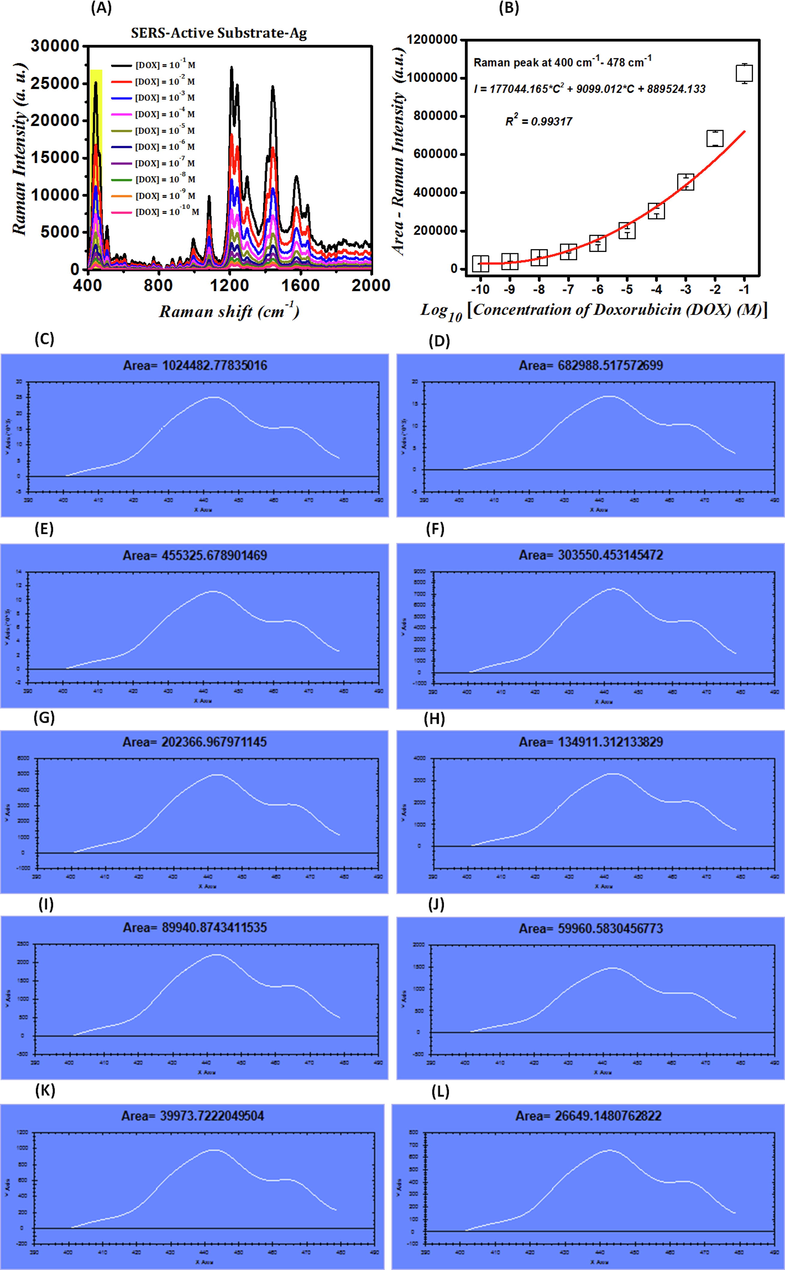
(A)- SERS spectra of DOX at different concentrations detected by SAS plasmonic sponsors; (B)- Calibration curve of intensity variations (I), including the area under the curve of the SERS signal related to molecular vibrations at the wavenumbers ranging from 400 cm−1 to 478 cm−1 in logarithmic changes of the concentration of DOX (C) on SAS; (C)-(I)- Diagrams used for calculation of areas under the curve for presenting the SERS spectra of DOX at different concentrations deposited on AgNPs coated on glass fiber substrates.
Since the objective of fabricating SAS plasmonic sensors is the detection of significantly low concentrations of DOX, the calibration curve diagram, which is presented in the current research, is extremely important. This diagram can also be employed to measure DOX concentrations by observing the intensity of peak molecular vibration in the Raman spectrum.
3.5 Calibration curve of intensity variations of Raman spectrum for detecting DOX in blood plasma using AgNPs coated on glass fiber substrates as plasmonic sensors
The SERS spectrum of blood plasma deposited on SAS, the SERS spectrum of 10−1 M DOX dissolved in DI water and deposited on SAS, and the SERS spectrum of 10−1 M DOX in blood plasma deposited on SAS are presented in Fig. 5-A. In the Raman spectrum of the DOX deposited on glass fiber substrates (blue curve), there are no molecular vibrations related to DOX. Thus, in practice, the detection of these chemicals, even in the concentration of 10−1 M and using Raman spectroscopy, is significantly difficult and somehow impossible. Molecular vibrations of DOX appear by depositing 10−1 M DOX on the SAS. Raman signal is enhanced because of employing SAS due to light scattering from roughness spots. The Raman signals of the larger silver particles observed in Fig. 2-C are enhanced by scattering the incident laser light and reaching the scattered light to the DOX, the blood plasma, and the DOX in blood plasma. The surface plasmon resonance of smaller silver particles, or similarly, the strong electric fields around these nanoparticles, is another cause for the enhancement of the Raman signal, in addition to the scattering of light from larger silver particles. Fig. 2-(C) illustrates the AgNPs behave as optical lenses, concentrating incident las er light around themselves. As a result, the electric field's intensity rises near the nanoparticles. The nanoparticles are exposed to a higher electric field intensity and become more polarized when the DOX in blood plasma is placed around them; therefore, their molecular vibrations are enhanced, and stronger signals are generated (Chen et al., 2015; Granger et al., 2016).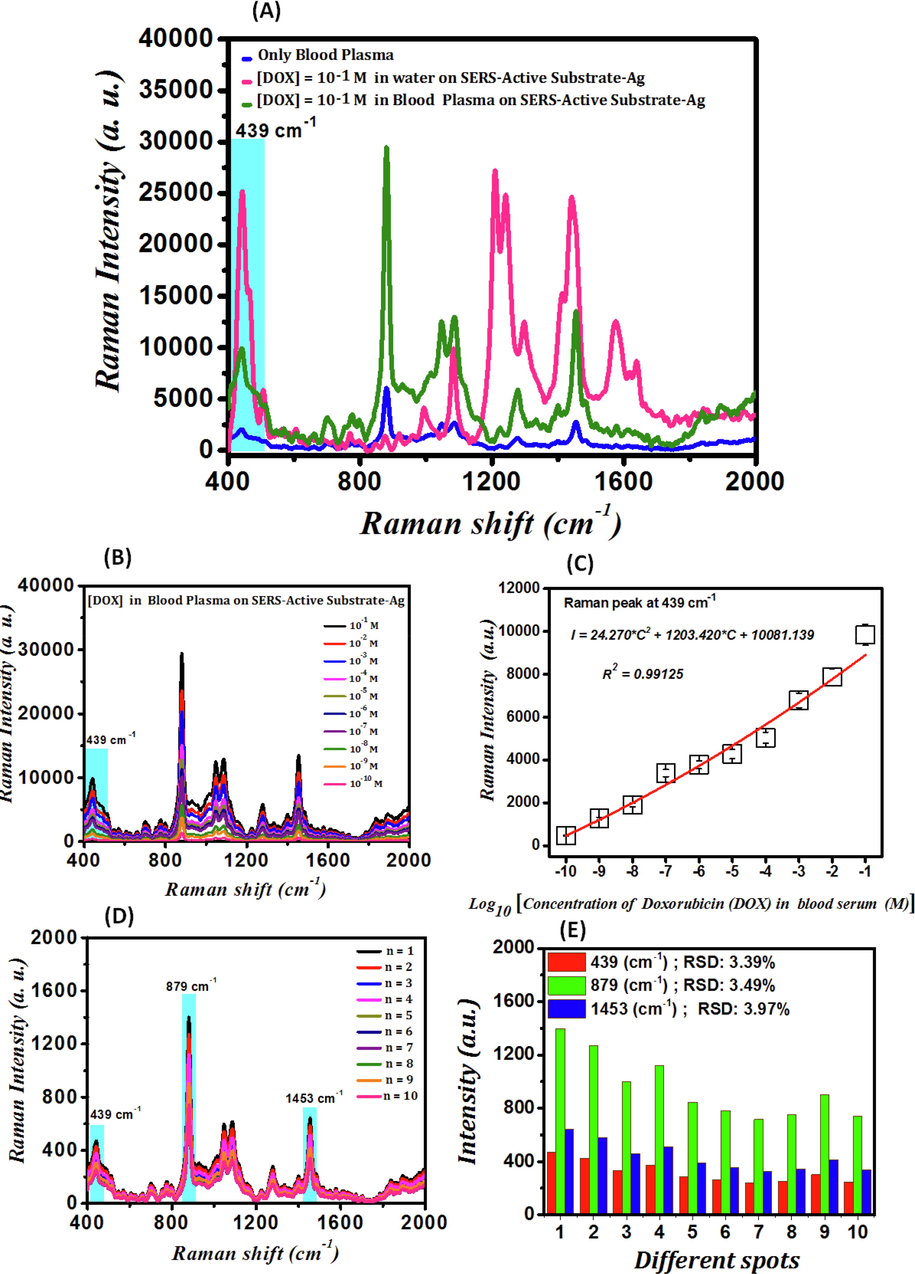
(A)- SERS spectrum of blood plasma deposited on SAS (blue curve), the SERS spectrum of 10−1 M DOX dissolved in DI water and deposited on SAS (red curve), and the SERS spectrum of 10−1 M DOX in blood plasma deposited on SAS (pink curve); (B)- SERS spectrum of DOX in blood plasma detected by SAS at different concentrations; (C)- Calibration curve of intensity variations (I) of the SERS signal related to Ring stretch C-O at the wavenumber of 439 cm−1 in logarithmic changes of DOX concentration (C); (D)- SERS spectra of 10 distinct spots of 10 μL of the 10−10 M DOX in blood plasma deposited on the SAS and the variations diagram for the 10 continuous experiments for 10−10 M DOX drug in blood plasma; (E)- Bar charts of the variations in the calculation of RSD for the peaks at 439 cm−1 (red diagram), 879 cm−1 (green diagram), and 1453 cm−1 (blue diagram).
The SERS spectra of DOX in blood plasma detected by SAS at concentrations of 10−1 M, 10−2 M, 10−3 M, 10−4 M, 10−5 M, 10−6 M, 10−7 M, 10−8 M, 10−9 M, and 10−10 M is indicated in Fig. 5-(B). The intensity of peak molecular vibrations of DOX drug in blood plasma decreases as its concentration decreases, which is attributed to the decrease in the number of its molecules, and therefore the number of its molecular vibrations so that the vibrations DOX drug in blood plasma are not easily visible at concentrations lower than 10−10 M. Hence, the SAS is sensitive enough to detect DOX in blood plasma at concentrations as low as 10−10 M. The calibration curve of intensity variations (I) of the SERS signal related to Ring stretch C-O at the wavenumber of 439 cm−1 in logarithmic changes of DOX concentration (C) is indicated in Fig. 5-(C) and follows the fitting by Eq. (5).
Ten continuous experiments were conducted on the 10−10 M DOX in blood plasma over one day to achieve the repeatability of the fabrication of SAS. The SERS spectra of 10 distinct spots of 10 μL of the 10−10 M DOX in blood plasma deposited on the SAS are shown in Fig. 5-(D). At a concentration of 10−10 M, all SERS spectra of the DOX drug in blood plasma are well-matched, and the position and characteristics of the spectra do not change. Eq. (3) was used to calculate the RSD to assess the repeatability of SAS fabrication at a concentration of 10−10 M of DOX drug in blood plasma and for the peaks at 439 cm−1, 897 cm−1, and 1453 cm−1.
In this case and regarding Eq. (3), n = 10 implies the number of tested Raman spectra, Ii denotes the Raman signal intensity at each specified peak, and I implies the average Raman signal intensity of the specified peaks. The variations diagram for the ten continuous experiments for 10−10 M DOX drug in blood plasma for the peaks at 439 cm−1, 879 cm−1, and 1453 cm−1 with the RSD values of 3.39%, 3.49%, and 3.97%, respectively, is indicated in Fig. 5-(D). Moreover, Fig. 5-(E) demonstrates the bar charts of the variations in the calculation of RSD to be 3.39% for the peak at 439 cm−1, 3.49% for the peak at 879 cm−1, and 3.97% for the peak at 1453 cm−1. The RSD obtained in this experiment was 3.61% on average, which shows that the procedure used to determine concentrations of DOX in blood plasma performs well. Fig. 5-(F) demonstrates the diagram of SERS spectrum intensity of the DOX in blood plasma adsorbed on SAS relative to the changes in the concentrations 10−1, 10−2, 10−3, 10−4, 10−5, 10−6, 10−7, 10−8, 10−9, and 10−10 M of DOX drug in blood plasma for the peaks at the wavenumbers of 439 cm−1, 879 cm−1, and 1453 cm−1. Several other methods such as electrochemical sensors (Soleymani et al., 2017), the spectrophotometric method (Eman and El-Yazbi, 2016), mass spectrometry/liquid chromatography mass spectrometry (MS/LC-MS) (Ibsen et al., 2013), high-performance liquid chromatography (HPLC) (Daeihamed et al., 2015), etc. are employed for determining the amount of DOX in blood plasma. However, they are not cost-effective, sometimes provide low limits of detection, and require complicated sample preparation procedures and a significant amount of time to decompose the samples.
3.6 Calibration curve of area under the curve of intensity variations of Raman spectrum for detecting DOX in blood plasma using AgNPs coated on glass fiber substrates as plasmonic sensors
The SERS spectra of DOX drug in blood plasma at concentrations of 10−1 M, 10−2 M, 10−3 M, 10−4 M, 10−5 M, 10−6 M, 10−7 M, 10−8 M, 10−9 M, and 10−10 M detected by SAS plasmonic sponsors are shown in Fig. 6-(A). Moreover, the calibration curve of intensity variations (I), including the area under the curve of the SERS signal related to molecular vibrations at the wavenumbers ranging from 400 cm−1 to 478 cm−1 in logarithmic changes of the concentration of DOX in blood plasma (C) on SAS, which is extracted from Fig. 6-(A), is shown in Fig. 6-(B). The SERS spectra demonstrated in Fig. 6-(A) for DOX in blood plasma at concentrations of 10−1 M, 10−2 M, 10−3 M, 10−4 M, 10−5 M, 10−6 M, 10−7 M, 10−8 M, 10−9 M, and 10−10 M deposited on AgNPs coated on glass fiber substrates as plasmonic sensors are presented with the areas under the curve calculated by Arean software for Fig. 6-(C),6-(D), 6-(E), 6-(F), 6-(G), 6-(H), 6-(I), 6-(J), 6-(K), and 4-(L) to be equal to 560703.81 cm2, 448563.05 cm2, 386692.28 cm2, 287540.41 cm2, 243784.26 cm2, 215655.31 cm2, 193346.14 cm2, 108832.26 cm2, 72414.28 cm2, 26699.26 cm2, respectively, which are represented only in the range of 400–478 cm−1. By using this diagram, it is possible to identify the concentrations of unknown amounts of DOX in blood plasma by observing the intensity of the peak molecular vibrations that only fall within the range of 400–478 cm−1. The intensity of peak molecular vibrations of DOX in blood plasma decreases as its concentration decreases, which is attributed to the decrease in the number of its molecules and therefore the number of its molecular vibrations so that the vibrations of DOX drug in blood plasma are not easily visible at concentrations lower than 10−10 M. Hence, the SAS is sensitive enough to detect DOX drug in blood plasma at concentrations as low as 10−10 M. The calibration curve for intensity variations (I), which includes the area under the curve of the SERS signal related to molecular vibrations at the wavenumbers ranging from 400 cm−1 to 478 cm−1 in logarithmic changes of the concentration of DOX in blood plasma (C) on SAS, which is extracted from Fig. 6-(A) and follows the curve fitting of Eq. (6).
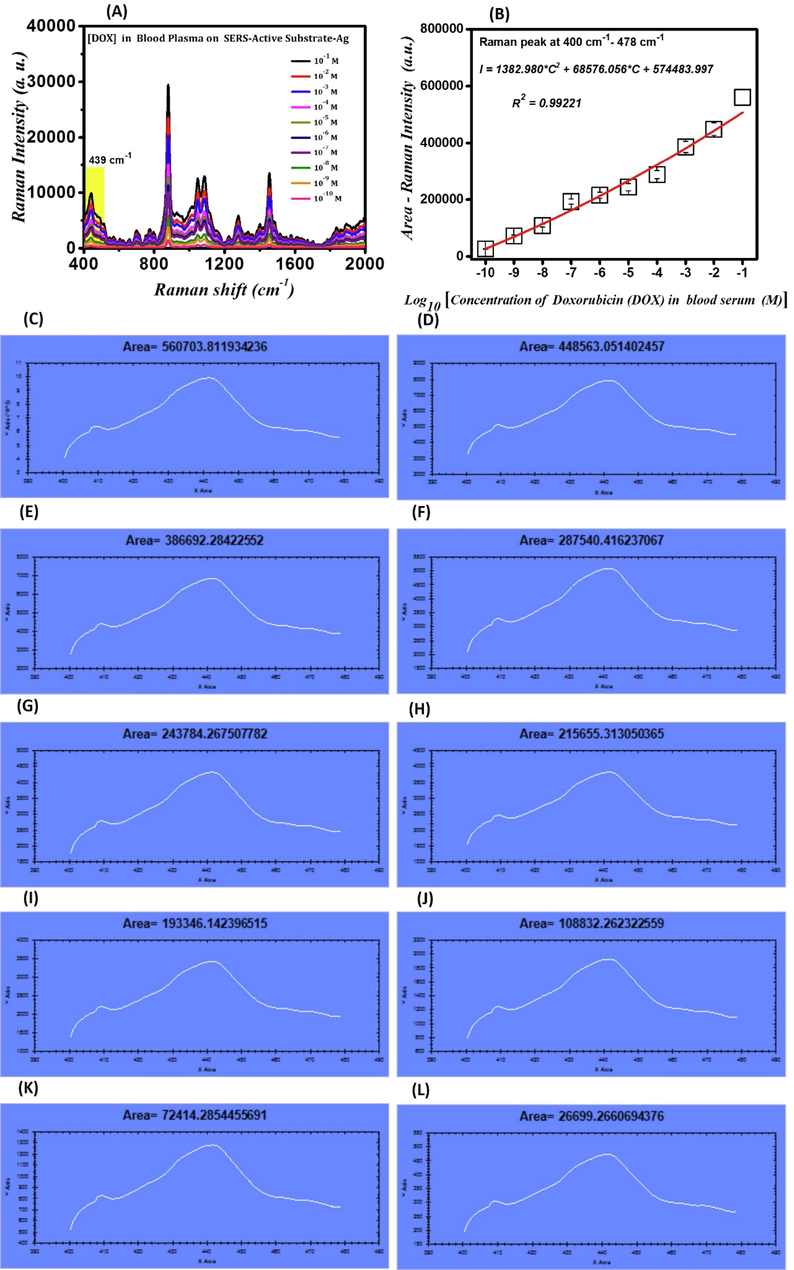
(A)- SERS spectra of DOX in blood plasma at concentrations detected by SAS plasmonic sponsors; (B)- Calibration curve of intensity variations (I), including the area under the curve of the SERS signal related to molecular vibrations at the wavenumbers ranging from 400 cm−1 to 478 cm−1 in logarithmic changes of the concentration of DOX in blood plasma (C) on SAS; (C)-(I)- Diagrams used for calculation of areas under the curve for presenting the SERS spectra of DOX in blood plasma at different concentrations deposited on AgNPs coated on glass fiber substrates.
Since the objective of fabricating SAS plasmonic sensors is the detection of significantly low concentrations of DOX in blood plasma, the calibration curve diagram, which is presented in the current research, is extremely important. This diagram can also be employed to measure the concentrations of DOX in blood plasma by observing the intensity of peak molecular vibration in the Raman spectrum.
3.7 Calculation of enhancement factor
3.7.1 Experimental results
After depositing AgNPs on glass fiber substrates, the improvement of DOX molecular vibrations can be seen in the SERS plasmonic biosensor. By calculating the EF, these substrates made of AgNPs have been investigated. The following equation has been applied to calculate the EF (Liyanage et al., 2020):
3.7.2 FDTD simulation results
As described in Section 2.2, three spherical AgNPs of diameters 80 nm with a distance of 60 nm from together, deposited on the glass substrate, were modeled, and then the DOX analyte was added to the substrate coated with AgNPs. Afterward, an optical source or laser was applied to the modeled substrate to simulate the SERS effect and investigate the electric field distribution as well as EF. The schematic of this model is illustrated in Fig. 7-(A). The EF was calculated using a standard equation as |Eloc/E0|4, where Eloc is the local maximum electric field and E0 is the amplitude of the input source electric field (here, E0 is equal to 1) (Li et al., 2011). The value of the calculated EF was equal to 24.95 × 10³ which was in line with the value calculated by the experimental method. The electric field distribution, intensity in the XZ plane, and E4 in the XZ plane are presented in Fig. 7-(B), Fig. 7-(C), and Fig. 7-(D), respectively. Moreover, a simulated video of electric field distribution around the modeled substrate is presented as Video S1 in the supplementary information.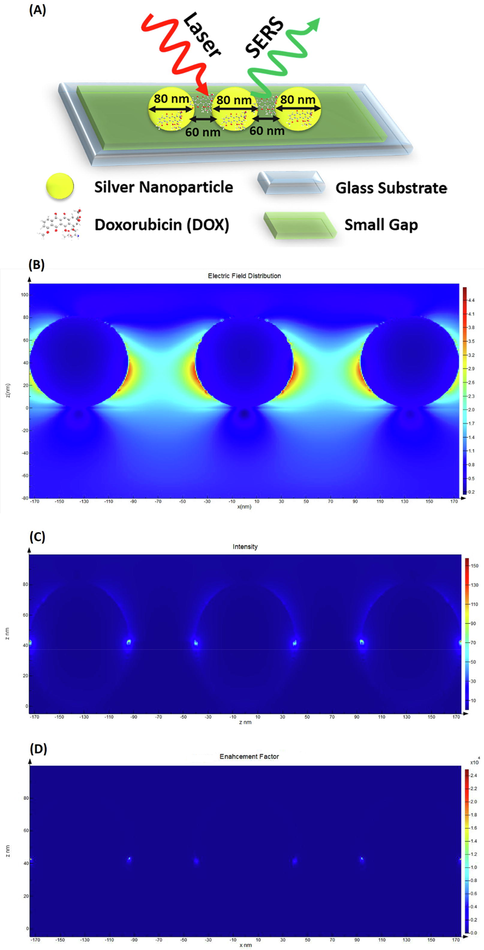
(A)- Schematic of the modeled SERS-active substrate coated with AgNPs; (B)- Electric field distribution; (C)- Intensity in the XZ plane; (D)- Enhancement factor calculated as E4 in the XZ plane.
4 Conclusion
The detection of DOX is significantly important to diagnose and control various diseases caused by this drug. Molecular detection using Raman spectroscopy is a non-destructive technique that is difficult to use at low concentrations due to the weak Raman signal. Surface plasmon resonance of metal nanoparticles, including AgNPs and scattering light from large metal particles, can increase this signal. First, a chemical reduction technique was used to fabricate AgNPs. Then, using a simple, fast, and cost-effective chemical process, AgNPs were deposited on glass fiber substrates, and these substrates were utilized as SAS to detect DOX. Due to the surface plasmon resonance of nanoparticles deposited on the surface of glass fiber substrates by the chemical technique, the Raman signal of all samples is enhanced when various concentrations of DOX are deposited on SAS. These nanoparticles receive the incident laser light and focus the light in a small area around themselves; hence, the DOX becomes more polarized and vibrates more strongly as a result of receiving a stronger electric field. By observing the plasmonic peaks of SAS, AgNPs deposited on glass fiber substrates or in the form of aqueous phase colloidal solutions respectively prepared at 430 nm and 418 nm, it was confirmed that the AgNPs were deposited on glass fiber substrates. The presence of AgNPs deposited on glass fiber substrates was confirmed by observing the FE-SEM images, and the SAS roughness, which was resulted from the non-uniform morphologies of AgNPs, led to the light scattering from the points observed in these images. The roughness of SAS observed in the FE-SEM images plays a role in scattering light from roughness spots. The fabrication of SAS in the form of deposited on glass fiber substrates was performed to detect DOX in and out of the blood plasma, and the limit of detection of both was equal to 10−10 M. Furthermore, the RSD for ten repeated measurements and the SAS, AgNPs deposited on glass fiber substrates, were obtained to be 3.76% and 3.61% for detecting the DOX drug at a concentration of 10−10 M and the DOX drug in blood plasma at a concentration of 10−10 M, respectively. Accordingly, the achieved Raman results show that SAS provides excellent results for SERS-based investigations with the developed approaches for detecting DOX and also has the potential to contribute to the development of microsensors. The capability to quickly detect low concentrations, ease-of-use, repeatability, selectivity, sensitivity, and high detection speed are some advantages of these SERS-active substrates. Furthermore, the manufacturing of these substrates is inexpensive, and they can be utilized to detect a wide range of pathogens in foods, biomaterials, and chemicals.
Moreover, the calculated enhancement factor through experimental and simulation approaches indicated that the developed substrates could enhance the Raman signals by the calculated values (29.76 × 10³ via the experimental method and 24.95 × 10³ by simulation method) and were considered as SERS-active substrates for the present study. Furthermore, these substrates can also be employed as appropriate SERS biosensors for future investigations.
Declaration of Competing Interest
The authors declare that they have no known competing financial interests or personal relationships that could have appeared to influence the work reported in this paper.
References
- Mechanochemical activation and patterning of an adhesive surface toward nanoparticle deposition. J. Am. Chem. Soc.. 2015;137(5):1726-1729.
- [Google Scholar]
- Book-review-absorption and scattering of light by small particles. Nature. 1983;306(5943):625.
- [Google Scholar]
- Comparative SERS effectiveness of silver nanoparticles prepared by different methods: A study of the enhancement factor and the interfacial properties. J. Colloid Interface Sci.. 2008;326(1):103-109.
- [Google Scholar]
- Large-Scale Hot Spot Engineering for Quantitative SERS at the Single-Molecule Scale. J. Am. Chem. Soc.. 2015;137(42):13698-13705.
- [Google Scholar]
- Study of SERS efficiency of metallic colloidal systems. J. Phys.: Conf. Ser., IOP Publishing 2007012013
- [Google Scholar]
- A simple and sensitive HPLC method for fluorescence quantitation of doxorubicin in micro-volume plasma: applications to pharmacokinetic studies in rats. Iran. J. Pharm. Res.: IJPR. 2015;14(Suppl):33.
- [Google Scholar]
- Electromagnetic theories of surface-enhanced Raman spectroscopy. Chem. Soc. Rev.. 2017;46(13):4042-4076.
- [Google Scholar]
- Salmonella typhimurium detection using a surface-enhanced Raman scattering-based aptasensor. Int. J. Food Microbiol.. 2016;218:38-43.
- [Google Scholar]
- An eco-friendly stability-indicating spectrofluorimetric method for the determination of two anticancer stereoisomer drugs in their pharmaceutical preparations following micellar enhancement: Application to kinetic degradation studies. Spectrochim. Acta Part A Mol. Biomol. Spectrosc.. 2016;163:145-153.
- [Google Scholar]
- SERS spectroscopic approach to study doxorubicin complexes with Fe 2+ ions and drug release from SPION-based nanocarriers. Analyst. 2013;138(24):7354-7361.
- [Google Scholar]
- The pH partition theory predicts the accumulation and toxicity of doxorubicin in normal and low-pH-adapted cells. Br. J. Cancer. 1999;79(5):838-842.
- [Google Scholar]
- Prospects for point-of-care pathogen diagnostics using surface-enhanced Raman scattering (SERS) Chem. Soc. Rev.. 2016;45(14):3865-3882.
- [Google Scholar]
- Extraction protocol and mass spectrometry method for quantification of doxorubicin released locally from prodrugs in tumor tissue. J. Mass Spectrom.. 2013;48(7):768-773.
- [Google Scholar]
- Surface-enhanced Raman scattering characteristics of nanogaps formed by a flat Ag substrate and spherical Pt nanoparticles. Spectrochim. Acta Part A Mol. Biomol. Spectrosc.. 2013;100:10-14.
- [Google Scholar]
- Antibacterial coating of glass fiber filters with silver nanoparticles (agnps) and glycidyltrimethylammonium chloride (GTAC) Fibers Polym.. 2018;19(10):2080-2087.
- [Google Scholar]
- Three-dimensional cavity nanoantenna coupled plasmonic nanodots for ultrahigh and uniform surface-enhanced Raman scattering over large area. Opt. Express. 2011;19(5):3925-3936.
- [Google Scholar]
- Synthesis of morphology-controlled silver nanostructures by electrodeposition. Nano-Micro Lett.. 2010;2(1):6-10.
- [Google Scholar]
- Optimization of electromagnetic hot spots in surface-enhanced Raman scattering substrates for an ultrasensitive drug assay of emergency department patients’ plasma. Analyst. 2020;145(23):7662-7672.
- [Google Scholar]
- Bactericidal activity of Ag nanoparticle-impregnated fibreglass for water disinfection. J. Water Health. 2009;7(4):657-663.
- [Google Scholar]
- Determination of gold nanoparticles sizes via surface plasmon resonance. IOSR J. Appl. Chem. (IOSR-JAC. 2018;11(7):25-29.
- [Google Scholar]
- Bulk cure study of nanoclay filled epoxy glass fiber reinforced composite material. J. Polym. Eng.. 2017;37(3):247-259.
- [Google Scholar]
- Electrochemical sensing of doxorubicin in unprocessed whole blood, cell lysate, and human plasma samples using thin film of poly-arginine modified glassy carbon electrode. Mater. Sci. Eng., C. 2017;77:790-802.
- [Google Scholar]
- Electrohydrodynamically enhanced drying droplets for concentration of Salmonella bacteria prior to their detections using antibody-functionalized SERS-reporter submicron beads. Sens. Actuators, B. 2019;283:384-389.
- [Google Scholar]
- Hierarchical zwitterionic modification of a SERS substrate enables real-time drug monitoring in blood plasma. Nat. Commun.. 2016;7(1):1-9.
- [Google Scholar]
- IR-SERS study and theoretical analogue on the adsorption behavior of pyridine carboxylic acid on silver nanoparticles. Spectrochim. Acta Part A Mol. Biomol. Spectrosc.. 2006;63(3):614-618.
- [Google Scholar]
- Magnetic plasmonic particles for SERS-based bacteria sensing: A review. AIP Adv.. 2019;9(1):010701
- [Google Scholar]
- Synthesis and characterization of stable aqueous dispersions of silver nanoparticles through the Tollens process. J. Mater. Chem.. 2002;12(3):522-527.
- [Google Scholar]
- Electrochemical deposition of high density gold nanoparticles on indium/tin oxide electrode for fabrication of biosensors. J. Nanosci. Nanotechnol.. 2011;11(12):11084-11088.
- [Google Scholar]
- Recent advances in surface-enhanced raman spectroscopy (SERS): Finite-difference time-domain (FDTD) method for SERS and sensing applications. TrAC, Trends Anal. Chem.. 2016;75:162-173.
- [Google Scholar]
- Self-assembly of large-scale and ultrathin silver nanoplate films with tunable plasmon resonance properties. ACS Nano. 2011;5(11):9082-9092.
- [Google Scholar]
- SERS detection of bacteria in water by in situ coating with Ag nanoparticles. Anal. Chem.. 2014;86(3):1525-1533.
- [Google Scholar]
- Self-assembled Ag nanoparticles for surface enhanced Raman scattering. Opt. Rev.. 2013;20(5):361-366.
- [Google Scholar]
Appendix A
Supplementary material
Supplementary data to this article can be found online at https://doi.org/10.1016/j.arabjc.2022.104005.
Appendix A
Supplementary material
The following are the Supplementary data to this article:Supplementary video 1
Supplementary video 1


