

Translate this page into:
Cockle shell-derived nanoparticles for optical urea biosensor development based on reflectance transduction
⁎Corresponding author at: Faculty of Bioengineering and Technology, Universiti Malaysia Kelantan, Jeli Campus, 17600 Jeli, Kelantan, Malaysia. rosmawani@umk.edu.my (Rosmawani Mohammad)
-
Received: ,
Accepted: ,
This article was originally published by Elsevier and was migrated to Scientific Scholar after the change of Publisher.
Peer review under responsibility of King Saud University.
Abstract
An optical biosensor for urea based on urease enzyme immobilised on functionalised calcium carbonate nanoparticles (CaCO3-NPs) was successfully developed in this study. CaCO3-NPs were synthesised from discarded cockle shells via a simple and eco-friendly approach, followed by surface functionalisation with succinimide ester groups. The fabricated biosensor is comprised of two layers. The first (bottom layer) contained functionalised NPs covalently immobilised to urease, and the second (uppermost layer) was alginate hydrogel physically immobilised to the pH indicator phenolphthalein. The biosensor provided a colorimetric indication of increasing urea concentrations by changing from colourless to pink. Quantitative urea analysis was performed by measuring the reflectance intensity of the colour change at a wavelength of 633.16 nm. The determination of urea concentration using this biosensor yielded a linear response range of 30–1000 mM (R2 = 0.9901) with a detection limit of 17.74 mM at pH 7.5. The relative standard deviation of reproducibility was 1.14%, with no signs of interference by major cations, such as K+, Na+, NH₄+, and Mg2+. The fabricated biosensor showed no significant difference with the standard method for the determination of urea in urine samples.
Keywords
Calcium carbonate nanoparticles
Optical biosensor
pH-sensitive
Urea
Urease immobilisation

1 Introduction
Urea is a nitrogenous compound also known as carbamide in standard chemistry nomenclature. It is composed of two NH₂ functional groups bonded to a carbonyl (CO) group. Although commonly found in human serum, urea is majorly present in urine as a waste product of protein metabolism. This process first entails the breaking down of amino acids into ammonia (NH3), carbon dioxide (CO₂), water, and energy. However, NH3 is toxic to cells and needs to be excreted from the body. Subsequently, NH3 is converted by the liver and the kidney into non-toxic urea (CH₄N₂O), after which it can be safely removed from the body in urine (Jakhar & Pundir, 2018). Generally, the normal concentrations of urea in urine and serum of a healthy person are 166.5–416 mM and 2.5–7.5 mM, respectively (Jakhar & Pundir, 2018; Mukanova et al., 2018, Nall, 2018). The normal urea concentration varies depending on age (Mukanova et al., 2018). Reduction of urea excretion may be caused by either acute kidney injury or chronic kidney disease, in which the kidney ceases to function normally and cannot filter urea waste. Consequently, the waste will accumulate in blood vessels and the urea concentration in serum will increase (Higgins, 2016). Mukanova et al. (2018) reported that the pathophysiological level range between 30 and 150 mM indicated a loss of kidney function. Hence, the development of a sensitive, specific, and non-invasive method for monitoring urea levels in the body is of utmost importance.
Over the past several decades, laboratory tests and conventional techniques have been utilised to measure urea concentrations, including gas chromatography, spectrophotometry, and colourimetry. However, the main drawbacks of these techniques are their requirements for costly equipment and skilled technical staff, as well as being time-consuming (Jakhar & Pundir, 2018; Wan Khalid et al., 2018). In more recent years, biosensors have been introduced as a potential solution to these problems. The use of biosensors can reduce costs and biosensors can also be applied in an in-situ test to provide patients with their urea test results almost immediately (Altintas, 2017). Moreover, biosensors can reduce the amount of sample needed from a macro- to a micro-scale without compromising the sensitivity and accuracy expected from conventional methods (Bhalla et al., 2016).
Presently, the demand for urease-based biosensors has increased. This is mainly due to their excellent selectivity, a characteristic that originated from the specificity of its mechanism. As an enzyme, urease is subject to the lock-and-key theory, which will only interact with urea to form ammonium, bicarbonate, and hydroxide ions (see Equation (1)). The enzymatic reaction leads to an alkaline pH change, which can be detected, for example, using a pH electrode (Ivanova et al., 2013) or pH indicator (Alqasaimeh et al., 2014; Erfkamp et al., 2019). Most pH electrodes are applied in electrochemical sensors, whereas pH indicators are utilised in optical sensors. An increasing amount of literature can be found discussing the application of various materials and methods for immobilising urease during the fabrication of urea biosensors. For example, zeolitic imidazolate framework (Zhu et al., 2020), gold nanoparticles (Korkut et al., 2019; Senel et al., 2019), quantum dots (Safitri et al., 2017), polymers (Das & Yoon, 2015; Meibodi & Haghjoo, 2014; Ramesh et al., 2015), and electrochromic properties of Prussian blue (Valiūnienė et al., 2019). However, many of these materials are expensive and not environmentally friendly.
Four techniques have been widely employed to immobilise the enzyme, namely adsorption, cross-linking, encapsulation, and covalent chemical bonding, and each technique has its advantages and disadvantages. Physical adsorption or physisorption on the support is the simplest method, yet it suffers from uncontrolled leaching or enzyme desorption. Cross-linking is effective although expensive, and the technique may also decrease enzymatic activity. Meanwhile, the encapsulation method limits the diffusion of the immobilised enzyme through the system, eventually hindering reactivity by preventing the substrate from accessing the enzyme's active sites.
Covalent chemical bonding involves the formation of a chemical bond between an enzyme and carboxyl or amine groups on the surface of the supporting matrix. In the production of urease-based biosensors, this method is preferred because the enzyme can be immobilised at a low cost in a biocompatible and eco-friendly manner. Additionally, the immobilisation of urease by direct bonding to the support creates a stronger attachment between the two components of the biosensor (Ahuja et al., 2008; Tamaddon & Arab, 2019).
In this work, a simple and sustainably-sourced biosensor was developed. Calcium carbonate nanoparticles (CaCO3-NPs) were first synthesised from cockle shell waste through physical and mechanical processes with no additional chemicals. The CaCO3-NPs was 78.8 ± 10.8 nm in size which have been measured using Particle Size Analyser as reported in our previous work (Zakaria et al., 2021). CaCO3 from cockle shells possesses structural porosity, a large surface area, and functional group endings for electrostatic ionic bonds with high loading capacity (Mailafiya et al., 2019). The compound has a great potential to load enzymes. In a previous study, approximately 85% of urease enzyme was covalently immobilised on CaCO3-NPs of cockle shells, where the NPs could be applied in urea biosensors (Zakaria et al., 2021). Furthermore, the white-coloured CaCO3-NPs are suitable for reflectance measurement as there is no disruption in colour changes as an indicator for optical biosensors. Moreover, the source of matrix used can also reduce environmental pollution as the shells are regarded as waste after consumption. Re-using the biowaste of cockle shells could help reduce the amount of waste generated and give an added value to food waste (Mo et al., 2018).
In the functionalisation step, acrylic acid N-hydroxysuccinimide ester was applied to CaCO3-NPs. This approach provides the surface of NPs with the succinimide ester group, which can covalently bind to the amine group of urease enzyme (Zakaria et al., 2021). The crucial final step for the addition of urease is the fabrication of the enzyme-based optical biosensor for urea detection. As shown in Fig. 1, the biosensor comprises two layers. The first layer (i.e., bottom layer) contains functionalised NPs immobilised with urease (Urs/F-NPs), whereas the second layer (i.e., uppermost layer) is alginate hydrogel physically immobilised with phenolphthalein (PP) as a pH indicator (alginate/PP). Both Urs/F-NPs and immobilised PP layers are placed in a plastic case. Urea introduced to the biosensor will pass through the alginate/PP to the immobilised urease and will be hydrolysed, subsequently increasing the pH level and changing the colour of PP from colourless to pink (see Fig. 2). This change can be measured quantitatively using a reflectance spectrometer.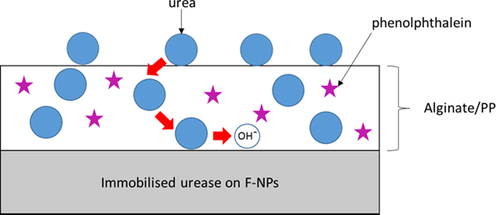
Schematic illustration of the CaCO3-NPs-based optical biosensor for urea detection.
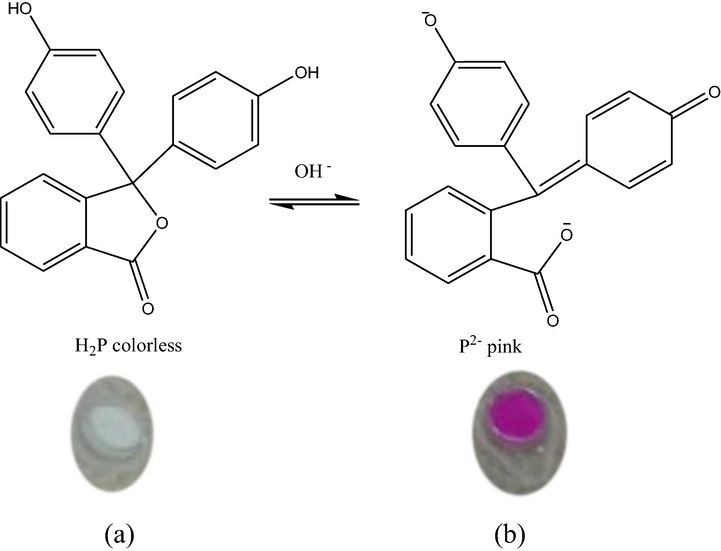
Image of an optical urea biosensor (a) before and (b) after reaction with urea.
2 Materials and methods
2.1 Chemicals
The chemicals used in this study and their respective suppliers are as follows: urease enzyme (RN 9002-13-5; 490 units/mg) from jack beans, Tokyo Chemical Industry Co.; acrylic acid N-hydroxysuccinimide ester (NAS, ≥90%), hydrochloric acid (HCl), and sodium alginate from Sigma-Aldrich; Bradford reagent, PP, and p-dimethylaminobenzaldehyde (DMAB) AR from R&M Chemicals; ethanol absolute 99.8%, potassium dihydrogen phosphate (KH₂PO₄), and dipotassium hydrogen phosphate anhydrous (K₂HPO₄) from HmbG; sodium chloride (NaCl) and potassium chloride (KCl) from Systerm; magnesium chloride (MgCl₂) from Fluka; and ammonium chloride (NH₄Cl) from Comak. All chemicals were used as supplied without any further purification. Solutions and standard buffer solutions were prepared using deionised water purified with a Milli-Q (18.5 Ω) water purification system.
2.2 Instrumentation
The main approach used in this study was reflectance spectroscopy using an Ocean Optics Mikropack DH-2000-BAL spectrometer (Dunedin, FL, USA) with an ultraviolet–visible-near infrared (NIR) light source to quantitatively measure the change of colour intensity of the fabricated sensor for optical biosensor measurement. Meanwhile, field emission scanning electron microscopy-energy dispersive X-ray (FESEM-EDX, Merlin, Zeiss), Auger electron spectroscopy-X-ray photoelectron spectroscopy (AES-XPS, Axis Ultra DLD, Kratos/Shimadzu), and Fourier transform infrared-attenuated total reflectance (FTIR-ATR, Agilent) were used to characterise the functionalised NPs and immobilised urease.
2.3 Preparation and functionalisation of CaCO3-NPs
The CaCO3-NPs produced from discarded cockle shells were prepared and functionalised according to the procedures mentioned in our previous work (Zakaria et al., 2021).
2.4 Preparation of solutions
Phosphate buffer solution (PBS) was prepared by mixing two phosphate solutions (i.e., KH₂PO₄, a weak acid, and K₂HPO₄, a conjugate base). The effect of different pH (7.0–8.5) and PBS concentrations (5–100 mM) on biosensor response was studied. The preparation of other stock solutions using optimum pH value (pH 7.5) and PBS concentration (25 mM) is described below as well as where necessary throughout the biosensor fabrication process unless otherwise stated.
Biosensor response depends on the amount of urease loading, PP, and alginate concentration. Different urease concentrations (0.1, 0.2, 0.3, 0.4, and 0.5 mg) were freshly prepared in PBS prior to biosensor fabrication. Meanwhile, solutions of different PP concentration levels (0.02–0.10 M) were prepared in ethanol. Each solution was separately mixed with 1% alginate prior to sonication to form a homogeneous hydrogel. The optimum concentration of PP was determined (0.04 M) and then applied to determine the optimum concentration of alginate. Three solutions (1%, 2%, and 3% (w/w) alginate in deionised water) were prepared using 0.04 M PP. Finally, a stock 2 M urea solution and four 100 mM ionic interference solutions of KCl, NaCl, NH₄Cl, and MgCl₂ were prepared in PBS.
2.5 Fabrication and measurement of the biosensor
An optical biosensor based on Urs/F-NPs was prepared for the express purpose of urea concentration measurement. In a fixed-sized Eppendorf tube cap (d = 5.25 ± 0.01 mm; h = 0.56 ± 0.05 mm), 20 ± 0.3 mg of dry functionalised nanoparticles (F-NPs) was dispensed into 0.3 mg of urease solution and kept at 4 °C for 24 h. The NPs were then rinsed thoroughly with PBS to remove any unbound urease and were dried again. Urease was immobilised to CaCO3-NPs via covalent chemical bonding using NAS. A homogeneous hydrogel solution was produced from the sonication of 0.04 M PP in 1% (w/w) alginate. This mixture was dispersed onto the immobilised urease and allowed to set at 4 °C for 2 h to form the uppermost layer of the biosensor.
The fibre-optic instrument used to measure colour changes was set up based on previous work (Alqasaimeh et al., 2014; Mohammad et al., 2016) with slight modifications. In this study, the standard urea solution or urine with urea was dropped onto the surface of the biosensor. The reflectance intensity of the resulting colour change was recorded after 10 min at a fixed wavelength of 633.16 nm. Changes in reflectance intensity that occurred after applying a 1000 mM urea solution to the biosensor were monitored until a constant reading was obtained. The time taken for the reaction to reach a plateau was taken as the biosensor's response time towards urea.
2.6 Shelf-life and interference ion study
The shelf-life study of the biosensor was carried out for a period of 100 days, whereby 50 units of the urea biosensor were fabricated at once and stored at 4 °C. In 2–5 day intervals, the response time of a single unit was tested using a standard 1000 mM urea solution until the biosensor response decreased.
To determine the selectivity of the optical biosensor towards urea, the interference capability of ions normally found in urine, including potassium (K+), sodium (Na+), ammonium (NH₄+), and magnesium (Mg2+) was studied under optimum conditions (Ali et al., 2011). Briefly, 100 mM solutions of K+, Na+, NH₄+, or Mg2+ ions were separately applied onto the biosensor.
2.7 Analysis of urine sample
To demonstrate the feasibility of the biosensor for urea analysis, a urine sample was collected from a healthy woman and analysed. The sample was diluted to a ratio of 1:10 (v/v) in PBS to reduce the possibility of colour disruption during the analysis due to the inherently acidic pH of urine (Ulianas et al., 2011, Chaudhari et al., 2017). The urea in the urine sample was detected using two methods: the fabricated biosensor and the standard non-enzymatic method using DMAB (Giraldo & Rivas, 2017). Approximately 1.6 g of DMAB was dissolved in 100 mL ethyl alcohol prior to the addition of 1.0 mL concentrated HCl. A range of urea solutions (35.0–58.0 mM in concentration) was prepared, and each solution was spiked into 0.1 mL of urine and 1.0 mL of DMAB. These mixtures were left to react for 30 min before measuring their absorbance at a wavelength of 436 nm. The values obtained were used to construct a calibration curve. The percentage of urea recovery from urea-spiked urine samples by the biosensor was calculated using Equation (2):
Where Cs is the concentration of urea in a urea-spiked sample as determined by the biosensor and C is the actual concentration of urea (Alqasaimeh et al., 2007). To further validate the performance of the biosensor, the percentage of urea recovery was compared to that achieved using the standard method.
3 Results and discussion
3.1 Characterisation of urease immobilised on CaCO3-NPs
The steps involved in the immobilisation of urease enzyme onto the surface of functionalised CaCO3-NPs are shown in Fig. 3. NAS provides the succinimide ester bonds required to covalently link urease onto the surface (Zakaria et al., 2021). A field emission scanning electron microscope captured the state of F-NPs before and after the addition of urease enzyme, as presented in Fig. 4. Initially, the F-NPs had a smooth morphology (Fig. 4(a)). By the end of the urease immobilisation process, its surface morphed into a clumpy, sticky, and aggregate-rich structure (Fig. 4 (b)). This confirms the existence of covalent bonding between the urease enzyme and the F-NP matrix.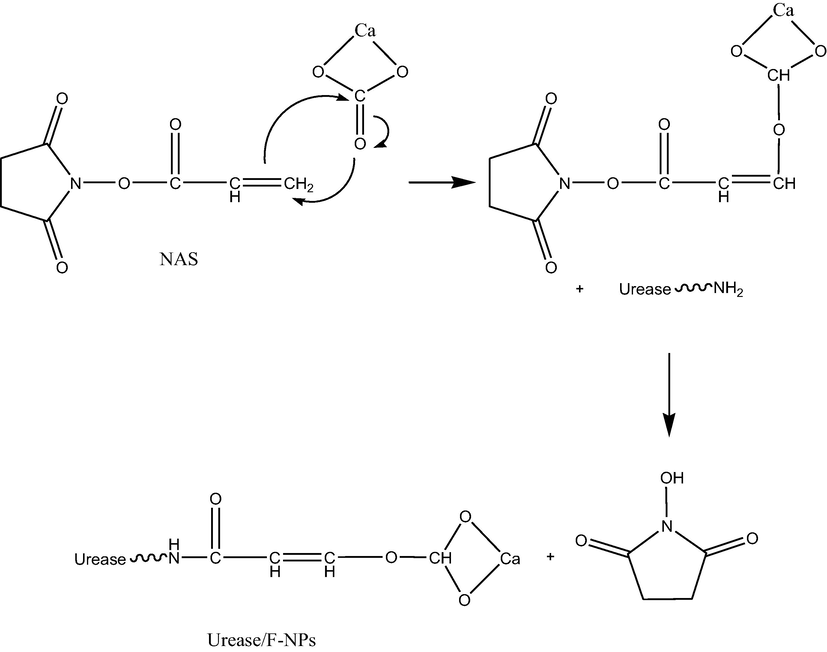
The reaction mechanism of CaCO3-NPs functionalisation and urease immobilisation.
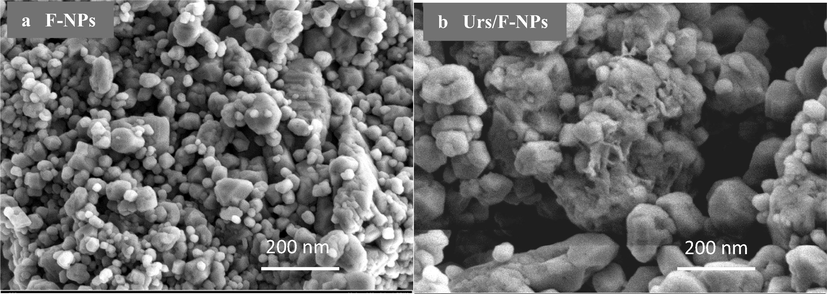
FESEM images of (a) F-NPs and (b) immobilised urease on the surface of F-NPs.
An XPS analysis performed in our previous study (Zakaria et al., 2021) examined the chemical bonds linking urease to the surface of F-NPs. Two prominent peaks detected between 100 and 200 eV after immobilisation were assigned as phosphate (P) and sulphur (S) elements, respectively. The presence of phosphate groups on the jack bean active sites of the urease enzyme was proven by the appearance of the P peak at 131 eV, which was absent before immobilisation. Moreover, the S peak present at ∼170 eV is consistent in amplitude to that of sulphur bonds in enzymes (Adeloju et al., 1993; Balasubramanian & Ponnuraj, 2010; Zakaria et al., 2021).
Furthermore, the FTIR results also showed that CaCO3-NPs were functionalised by an amide group, whereby the absorption of N-H stretching was observed at 3368 cm−1 and 1647 cm_1. Next, the F-NPs had successfully immobilised with urease through covalent bonding, as confirmed from the peaks that appeared at 1120 cm_1 and 1016.63 cm_1 (Zakaria et al., 2021). Souza et al. (2013) previously reported similar peaks, in which each peak indicated the presence of a C-N group of aliphatic amine and an amide bond in the immobilised urease, respectively.
3.2 Reaction mechanism
Urease was immobilised on the cockle shell-derived F-NPs via covalent bonding, whereas PP was physically attached to alginate to allow its application as a pH indicator in the developed urea biosensor. The formation of OH_ ions from urea hydrolysis leads to the deprotonation of PP, thereby changing its colour. The intensity at which the colour change from colourless to pink was detected by a reflectance spectrophotometer at a wavelength of 633.16 nm. This wavelength was chosen as it could effectively capture the largest differences between two reflectance spectra, before (Fig. 5(a)) and after the reaction with urea (Fig. 5(b)). The biosensor gradually changed from light to darker pink as the urea concentration increased. The pink hue produced by immobilised PP could be in a darker background, reducing the reflectance intensity. This observation is supported by Alqasaimeh et al. (2014), even with a chromoionophore indicator integrated into the fabricated optical urea biosensor rather than PP. Our results showed that in a reflectance mode, the colour intensity produced is to be considered instead of the actual colour (Mohammad et al., 2016).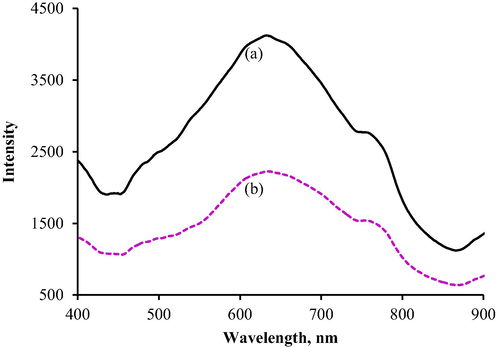
Reflectance intensity spectra (a) before and (b) after reaction with urea.
3.3 Biosensor optimisation
3.3.1 Effect of pH and concentration of buffer solutions
Based on Fig. 6, the reflectance intensity readings increased from pH 7 to 7.5 and reduced afterwards. The maximum biosensor response was obtained at pH 7.5, where the immobilised urease was fairly stable. In such a state, the enzyme's active site becomes inaccessible to the H₂PO₄_ ions found in PBS. Consequently, urease activity is limited only towards the hydrolysis of urea, leading to the increased rate of enzymatic reaction (Krajewska & Zaborska, 1999). In addition, the rapid protonation of histidine at pH levels higher than 7.5 creates a greater electrostatic force potential within the system, increasing the mobility of inhibitors and also their access to the active site of urease (Ulianas et al., 2011). Furthermore, both lower and higher pH values could prevent optimal urease activity due to alterations in enzyme conformation.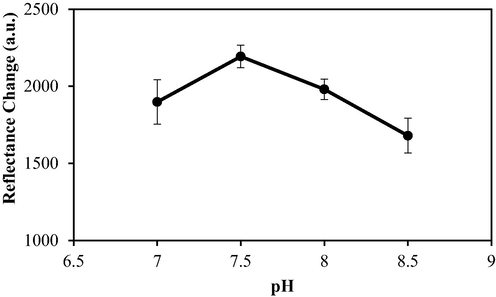
The effect of pH on biosensor response. Conditions: 50 mM PBS, 0.1 M PP in 1% alginate, 0.3 mg urease, and 1000 mM urea.
The effect of buffer concentration on biosensor performance was evaluated by varying the concentrations of PBS (pH 7.5) from 5 to 100 mM. A more concentrated buffer has a higher ionic strength, which strengthens pH stability (Bisswanger, 2014). As shown in Fig. 7, at a very low PBS concentration (<10 mM), biosensor response was poor due to reduced ionic strength within the buffer, leading to a lower reactivation rate of urease. Likewise, the functionality of the biosensor was also compromised by an excessively high buffer concentration (100 mM). Under such conditions, the system would become saturated with the buffer's cationic species. These cations would actively and continuously react with the OH_ anions produced through urea hydrolysis, consequently creating an environment that reduces the sensitivity of the biosensor (Saeedfar et al., 2013). A suitable buffer concentration for urea detection should neither be too low nor too high. Therefore, for the rest of the study, a 25 mM PBS solution of pH 7.5 was set as the standard base in the preparation of stocks, dilutions, and where protocols necessitated its usage.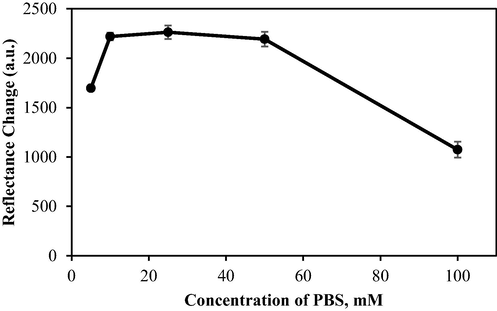
The effect of buffer concentration on biosensor response. Conditions: PBS (pH 7.5), 0.1 M PP in 1% alginate, 0.3 mg urease, and 1000 mM urea.
3.3.2 Phenolphthalein and alginate concentrations
Responsiveness of the immobilised urease towards the presence of urea was confirmed by the PP indicator. It is often used as a pH-sensitive dye, which is present in pink or colourless when deprotonated or protonated, respectively (Fig. 2). The increase of pH due to the production of OH_ in the solution could be detected as the immobilised PP turned pink (Islam et al., 2016). Thus, it is crucial to use the appropriate concentration of PP in the fabrication of the biosensor. The effect of PP concentration on biosensor performance was studied in the range of 0.02–0.08 M. As seen in Fig. 8, the response increased gradually with the increase of PP from 0.02 to 0.04 M. This is likely due to the greater number of deprotonated PP present in the latter, which induced the gradual light-to-dark pink colour change of the biosensor to occur at a faster rate. Beyond 0.04 M, its response decreased visibly, as indicated by a lighter pink hue. PP is slightly acidic, where an excessive amount of PP in a biosensor system can promote a pKa shift. The resultant acidic environment is non-conducive for enzyme activity, thus reducing the sensitivity and overall response of the urea biosensor. This finding is supported by a report from Hulth et al. (2002), where a similar concentration of 8-hydroxypyrene 1,3,6, trisulfonic acid trisodium salt (HPTS) was effectively used as the pH indicator on sensor foils. Therefore, 0.04 M PP was chosen to be applied in all subsequent experiments.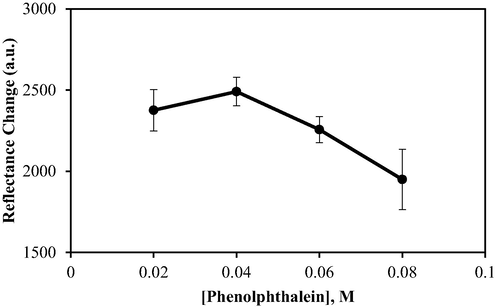
The effect of PP concentration on biosensor response. Conditions: 25 mM PBS (pH 7.5), 1% alginate, 0.3 mg urease, and 1000 mM urea.
Fig. 9 shows the effect of alginate concentration on the biosensor's responsiveness towards different urea concentrations, as determined by reflectance intensity. Three concentrations of alginate (1%, 2%, and 3% (w/w)) were used in this study. When a higher concentration of alginate was loaded onto the immobilised urease, the colour change intensity dropped significantly. Biosensor performance was best with 1% alginate gel. This is supported by Wen et al. (2019), who previously demonstrated that at a lower concentration, alginate formed a matrix with larger pores in comparison to the smaller pores produced at high concentrations. Bigger pores significantly facilitate hydrolysis by expediting the migration of urea through the matrix, thus allowing more urea to reach the immobilised urease on the surface of F-NPs. Accordingly, 1% alginate was chosen as the optimum concentration to be used in subsequent experiments.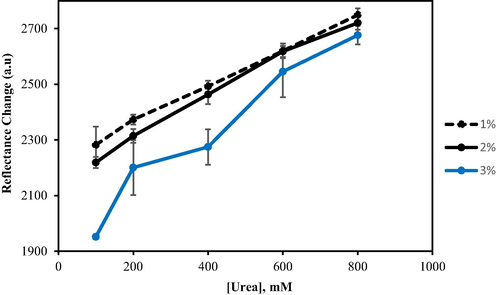
The effect of alginate concentration on the biosensor response. Conditions: 25 mM PBS (pH 7.5), 0.04 M PP, and 0.3 mg urease.
3.3.3 Optimum weight of urease
Several concentrations of urease enzyme (0.1, 0.2, 0.3, 0.4, and 0.5 mg) were chemically immobilised on F-NPs for the detection of urea. The increase of urease concentration from 0.1 to 0.3 mg during immobilisation resulted in substantial increments in reflectance intensity, as illustrated in Fig. 10. Evidently, urease-catalysed decomposition of urea occurred more readily in the presence of higher enzyme concentrations, leading to the dramatic colour changes of the PP indicator. However, biosensor response plateaued beyond a urease concentration of 0.3 mg, indicating that this level of urease is sufficient for the biosensor to react completely with 1000 mM urea within the allocated time span. It could also signify that urease would become insoluble at greater concentrations; hence, loading the biosensor with more urease would be a redundant practice. Consequently, 0.3 mg was perceived as the optimum urease concentration in the fabrication of the optical urea biosensor.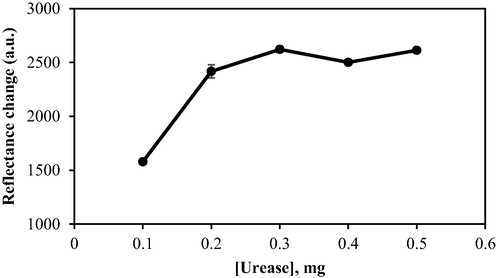
The effect of urease loading on biosensor response. Conditions: 25 mM PBS (pH 7.5), 0.04 M PP in 1% alginate, and 1000 mM urea.
3.3.4 Response time
The response time of the biosensor was studied in a time range of 2–15 min. When urea was added to the biosensor, the reaction occurred rapidly and the system achieved a steady-state within 10–15 min (i.e., no further colour changes were detectable), as shown in Fig. 11. Therefore, the reaction between urea and urease was completed within the first 10 min.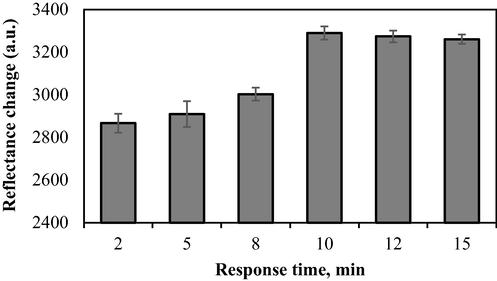
Response time of the optical biosensor towards urea. Conditions: 25 mM PBS (pH 7.5), 0.04 M PP in 1% alginate, 1000 mM urea, and 0.3 mg urease.
3.4 Biosensor performance
The performance of a biosensor can be characterised by several parameters, such as reproducibility, linear range, detection limit, stability, and selectivity. In this study, it could be observed that biosensor responsiveness increased in tandem with the increase of urea concentration. Reflectance intensity changes were projected to represent a linear response trend in the range of 30–1000 mM (R2 = 0.9901), where the normal concentration of urea in the urine of a healthy person was within the range, with a detection limit of 17.74 (Fig. 12). The high R2 value obtained proved that when compared to previously reported optical urea biosensors (Vaghela et al., 2018; Zhu et al., 2020), the biosensor produced in this study could perform just as well as those biosensors.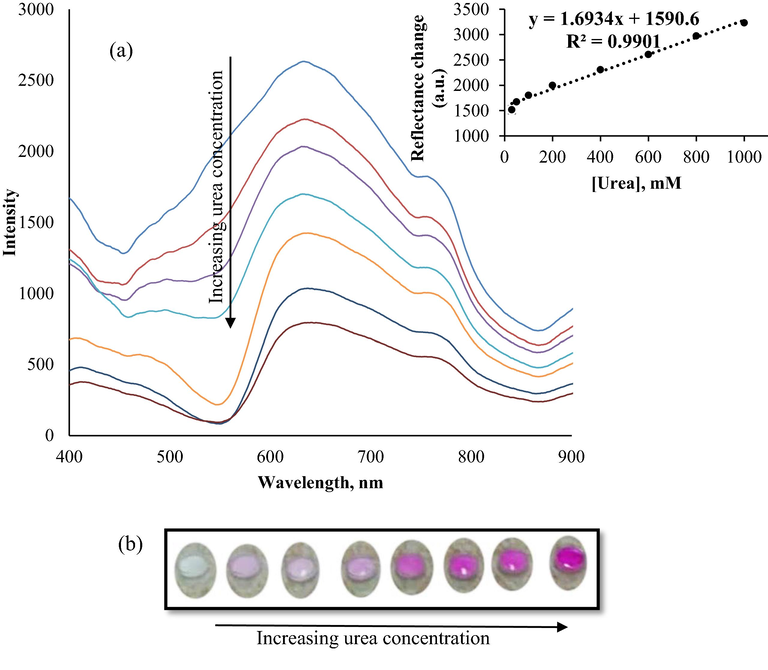
Reflectance spectra and calibration curve of urea biosensor, (a) and colour scale of optical biosensor, (b) obtained in the urea concentration in range of 30–1000 mM in 25 mM phosphate buffer (pH 7.5).
The biosensor's response was clearly observable based on intense and immediate colour changes, which became progressively darker with increased urea concentrations. The sensitivity obtained from the linear regression line was determined to be 1.69 mM-1. Reproducibility is also an important characteristic to consider in the performance evaluation of a biosensor. Hence, six optical biosensors were fabricated independently under the same conditions and tested with urea samples. Their results showed good reproducibility with a relative standard deviation of 1.14%.
Meanwhile, to estimate their shelf-life and stability for long-term storage, the prepared biosensors were stored at 4 °C and tested periodically up to 24 days. Based on the results, they remained up to 74% from day 1 to day 24. However, after 100 days, the response decreased by approximately 57%, as depicted in Fig. 13.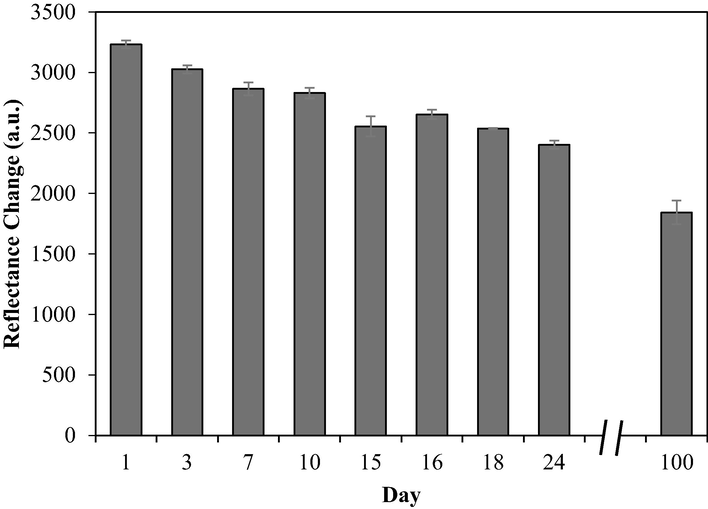
Shelf-life profile of the urea biosensor. Conditions: 25 mM PBS (pH 7.5), 0.04 M PP in 1% alginate, 1000 mM urea, and 0.3 mg urease.
3.5 Effect of interference ions
As shown in Table 1, the biosensor did not display signs of interference from any ion species, as evident by the absence of colour change. Instead, the biosensor remained reactive to urea alone. Importantly, these observations affirm the specificity of urease enzyme to urea, thus further supporting its applicability in this biosensor as a means to detect and measure urea in urine samples (Ulianas et al., 2011).
Urea/Interference Ions
Colour Changes
Urea
White to pink
K+
No colour change
Na+
No colour change
NH₄+
No colour change
Mg2+
No colour change
3.6 Real sample study
The performance of the developed biosensor was tested with actual urine samples to further evaluate the biosensor's usability in real-life applications. Based on Table 2, there were no significant differences (i.e., t-test at 95% confidence level) between the biosensor method and the standard spectrophotometry method using DMAB (Giraldo & Rivas, 2017). A good percentage of recovery in the range of 105.47%–115.75% (data not shown) indicated no significant matrix effect on the biosensor method.
Determination of Urea Concentration based on DMAB Method (mM)
Determination of Urea Concentration based on Biosensor Method (mM)
t-test value
(t₄= 2.78)
29.24 ± 0.2211
31.64 ± 3.0278
1.68
34.78 ± 0.0700
40.13 ± 6.9405
1.64
40.41 ± 0.1082
50.93 ± 9.4928
2.35
45.62 ± 0.0721
51.46 ± 5.1585
2.40
49.86 ± 0.9440
61.91 ± 13.1991
1.93
3.7 Comparison with previous optical biosensors
Table 3 compares enzymatic optical urea biosensors reported in previous studies with the biosensor developed in this work. The biosensor employed different matrices and transducer methods for urease immobilisation, resulting in various linear ranges, limit of detection (LOD), sensitivity, and shelf-life performance. The main advantage of this present biosensor is that it has a higher urea concentration detection and wider linear response range (30–1000 mM) than other biosensors. Thus, the biosensor is feasible to analyse urea in urine samples as the value of the ideal target quantification concentration range of urea in urine is 30–500 mM (Ukanova et al., 2018). Other biosensors with pH-sensitive materials using Prussian blue and pH-sensitive hydrogel have lower urea concentration detection, which are suitable for the measurement of urea in blood serum (2.5–7.5 mM) and urea in adulterated milk (3.00–6.67 mM). Furthermore, the current biosensor is eco-friendly and disposable as the support material used is biodegradable. Moreover, the sensitivity of this optical biosensor towards urea concentration is 1.6934 mM-1, which exhibited a higher sensitivity among others. The shelf-life of the current biosensor is also acceptable than those reported by Nikoleli et al. (2010) and Alqasaimeh et al. (2014), which were 8 and 17 days, respectively.
Materials
Linear range (mM)
LOD (mM)
Sensitivity(mM-1)
Shelf life (day)
Ref.
CaCO3-NPs from discarded cockleshell
30–1000
17.74
1.6934
24
This work
Air stable lipid film
4–10
10−6
–
7–8
Nikoleli et al., 2010
Silica-Gel NPs
50–500
10
0.3932
17
Alqasaimeh et al., 2014
Agarose-guar gum composite film
0.025–10
0.01
–
180
Vaghela et al., 2018
Poly(acrylic acid-co-dimethylaminoethyl methacrylate) hydrogel
1–20
1–2
–
56
Erfkamp et al., 2019
Prussian blue
7–30
–
–
>10
Valiūnienė et al., 2019
Zeolitic imidazolate framework (ZIF-8)
1–10
0.1
0.952
–
Zhu et al., 2020
4 Conclusions and recommendations
In conclusion, we have synthesised CaCO3-NPs from discarded cockle shells and, for the first time, employed the material towards the fabrication of a cost-effective, simple, and environmentally-friendly urea biosensor. The structural characterisation results showed the successful immobilisation of urease onto the surface of F-NPs. The optical urea biosensor with immobilised urease exhibited good sensing performance by retaining desirable qualities, such as high sensitivity (1.69 mM-1), a wide linear range (30–1000 mM), good selectivity, reproducibility, and long-term stability for the detection of urea. Furthermore, its utilisation as a biosensor for the determination of urea concentration in real samples is strongly supported by its ability to measure low and high urea levels in urine with considerable accuracy. Therefore, the wide availability of the fabricated biosensor would allow a quick urine analysis by direct detection without any pretreatment and with small sample requirements, thus easing the work of medical practitioners and minimising disturbance, especially for the benefit of elderly patients.
In future work, it is recommended to determine urea concentration in urine with a point-of-care detection technology using handheld devices, such as smartphones.
Acknowledgement
The authors are grateful for the financial support received from the Ministry of Higher Education via Fundamental Research Grant Scheme (FRGS), R/FRGS/A1300/01095A/003/ 2018/00550.
References
- Polypyrrole-based potentiometric biosensor for urea part 1. Incorporation of urease. Anal. Chim. Acta. 1993;281(3):611-620.
- [Google Scholar]
- Potentiometric urea biosensor based on BSA embedded surface modified polypyrrole film. Sens. Actuators, B. 2008;134(1):140-145.
- [Google Scholar]
- Selective determination of urea using urease immobilized on ZnO nanowires. Sens. Actuators, B. 2011;160(1):637-643.
- [Google Scholar]
- A large response range reflectometric urea biosensor made from silica-gel nanoparticles. Sensors. 2014;14(7):13186-13209.
- [Google Scholar]
- A urea biosensor from stacked sol-gel films with immobilized nile blue chromoionophore and urease enzyme. Sensors. 2007;7:2251-2262.
- [Google Scholar]
- Biosens. Nanotechnol. 2017
- [CrossRef]
- Crystal structure of the first plant urease from jack bean: 83 years of journey from its first crystal to molecular structure †. J. Mol. Biol.. 2010;400(3):274-283.
- [Google Scholar]
- pH and urea estimation in urine samples using single fluorophore and ratiometric fluorescent biosensors. Sci. Rep.. 2017;7:5840.
- [Google Scholar]
- Amperometric urea biosensors based on sulfonated graphene/polyaniline nanocomposite. Int. J. Nanomed.. 2015;10:55-66.
- [Google Scholar]
- Enzyme-functionalized piezoresistive hydrogel biosensors for the detection of urea. Sensors. 2019;19(13):2858.
- [Google Scholar]
- Determination of urea using p-N, N-dimethylaminobenzaldehyde: solvent effect and interference of chitosan. J. Chil. Chem. Soc.. 2017;62(2):3538-3542.
- [Google Scholar]
- Higgins, C., 2016. Urea and the clinical value of measuring blood urea concentration, (August), 1–6. Available from: <https://acutecaretesting.org/>.
- A pH plate fluorosensor (optode) for early diagenetic studies of marine sediments. Limnol. Oceanogr.. 2002;47(1):212-220.
- [Google Scholar]
- Sol-gel based phenolphthalein encapsulated heterogeneous silica-titania optochemical pH nanosensor. J. Ind. Eng. Chem.. 2016;34:258-268.
- [Google Scholar]
- Urea amperometric biosensors based on nanostructured polypyrrole and poly ortho-phenylenediamine. Appl. Biosens.. 2013;2:12-19.
- [Google Scholar]
- Jakhar, S., Pundir, C.S., 2018. Preparation, characterization and application of urease nanoparticles for construction of an improved potentiometric urea biosensor. Biosens. Bioelectron. 100 (July 2017), 242–250.
- Electrochemical determination of urea using a gold nanoparticle-copolymer coated-enzyme modified gold electrode. Instrum. Sci. Technol.. 2019;47(1):1-18.
- [Google Scholar]
- The effect of phosphate buffer in the range of pH 5.80-8.07 on jack bean urease activity. J. Mol. Catal. B Enzym.. 1999;6(1–2):75-81.
- [Google Scholar]
- Cockleshell-derived calcium carbonate (Aragonite) Nanoparticles: Appl. Sci.. 2019;9:1-25.
- [Google Scholar]
- Amperometric urea biosensor based on covalently immobilized urease on an electrochemically polymerized film of polyaniline containing MWCNTs. Synth. Met.. 2014;194:1-6.
- [Google Scholar]
- Recycling of seashell waste in concrete: a review. Constr. Build. Mater.. 2018;162:751-764.
- [Google Scholar]
- Capsaicin determination in chilli fruit using a new solid-state sensor based on reflectance transduction. Sens. Lett.. 2016;14(7):692-699.
- [Google Scholar]
- Detection of paracetamol in water and urea in artificial urine with gold nanoparticle@ Al foil cost-efficient SERS substrate. Anal. Sci.. 2018;34(2):183-187.
- [Google Scholar]
- Nall, R., 2018. Urine urea nitrogen test. Available from: <www.health.com/health/urea-nitrogen-urine>.
- Construction of a simple optical sensor based on air stable lipid film with incorporated urease for the rapid detection of urea in milk. Anal. Chim. Acta. 2010;675(1):58-63.
- [Google Scholar]
- Potentiometric biosensor for determination of urea in milk using immobilized Arthrobacter creatinolyticus urease. Mater. Sci. Eng., C. 2015;49:786-792.
- [Google Scholar]
- Potentiometric urea biosensor based on an immobilised fullerene-urease bio-conjugate. Sensors. 2013;13(12):16851-16866.
- [Google Scholar]
- Fluorescence bioanalytical method for urea determination based on water soluble ZnS quantum dots. Sens. Actuators, B. 2017;240:763-769.
- [Google Scholar]
- Gold microneedles fabricated by casting of gold ink used for urea sensing. Mater. Lett.. 2019;243(February):50-53.
- [Google Scholar]
- Immobilization of the urease on eggshell membrane and its application in biosensor. Mater. Sci. Eng. C. 2013;33(2):850-854.
- [Google Scholar]
- Urease covalently immobilized on cotton-derived nanocellulose-dialdehyde for urea detection and urea-based multicomponent synthesis of tetrahydro-pyrazolopyridines in water. RSC Adv.. 2019;9(71):41893-41902.
- [Google Scholar]
- Ukanova, Z.M., Udun, K.G., Lemessova, Z.E., Hamkhash, L.K., Alchenko, E.R., Ukasov, R.B., 2018. Detection of Paracetamol in Water and Urea in Artificial Urine with Gold Nanoparticle @ Al Foil Cost-efficient SERS Substrate. 34(February), 183–187.
- A biosensor for urea from succinimide-modified acrylic microspheres based on reflectance transduction. Sensors. 2011;11(9):8323-8338.
- [Google Scholar]
- Urea biosensor based on electrochromic properties of Prussian blue. Electroanalysis 2019:201900556.
- [Google Scholar]
- LED-Based portable optical biosensor for measurement of serum urea levels using urease immobilized agarose-guar gum composite film. IEEE Sens. J.. 2018;18(17):7273-7280.
- [Google Scholar]
- Surface modification of cellulose nanomaterial for urea biosensor application. Sains Malays.. 2018;47(5):941-949.
- [Google Scholar]
- Alginate hydrogel modified with a ligand interacting with α3β1 integrin receptor promotes the differentiation of 3D neural spheroids toward oligodendrocytes in vitro. ACS Appl. Mater. Interfaces. 2019;11:5821-5833.
- [Google Scholar]
- Low cost and eco-friendly nanoparticles from cockle shells as a potential matrix for the immobilisation of urease enzyme. Arab. J. Chem.. 2021;14(4):103056
- [Google Scholar]
- A metal-organic zeolitic framework with immobilized urease for use in a tapered optical fiber urea biosensor. Microchim. Acta. 2020;187(1)
- [Google Scholar]


