

Translate this page into:
Combinatıon of a Box-Behnken design technique with response surface methodology for optimization of the photocatalytic mineralization of C.I. Basic Red 46 dye from aqueous solution
⁎Corresponding author. m.berkani@ensbiotech.edu.dz (Mohammed Berkani)
-
Received: ,
Accepted: ,
This article was originally published by Elsevier and was migrated to Scientific Scholar after the change of Publisher.
Peer review under responsibility of King Saud University.
Abstract
The photodegradation of an industrial azo dye C.I Basic Red 46 was examined in a fixed-bed photoreactor using UV-lamps simulated to the solar irradiation. In our photodecolorization study, the UV/TiO2 process was optimized using the Box-Behnken approach to evaluate the synergistic effects of three independent parameters (initial concentration of the dye, flow rate, and UV intensity) on mineralization effectiveness. The response surface methodology was in good promise with the prediction model (coefficients of determination of decolorization and mineralization were R2Dec = 0.997 and R2TOC = 0.994, respectively). The effects of the factors could be estimated from a second–order polynomial equation and student’s t-test. The optimal parameters of decolorization and mineralization were as follows: initial concentration of colorant 25 mg L−1, rate of fluid flow 0.3 L min−1, and ultraviolet light intensity 38.1 W m−2. The decolorization and mineralization removal efficiency under these optimal conditions were 100% and 57.63% respectively. These results indicate that optimization using response surface methodology, based on the Box-Behnken approach, is an excellent tool for determining the optimal conditions, and the process can be easily extrapolated for a specific treatment of real waste water containing the azo dye C.I Basic Red 46. Also, the intermediates that were produced during photodegradation process of Basic Red 46 were determined by GC/MS.
Keywords
Photocatalysis
Azo dye
Optimization
Response surface methodology
Wastewater
Mineralization

1 Introduction
The dyes have been used widely as colorants in various industries, such as textile, pharmaceutical and food. The 70% of all reactive dyes are the azo variety, whereas the others are primarily the anthraquinonic and phtalocyanine types (Sillanpää et al., 2018). Moreover, over 10,000 different dyes and pigments have been applied in these industries (Gürses et al., 2016).
The water regulations depend on the type of the matrices. The Danish Environmental Protection Agency (DEPA) has classified the azo-dye as a suspected human carcinogen. The DEPA has set a maximum concentration level of this emerging contaminant in drinking water at 3.1 μg L−1 for safety reasons (DEPA, 2000). Moreover, a recent study by the Occupational Dermatology Research Centre in Australia recommended that the textile dye BR 46 be tested in cases of foot dermatitis (Opie et al., 2003).
The dyes in wastewater are emerging contaminants and often require specific treatment. Currently, the new chemical oxidation technologies to treat wastewater contributed to the development of performing methods for elimination called advanced oxidation processes (AOPs) (González-Casamachin et al., 2019; Saffari et al., 2020). The photodegradation technique is considered to be an important process for elimination of emerging pollutant presents in aquatic matrices. The photocatalysis degradation of industrial dyes are under extensive interest of many researchers (Al-Zahrani et al., 2020; Nasseh et al., 2020a; Singh et al., 2020). In addition, the hydroxyl radical is the most reactive oxygen species that are generated by AOPs, based on their non-selective and highly reactive nature (Andreozzi et al., 2011; Koprivanac and Kusic (2009)). Photocatalysis process represents a one of a promising AOPs processes that occurs in the presence of semiconductor; oxygen as a critical electron scavenger, and irradiation sources, (Orozco et al., 2009); the most commonly used is titanium dioxide (TiO2), which has been widely investigated as a photocatalyst for energy and environmental applications because of its excellent chemical/photochemical stability, good biocompatibility, non–toxicity and low cost and currently is compared to replace classical heterogeneous catalysis (Morales-Leal et al., 2018, Fiorenza et al., 2016), recently a novel photocatalysts were synthesized in order to increase the photodegradation efficiency of organic pollutant molecules (Nasseh et al., 2020; Khodadadi et al., 2020; Akbari et al., 2019; Nasseh et al., 2020b), thus in recent years, interest has focused on the design of new photocatalytic reactors (Vargas et al., 2015; Long et al., 2018). Since the emergence of photocatalysis, several semi-pilot photoreactors for the treatment of water has been developed (Salaices et al., 2004; Zhang et al., 2012; McCullagh et al., 2010; Buechler et al., 1999).
In the photocatalytic UV/semiconductor process system, the photonic excitation produces electron–hole pairs in the surface of the semiconductor. The highly oxidative can react with surface bound H2O to produce hydroxyl radicals °OH or can directly react with the organic molecules, the photo-oxidation process leads to the complete mineralization of most organic compounds.
The photocatalysis process is strongly dependent on various operational conditions which require the development of experimental design allowing the study and the optimization of their influence during the photodegradation process. Design of experiments as a powerful tool is used to examine the effects of the selected factors on the response process. Response surface methodology (RSM) has been applied widely to solve many optimization photocatalysis process, including ZnO or TiO2-supported or slurry/UV oxidation (Bazrafshan et al., 2019; Danion et al., 2004; Amat et al., 2004; Bouchareb et al., 2014; Berkani et al., 2019), ozone and electrochemical oxidation processes (Chen 2000). The most experimental designs used to optimize photocatalytic process are Doehlert matrix (DM), central composite designs (CCD) and the Box-Behnken design (BBD); the Box-Behnken design (Box and Behnken, 1960) and Doehlert matrix are slightly more efficient than the central composite design and other response surface designs (Ferreira et al., 2007).
In this work, three independents parameters such as initial pollutant concentration, light intensity, and flow rate; using response surface methodology are examined. This methodology is based on Box-Behnken design, of photocatalytic decolorization and mineralization of an industrial cationic dye Basic Red 46 (BR46) in a fixed-bed photoreactor using immobilized catalyst TiO2 Millennium PC500 by TiO2/UV.
2 Experimental
2.1 Chemicals and materials
The experimental setup as shown schematically in (Fig. 1(a) and (b)), consisted of the following elements (Berkani et al., 2015):
-
Three UV-A lamps (PL-L 24 W/10/4P PHILIPS) with maximum peak intensity of 356 nm, set inside the stainless steel cover against the six steps of the photoreactor (Fig. 1(a)) to provide maximum irradiation, the UV intensities were measured using a radiometer (Cole Parmer) at 365 nm by varying the number of UV lamps;
-
A reservoir (2.5 L) opens to the air and associated with an agitation system, insured by a magnetic stirrer to provide sufficient oxygenation (O2) as a scavenger of electrons in photocatalytic process;
-
The flow rate was controlled by GearPump Drive 75211–15 (Cole-Parmer Instrument Company) operating up to 130 L h−1.
-
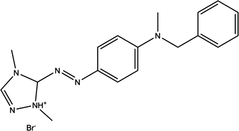
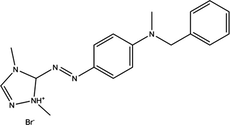
Basic Red 46 (Table 1) an industrial textile dye available at Aurassienne Spinning and Blankets (SAFILCO) Company, Algeria.
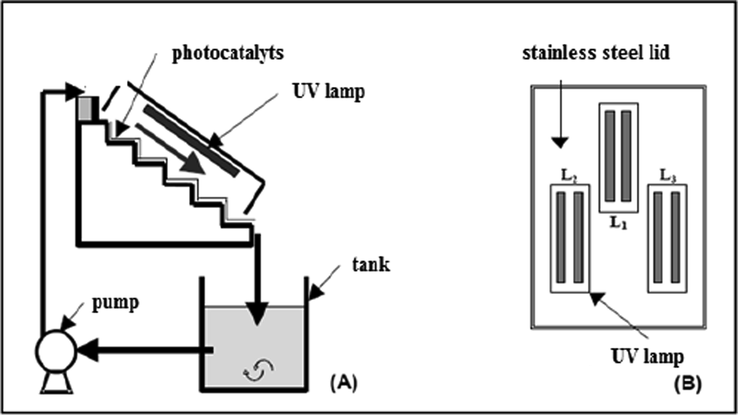
- Schematic representation of the experimental device.
| Structure | Class | C.I number | λmax(nm) | Mw (g mol−1) |
|---|---|---|---|---|
|
Cationic Mono-azo | 110825 | 531 | 357.5 |
The reactor was made of six regular steps of the same dimensions (depth/height/width: 6 cm/ 6 cm/ 25 cm) covered with the photocatalytic media (0.18 m2; 72 cm × 25 cm corresponding to 4 g of TiO2). Three UV lamps were placed on the inside of a cover; the light intensity was measured by a Radiometer (VLX-3 W). Titanium dioxide TiO2 Millennium PC500 was coated on non-woven paper (natural cellulose fiber, 2 mm thick) provided by Ahlström Company, the dye aqueous solutions were prepared using deionized water and the experiments were carried out under different conditions using constant solution volume of 2.5 L. The liquid flow on the media was a thin falling film of about 1 mm, the initial pH of the solution corresponded to the natural pH of the aqueous solution and samples were withdrawn taken from the tank photoreactor at different time intervals to evaluate the concentration of the target compound versus time.
2.2 Box-Behnken experimental design and RSM optimization
The application of experimental design as a powerful statistical tool allows to reduce process variability combined with the requirement of less resources (time, reagents and experimental work), meanwhile, Response Surface Methodology (RSM) allows to solve multivariable equations and evaluate the relative significance of several affecting factors even in the presence of complex interaction.
The second-order polynomial equation describe the rate of photodegradation versus the selected functional parameters, including initial dye concentration (X1), intensity of UV irradiation (X2), and flow rate (X3). The process was optimized applying the Box-Behnken design and response surface methodology, consisting of 15 experiments. Table 2 represents the levels and ranges of the selected independent variables.
Variable
Ranges and levels
−1
0
+1
[RB46]0(mg.L−1)
20
35
50
X2 Intensity I (Wm−2)
14.5
26.3
38.1
X3 Recirculation flow rate QL (L.min−1)
0.3
0.6
0.9
A second-order polynomial model provided by Box-Behnken design which relates the response Y to selected factors X1, X2, X3 was used to optimize the decolorization and mineralization process. (Eq. (1)):
MINITAB stat software (16 Minitab Institute, USA) offers full quadratic regression method to analyze responses and it was used to fit the mathematical models of the experimental data to the second-order polynomial equation.
2.3 Analysis
The analysis of samples at an equal interval time of 10 min were carried out using a UV–VIS spectra (Shimadzu UV-1603) to determine the absorbance which is related to the concentration by a calibration plot, based on Beer–Lambert’s law, therefore, both of decolorization and mineralization yield (YDec and YCOT (%)) are explained by the ratio of residual concentration to the initial one, using the following equation (Eq. (2)):
Decolorization yield of the dye BR 46 was determined by UV absorption at λmax = 365 nm using a UV–VIS spectrophotometer (Shimadzu UV-1603). Total organic carbon in a sample is measured by the amount of CO2 formed by oxidizing the organic compounds; therefore, the mineralization yield was monitored by checking regularly the level of total organic carbon using a TOC analyzer (V-CPH SHIMADZU). Gas chromatography-mass spectrometry (GC/MS) was used for identification of by-products compounds. A Perkin Elmer Clarus 500 apparatus GC/MS was used coupled with a Variance CB-FFAP column (0.25 µm × 25 m × 0.15 mm). All samples were analyzed in hexane.
3 Results and discussions
3.1 Box-Behnken model
The three-level matrix generated by Box-Behnken design with the responses obtained experimentally for the photodecolorization and photodegradation (mineralization) are shown in (Table 3). Based on these results, two empirical relationships that relate the response and selected variables were obtained:
Exp
[BR46] (mg L−1)
Intensity (W m−2)
Flow rate (L min−1)
Yield (%)
YDec Measured
YDec Predicted
YTOC Measured
YTOC Predicted
1
−1
−1
0
93.4
94.1
32.2
33.1
2
1
−1
0
89.8
90.1
27.4
28.2
3
−1
1
0
97.8
97.5
50.7
49.9
4
1
1
0
95.4
94.7
39.2
38.4
5
−1
0
1
97.8
97.8
46.9
47
6
1
0
1
95.3
95.6
37.3
37.5
7
−1
0
1
97
96.7
37.1
36.9
8
1
0
1
91.9
91.9
30.3
30.1
9
0
−1
−1
97.1
96.4
34.9
33.9
10
0
−1
−1
99.2
99.6
49.3
50
11
0
1
−1
93.6
93.2
28.6
27.9
12
0
1
−1
97.4
98
37.7
38.7
13
0
0
0
97.3
97.3
38.8
38.8
14
0
0
0
97.3
97.3
38.8
38.8
15
0
0
0
97.3
97.3
38.8
38.8
The experimental responses versus the predicted ones are shown in (Fig. 2(a) and (b)); the predicted values approximate the observed values in all sets of experiments for decolorization and mineralization. The predicted values agree well with the experimental data with a coefficient of determination R2 = 0.997 and R2 = 0.994, implying that 99.7% and 99.4% of the variations in percent color removal and degradation, respectively, were explained by the selected variables. The adjusted R2 (Adj–R2) is a corrected goodness-of-fit and it was also close to the coefficient of determination R2 which indicatethat the regression predictions approximate well the real data points.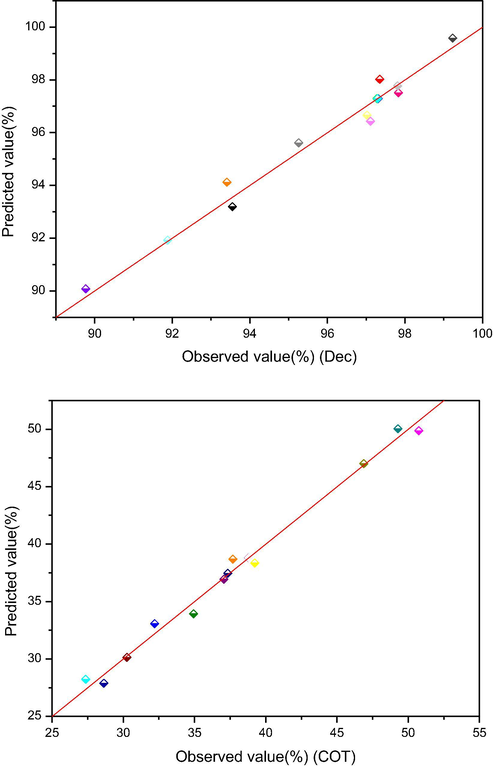
The observed values (%) plotted against the predicted values (%) derived from the (a) model of color (YDec) and (b) (YTOC) removal (%), for time = 60 min.
3.2 Analysis of variance (ANOVA)
ANOVA (Table 4) was achieved to determine the important main and interaction effects of factors that influence the dye photodecolorization efficiency (Panahi et al., 2019). The model is extremely significant and could be validated by Fisher value (F–value (Dec) = 21.03 and F–value (TOC) = 59.31), which is greater than the critical F-value at a level of significance α = 0.95 (F-tabular = 3.48 for decolorization and mineralization), indicating that the differences in treatment were highly significant. For statistical significance, we expect the absolute value of the t-ratio (critical) to be >2 or the P-value to be less than the significance level (α = 0.05). YDec: R2 = 0.997, Adj- R2 = 0.97. F-value = 21.03 » F0.05 (9.5) tabular = 3.48. YCOT: R2 = 0.994, Adj- R2 = 0.98. F-value = 59.46 » F0.05 (9.5) tabular = 3.48.
Decolorization
Mineralization
Source of variation
Sum of squares
Ajusted mean square
F value
P valve
Sum of squares
Ajusted mean square
F value
P valve
Regression
92.6
10.28
21.03
0.002
670.54
74.50
59.5
0.000
X1
23.8
23.8
42.7
0.001
134
134
106.66
0.000
X2
31.8
31.8
45.4
0.001
362
362
289
0.000
X3
11.5
11.5
60.63
0.005
151.20
151
120.60
0.000
X21
18.5
18.8
14.5
0.002
1.27
1.27
1.01
0.360
X22
3.53
3.26
35.9
0.055
2.56
2.56
2.05
0.212
X23
0.77
0.77
6.23
0.279
0.41
0.41
0.33
0.591
X1 X2
0.34
0.34
1.74
0.452
11.1
11.1
8.88
0.031
X1 X3
1.67
1.67
0.66
0.134
1.90
1.89
1.51
0.274
X2 X3
0.70
0.70
3.20
0.298
7.02
7.02
5.60
0.064
Residuals
2.61
0.52
6.26
1.25
Lack of fit
2.61
0.87
3741
0.000
6.26
2.088
8950.04
0.000
Pure error
0.0005
0.0002
0.000
0.000
Total
95.2
676.80
The P-values were also used to verify the significance of each coefficient; if P-value < 0.05 the terms of model were significant, thus the coefficient is more significant in the greater magnitude of the student’s t-test and the smaller the P-values (Oppenlander, 2003).
3.3 Effect of factors on decolorization and mineralization of BR46
The effects of factors can be estimated from the second-order polynomial equation and student’s t-test, to determine which terms have statistically significant effects on the response, the t-value is the ration of associated coefficient of each term to its standard error. If the t-value is greater than or equal to the t-critical, you can conclude that there is a statistically significant association between the response variable and the term. Synergistic or antagonistic effect corresponds to the positive or negative sign of model coefficient. UV light intensity had a synergistic effect, but the BR46 concentration and flow rate had antagonistic effects on photodegradation efficiency.
Pareto chart test (Fig. 3) was used to determine whether the effects differed significantly from zero according to the following relation (Oppenlander, 2003); this analysis calculates the effect (Pi) of each factor on the response, according to the relation (12) where bi is the coefficient associated to the factor (i):
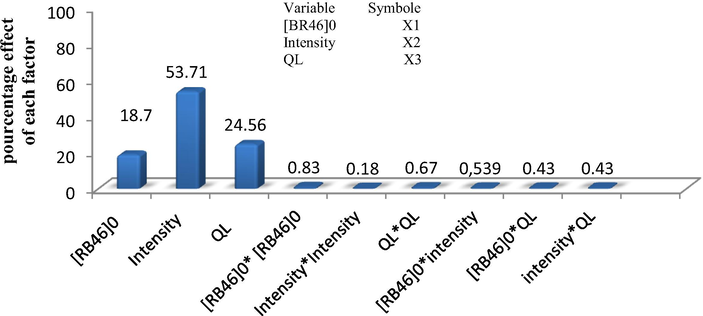
Pareto graphic analysis for mineralization (TOC).
The Pareto analysis (Fig. 3), gives more information about the main significant parameters, at low dye concentrations, the decolorization effectiveness yielded importance results and therefore, the circulation flow rate was slowed to permit better contact between the solution be treated and the UV light source. In our study; the rate of °OH generated radicals as a puissant oxidation species is more significant at high light UV intensity, which were consistent with the literature, (Liu and Chiou 2005; De Lasa et al., 2005).
3.4 Effect plots
Level plots (Fig. 4) were generated by stat software (MINITAB 16) to study the effect of interactions of the three variables tested on the decolorization and the degradation efficiency Y (%); A disc-shaped contour scheme indicates that the interaction between factors is insignificant, while an elliptical form (egg-shaped) designates importance of the interaction on either side selected factors, (Arbab-Zavar et al., 2012; Kesraoui-Abdessalem et al., 2008). The results revealed that the decolorization yield Y (%), is more significant at low flow rate and higher light intensities within the ranges of BR46 concentration while maintaining the reaction time at 60 min in all experiments; this could be explained by the high yield of OH° radicals generated during the photocatalytic process at high UV light intensity. Thus, decolorization efficiency >99% and mineralization ˃30% were obtained at the optimum values of each parameter, which indicated the dependability of obtained predicted values by the mathematical model.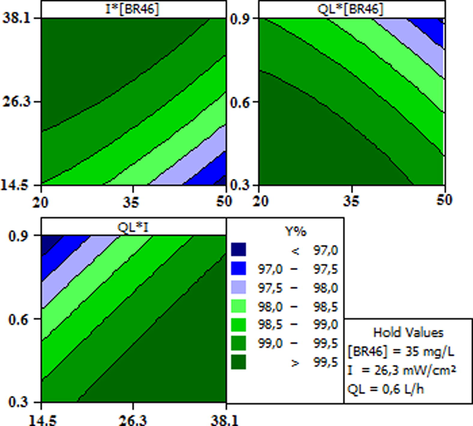
Contour plots of photocatalytic decolorization efficiency Y(%).
3.5 Optimal conditions for photodecolorization of BR46
In order to prove the powerful of the statistical tool used to optimize the operating conditions; the process optimum values for the maximum decolorization efficiency is easily determined by taking the derivatives with respect to each variable and solving for zero,. After verifying by a further experimental test with the predicted values, the result indicates that the maximal decolorization efficiency was obtained when the values of each parameter were set as the optimum values, the predicted and observed YDec (%) was 99.68% and 99.5% respectively, with a desirability factor of 1.
3.6 Optimal conditions for photodegradation of BR46 (mineralization)
Photodegradation of the BR46 azo dye was examined by controlling the Total Organic Carbon (TOC) decreasing in the mineralization process which was much slower than decolorization process, thus the complete oxidation of BR46 indicates the total conversion of organic carbon into mineral carbon (CO2); in our UV/TiO2 process, the optimal parameters of the mineralization were as follows: initial concentration of BR46 of 25 mg L−1, intensity of UV irradiation of 38.1 W m−2 and rate of fluid flow of 0.3 L min−1. The highest TOC removal efficiency of 57.63% elimination was obtained under these optimal conditions.
3.7 Proposed degradation mechanism
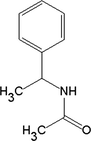
The formation of uncolored by-product during the photo-conversion process which persists until 300 min in BR46 solution with the main dye molecules. The GC/MS technique was employed for identification of by-products compounds after photodegradation process. GC/MS was performed to follow up on the competitiveness of the intermediates that were generated during the destruction (Fig. 5). The generation of these two intermediates (N-phenylethylacetamide and acetamide) during the photocatalysis confirmed the active degradation of BR46 molecules through photodegradation (Table 5). Based on the intermediate and final products detected, the proposed degradation mechanism of BR46 can be summarized as follows: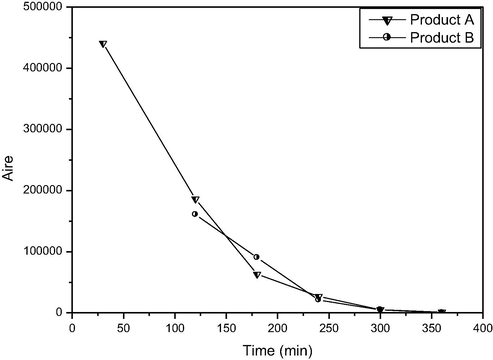
Analysis by GC/MS of intermediates appears during mineralization process.
Compound
Molecular formula
Structure
Retention time (min)
Basic Red 46
C18H21BrN6
0
N-phenylethyl acetamide
C10H13NO
4
Acetamide
CH3CONH2

8.4
The highly oxidative can react with surface bound H2O to produce hydroxyl radicals °OH:
Photooxidation of BR 46 mechanism can be summarized as follows:
Both oxidation and reduction processes take place on the surface of the photocatalyst.
4 Conclusion
The response surface methodology based on Box-Behnken design, were employed for analysis the decolorization and mineralization of an industrial azo dye, C.I Basic Red 46, in a fixed bed photoreactor. This study has demonstrated the applicability of this experimental design to develop the second-order polynomial response equation and analysis of variance (ANOVA), indicating a very high coefficient of determination (R2 = 99%) for the decolorization and mineralization. The variable UV light intensity had a synergistic effect, on the other side increasing in flow rate and dye concentration affected antagonist the photodecolorization and photodegradation. Moreover, the experimental data versus the predicted values generated by MINITAB were reasonably close, the adequacy and validity of the prediction models was examined using Fisher value (F-value) of 21.03 and 59.46 for decolorization and mineralization, respectively; which are much higher of the critical F-value of 3.48. Also, the verification experiments confirmed that the predicted values of 100% decolorization and 57.63% mineralization could be achieved within 99.97% and 99.94% confidence intervals, respectively, of the experimental values. These results indicate that optimization using response surface methodology, based on the Box-Behnken approach, is an excellent tool for determining the optimal conditions for maximum removal of dye.
References
- Oxidative degradation of 2, 4-xylidine by photosensitization with 2, 4, 6-triphenylpyrylium: homogeneous and heterogeneous catalysis. Chemosphere. 2004;57(9):1123-1130.
- [Google Scholar]
- Synthesis and characteristics of a novel FeNi3/SiO2/TiO2 magnetic nanocomposites and its application in adsorption of humic acid from simulated wastewater: study of isotherms and kinetics. Environ. Sci. Pollut. Res.. 2019;26(31):32385-32396.
- [Google Scholar]
- Oxidation of 2,4-dichlorophenol and 3,4-dichlorophenol by means of Fe(III)-homogeneous photocatalysis and algal toxicity assessment of the treated solutions. Wat. Res.. 2011;45(5):2038-2048.
- [Google Scholar]
- Photocatalytic decolourization of a new water-insoluble organic dye based on phenothiazine by ZnO and TiO2 nanoparticles. Arabian J. Chem.. 2020;13(2):3633-3638.
- [Google Scholar]
- Aliakbari., Multivariate optimization on flow-injection electrochemical hydride generation atomic absorption spectrometry of cadmium. Talanta. 2012;97:229-234.
- [Google Scholar]
- Photocatalytic degradation of catechol using ZnO nanoparticles as catalyst: optimizing the experimental parameters using the Box-Behnken statistical methodology and kinetic studies. Microchem. J.. 2019;147:643-653.
- [Google Scholar]
- Implementation of a venturi photocatalytic reactor: optimization of photodecolorization of an industrial azo dye. Ara. J. Chem. 2019;12(8):3054-3063.
- [Google Scholar]
- Optimization of photocatalytic decolourization of cationic azo dye in thin film fixed bed photoreactor. Chem. Eng. Trans.. 2015;43:961-966.
- [Google Scholar]
- Optimization of photocatalytic decolorization of C.I. Basic Blue 41 in semi-pilot scale prototype solar photoreactor. J. Chem. Technol Biotech.. 2014;89(8)
- [Google Scholar]
- Technometrics. 1960;2:195.
- Design and evaluation of a novel controlled periodic illumination reactor to study photocatalysis. Ind. Eng. Chem. Res.. 1999;38:1258-1263.
- [Google Scholar]
- Effects of factors and interacted factors on the optimal decolorization process of methyl orange by ozone. Water. Res.. 2000;34:974-982.
- [Google Scholar]
- Optimization of a single TiO2-coated optical fiber reactor using experimental design. J. Photochem. Photobiol.A.. 2004;168:161-167.
- [Google Scholar]
- De Lasa, H., Serrano, B., Salaices, M., 2005. Photocatalytic reaction engineering. https://doi.org/10.1007/0-387-27591-6.
- DEPA (Danish Environmental Protection Agency), 2000. Survey of azo-colorants in Denmark, Toxicity and fate of azo dyes, Danish Technological Institute.
- Box-Behnken design: an alternative for the optimization of analytical methods. Anal. Chim. Acta. 2007;597(2):179-186.
- [Google Scholar]
- A comparison between photocatalytic and catalytic oxidation of 2-Propanol over Au/TiO2–CeO2 catalysts. J. Mol. Catal. A: Chem.. 2016;415:56-64.
- [Google Scholar]
- Visible-light photocatalytic degradation of acid violet 7 dye in a continuous annular reactor using ZnO/PPy photocatalyst: Synthesis, characterization, mass transfer effect evaluation and kinetic analysis. Chem. Eng. J.. 2019;373:325-337.
- [Google Scholar]
- Experimental design methodology applied to electro-Fenton treatment for degradation of herbicide chlortoluron. Appl. Catal.B. 2008;78:334-341.
- [Google Scholar]
- The practical utility of the synthesis FeNi3@ SiO2@ TiO2 magnetic nanoparticles as an efficient photocatalyst for the humic acid degradation. Chemosphere. 2020;239:124723
- [Google Scholar]
- Hazardous Organic Pollutants in Colored Waswaters. New York: Nova Science Publishers; 2009.
- Optimal decolorization efficiency of Reactive Red 239 by UV/TiO2 photocatalytic process coupled with response surface methodology. Chem. Eng. J.. 2005;112(1–3):173-179.
- [Google Scholar]
- Fabrication of the annular photocatalytic reactor using large-sized freestanding titania-silica monolithic aerogel as the catalyst for degradation of glyphosate. Mater. Des.. 2018;159:195-200.
- [Google Scholar]
- Development of a slurry continuous flow reactor for photocatalytic treatment of industrial waste water. J. Photochem. Photobiol. A Chem.. 2010;211(1):42-46.
- [Google Scholar]
- Comparison between the catalytic and photocatalytic activities of Cu/Al2O3 and TiO2 in the liquid–phase oxidation of methanol–ethanol mixtures: development of a kinetic model for the preparation of catalyst. Appl. Catal. A. 2018;562:184-197.
- [Google Scholar]
- A comprehensive study on the application of FeNi3@ SiO2@ ZnO magnetic nanocomposites as a novel photo-catalyst for degradation of tamoxifen in the presence of simulated sunlight. Environ. Pollut.. 2020;261:114127
- [Google Scholar]
- Enhanced photocatalytic degradation of tetracycline from aqueous solution by a novel magnetically separable FeNi3/SiO2/ZnO nano-composite under simulated sunlight: efficiency, stability, and kinetic studies. J. Mol. Liq.. 2020;112434
- [Google Scholar]
- Foot dermatitis caused by the textile dye Basic Red 46 in acrylic blend socks. Contact. Dermatitis.. 2003;49(6):297-303.
- [Google Scholar]
- Photochemical Purification of Water and Air. Weinheim, Germany: Wiley-VCH; 2003.
- Radiation absorption and degradation of an azo dye in a hybrid photocatalytic reactor. Chem. Eng. Sci.. 2009;64(9):2173-2185.
- [Google Scholar]
- Removal of cephalexin from artificial wastewater by mesoporous silica materials using Box-Behnken response surface methodology. Desalin. Water Treat.. 2019;159:169-180.
- [Google Scholar]
- Synthesis and photocatalytic degradation activities of phosphorus containing ZnO microparticles under visible light irradiation for water treatment applications. Environ. Pollut.. 2020;113902
- [Google Scholar]
- Photocatalytic conversion of phenolic compounds in slurry reactors. Chem. Eng. Sci.. 2004;59(1):3-15.
- [Google Scholar]
- Advanced oxidation processes for the removal of natural organic matter from drinking water sources: a comprehensive review. J. Environ. Manage.. 2018;208:56-76.
- [Google Scholar]
- Review on various strategies for enhancing photocatalytic activity of graphene based nanocomposites for water purification. Arabian J. Chem.. 2020;13:3498-3520.
- [Google Scholar]
- Photocatalytic degradation of trichloroethylene in a continuous annular reactor using Cu-doped TiO2 catalysts by sol–gel synthesis. Appl. Catal. B. 2015;179:249-261.
- [Google Scholar]
- Development of a novel capillary array photocatalytic reactor and application for degradation of azo dye. Chem. Eng. Sci.. 2012;184:9-15.
- [Google Scholar]


