

Translate this page into:
Combined effects of pore structure and surface chemistry on water vapor adsorption characteristics of coal: Equilibrium, thermodynamic and kinetic studies
⁎Corresponding author. puchao12345@foxmail.com (Chao Pu)
-
Received: ,
Accepted: ,
This article was originally published by Elsevier and was migrated to Scientific Scholar after the change of Publisher.
Peer review under responsibility of King Saud University.
Abstract
Abstract
The combined effects of surface chemistry and pore structure on water vapor adsorption characteristics of coal were studied by evaluating the equilibrium, thermodynamic and kinetic properties. Four coal samples of different rank were fully characterized with gas (N2 and CO2) sorption and Fourier Transform infrared spectroscopy (FTIR) methods. Then measurements of water vapor adsorption equilibrium and kinetics were undertaken at elevated temperatures. Equilibrium and kinetic data were fitted by the modified BET model and the unipore model, respectively. The thermodynamic parameters, as well as diffusion activation energy were estimated based on the adsorption data. The results demonstrate that water vapor adsorption depends on the surface chemistry but unrelated to the pore structure, because the pore space is not completely filled by water molecules even at the saturation pressure. The monolayer adsorption capacity decreases with increasing coal rank. Moreover, water vapor needs lower work to attain equilibrium on high-ranked coal. Also, the binding affinity of water molecule with primary sites is stronger than secondary sites. Furthermore, the diffusion coefficient decreases with coal rank, and the diffusion activation energy for high-volatile bituminous is higher than the other coals, as a result of the complexity and poor connectivity of its pore network.
Keywords
Water vapor
Coal rank
Adsorption equilibrium
Thermodynamics
Kinetics

1 Introduction
In recent years, coal bed methane (CBM) is emerging as an abundant and low-cost unconventional natural gas resource with the optimization of drilling and completion technologies (Liu et al., 2011; Perera et al., 2012). To enhance the productivity of this energy resource, precise and reliable evaluation of gas-in-place is essential (Li et al., 2021; Lu et al., 2021). As adsorption is the main storage mechanism of CBM, the amount of gas-in-place is largely influenced by the adsorption properties of coal (Crosdale et al., 1998). Importantly, coalbeds are saturated with water, which can adversely affect the adsorption of methane, leading to an overestimation of CBM recovery rate (Wang et al., 2020). Hence, it is worthwhile to clarify the characteristics of water vapor adsorption for the accurate prediction of CBM recovery under in-situs conditions of coalbeds.
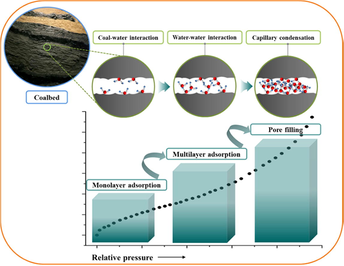
Coalbed is characterized by an inhomogeneous structure composed of both organic and mineral matters, with a broad pore size distribution (Thararoop et al., 2012; Kopac and Krca, 2020). The microscopic pores in coal matrix offer plenty of binding sites for gas molecules. Simultaneously, the macromolecular structure of coal enriches surface functional groups with tight binding potentials to the polar substances like water (Pan et al., 2015). Accordingly, there is a fundamental difference in the mechanism of adsorption between water vapor and nonpolar gases, e.g. methane, nitrogen (N2) and carbon dioxide (CO2). This division is generally explained by the weak water-carbon interaction, the strong water-water interaction, along with the formation of multiple hydrogen bonds with surface functional groups (Velasco et al., 2016). It is assumed that water molecules initially interact with the primary sites on coal surface. Afterwards, the adsorbed water molecules serve as secondary adsorption sites via hydrogen bonding to form water clusters. The water clusters are steadily growing in size and finally merge to fill the pore structure with a further increase in pressure (Busch and Gensterblum, 2011). Thereby, at low relative pressures surface chemistry is a leading factor controlling water vapor adsorption, while at high relative pressures the combined effects of surface chemistry and pore structure determine the adsorption characteristics (Shigehisa et al., 2014). Despite this, the relative importance of these two factors needs to be distinguished properly, as either surface chemistry or pore structure is significantly altered during the coalification process, leading to variations in the adsorption behavior of water vapor among different rank coals (Nishino, 2001).
To date, numerous studies have been initiated regarding the adsorption equilibrium of water vapor (McCutcheon et al., 2003; Prinz and Littke, 2005; Švábová et al., 2011). As a result, it is proved that the equilibrium uptake capacity is determined by numerous factors, such as temperature, relative pressure and coal rank. For instance, Prinz and Littke (2005) conducted water vapor adsorption experiments using a range of coal samples with vitrinite reflectance from 0.76% to 2.23%. They concluded that the uptake capacity of water vapor first decreases with coal rank, exhibiting minimum in low-volatile, followed by a monotonic increase in higher-ranked coals. This parabolic behavior is considered to be attributed to the variations of both surface chemistry and pore structure among various rank coals (Chen et al., 2022). Further, Suárez et al. (1993) found that carboxyl and hydroxyl groups were subjected to higher binding forces with water molecules than any other surface functional group. Moreover, Horikawa et al. (2011) reported that water cluster was prone to merge in mesopore (2 nm ∼ 50 nm) and super-micropore (0.7 nm ∼ 2 nm) of a porous solid, but may not be able to penetrate the ultra-micropore (<0.7 nm).
Adsorption kinetics is another crucial parameter for the modeling of water transport in the inner pore space of coalbeds (Rutherford and Coons, 2004). Compared to adsorption equilibrium, where merely the ultimate uptake capability is needed, measurement of adsorption kinetics requires continuous change in the amount of adsorption over time (Long et al., 2021). Diffusion coefficient (D) is an important variable for the numerical modeling of adsorption kinetics, which is usually determined according to multiple kinetic models. For example, Sevenster (1959) applied Fick’s law in describing water vapor adsorption kinetic properties on coal. Afterward, McCutcheon et al. (2001) developed an empirical kinetic model to compare diffusion coefficients of water vapor among several bituminous coals. More recently, Charrière and Behra (2010) calculated the diffusion coefficients of water vapor under a set of relative pressures and reported a negative relationship between adsorption kinetics and the relative pressure. However, there have been limited studies covering a wide range of coal ranks from lignite to anthracite and a large gap still exists in knowledge about the combined effects of surface chemistry and pore structure on water vapor adsorption kinetics of coal.
Adsorption thermodynamics is of crucial significance in reflecting the intrinsic mechanisms of adsorption and for estimating the modification in thermodynamic energy during the adsorption process (Liu et al., 2016; Dim et al., 2021). As reviewed by Busch and Gensterblum (2011), the temperature dependence of adsorption is controlled by thermodynamic properties, which is a function of surface coverage. Thereby, the water vapor adsorption thermodynamic properties depend on both surface chemistry and pore structure of coal. Despite the abundant information on adsorption equilibrium and kinetics, there is a lack of studies on the thermodynamic properties of water vapor adsorption on coal and further research is still needed (Tang et al., 2017; Chen et al., 2019; Dang et al., 2021).
Therefore, this study intends to fill this gap by determining the combined effects of surface chemistry and pore structure on water vapor adsorption of coal. To address this issue, four coal samples with different rank were fully characterized and then submitted to the isothermal adsorption of water vapor. The equilibrium and kinetic data were fitted by the modified Brunauer–Emmett–Teller (BET) model and the unipore model, respectively. In addition, parameters concerning thermodynamic and kinetic were estimated based on the adsorption data.
2 Materials and methods
2.1 Sample preparation
Four representative samples taken from major coal basins in China were selected for the present study, i.e., No. 5–2 seam of Daliuta coal mine in Ordos Basin, No. 3 seam of Zhaolou coal mine in Huabei Basin, No. C-9 seam of Guiyuan coal mine in Shuicheng Basin, and No. 6 seam of Datong coal mine in Sichuan Basin, representing identical ranks of lignite (DL coal), high-volatile bituminous (ZL coal), low-volatile bituminous (GY coal) and anthracite (DT coal), respectively. The coal lumps collected from underground coal mine were enclosed in polythene bags and immediately sent to the laboratory. The coal lumps were then ground and sieved to the desired grain size of + 10–8 mesh (2.36 mm ∼ 2.00 mm) and stored in vacuum bags to minimize the possible chemical and structural changes caused by air oxidation.
2.2 Sample characterization
2.2.1 Proximate and ultimate analysis
Prior to isotherm measurements, proximate and ultimate analysis were conducted to acquire information regarding the textural properties of the coals. The proximate analysis, including fixed carbon, volatile matters, ash and moisture, was conducted following the National Standard of China (GB/T 212–2022). The ultimate analysis was carried out using a Flash EA2000 elemental analyzer (Thermo Fisher Scientific, USA). The general information of the coal samples determined by proximate and ultimate analysis was reported in Table 1 (Liu et al., 2019). Notes: Cfix, fixed carbon; Vdaf, volatile matters; Aad, ash; M, moisture.
Sample
Ro max (%)
Proximate analysis (wt %)
Ultimate analysis (wt % daf)
Cfix
Vdaf
Aad
M
C
H
N
O
DL
0.42
53.55
36.96
19.42
2.46
72.71
4.95
1.19
20.50
ZL
0.81
65.10
28.71
16.24
1.50
82.54
4.57
1.08
11.03
GY
1.14
78.34
6.14
10.52
2.08
86.92
4.01
1.20
6.03
DT
1.86
73.85
12.81
13.34
1.96
90.11
3.79
0.96
2.05
2.2.2 Meso- and Micro-Porosity
The meso- and micro-porosity of the coals were examined by means of both N2 and CO2 adsorption experiments using an ASAP 2020 M instrument (Micrometrics Instruments Corporation, USA). Prior to each measurement, the as-received coal samples with a particle size range of + 10–8 mesh were automatically degassed by heating at 383 K under a high vacuum level (10-5 ∼ 10-6 Torr) for about 10 h to remove moisture and some other volatile matters. The adsorption–desorption isotherms of N2 were collected at 77 K under relative pressures up to 0.99, while the adsorption isotherms of CO2 were collected at 273 K under relative pressures up to 0.033.
At each pressure point, the equilibrium of adsorption–desorption was achieved as pressure remains constant for 30 s. The tolerance of pressure was set at 6.67 mbar (5 mmHg). The isotherm was generated automatically by the instrument’s software. In addition, the volume of pore space, specific surface area (SSA) and pore size distribution (PSD) were evaluated according to multiple theoretical models, namely, BET, Dubinin–Radushkevich (D–R), Dubinin–Astakhov (D–A), Barrett–Joyner–Halenda (BJH), and Density Functional Theory (DFT) (Mastalerz et al., 2010; Fatma and Turkan, 2019).
2.2.3 Fourier transfor infrated spectrometry (FTIR)
Surface chemistry of the coal samples was characterized by FTIR spectrometry using a Nicelet 6700 instrument (Thermo Fisher Scientific, USA). Samples for the measurement were prepared using the potassium bromide (KBr) pellet technique, where the powdered sample was mixed with KBr at 1:150. The spectral was recorded in the wavenumber region of 400 ∼ 4000 cm−1 with a resolution of 4 cm−1. The infrared spectral was disposed by Fourier calculation to distinguish the different types of surface functional group.
2.3 Adsorption equilibrium and kinetic measurements
A high-resolution gravimetric adsorption apparatus IGA-001 (Hiden Analytical, UK) was used to conduct the adsorption equilibrium and kinetic tests. Sample with grain sizes of + 10–8 mesh (weighing ∼ 200 mg) was placed in a basket connecting with the microbalance via a metal thread. Before each test, the sample was outgassed at 373 K under vacuum pressure (∼10−5 Pa) for 6 h. Then the reactor was cooled to the operating temperature using a thermostatic water bath with uncertainty of ± 0.1 K. The pressure was maintained at a fixed value and the change in weight was continuously monitored and recorded until equilibrium. The isotherms were estimated at a series of constant temperatures (288, 298, 308 K) under relative pressures up to 0.95, while the kinetic tests were performed under a fixed relative pressure (p/p0 = 0.2).
3 Modeling approach
3.1 Modified BET model
The adsorption equilibrium data were fitted by the modified BET model. This model can provide a better fit over the entire relative pressure range than BET model, which only fits the data for relative pressures<0.35 (Briao et al., 2022). Moreover, this model distinguishes the two classes of adsorption sites by assuming that water molecules first adsorbed on primary sites, and then interact with the adsorbed water molecules through hydrogen bonding interactions (Strydom et al., 2016). The equation for modified BET model is expressed as:
where nexp is the uptake capacity under pressure p, n0 is the maximum monolayer capacity, p0 is saturation pressure, K1 and K2 represent the average energy of primary and secondary sites, respectively.
3.2 Thermodynamic model
The thermodynamic parameters for water vapor adsorption, i.e. surface potential (Ω), Gibbs free energy change (ΔG), entropy loss (ΔS), enthalpy change (ΔH), and isosteric heat of adsorption (Qst) were determined by the equations listed as follows (Duan et al., 2016):
where R is the universal gas constant and C is integration constant.
3.3 Unipore model
The obtained adsorption kinetic data was fitted by the unipore model, which is one of the most popular means to describe adsorption kinetics (Clarkson and Bustin, 1999). This model is originated from the Fick’s Second Law of diffusion for spherically symmetric flow. The equation for the unipore model is described as follows (Pillalamarry et al., 2011):
with the initial condition: C = 0 at t = 0
where r is particle radius, D is diffusion coefficient, and C is the concentration of water molecule.
For spherical particles with a fixed surface density, the solution to Eq. (8) is converted into:
where Vt is the amount of adsorbed water vapor at time t, and V∞ is the uptake capacity at infinite time.
For the initial stage of adsorption and when the fraction of adsorbed is no more than 0.5 (Vt/V∞ ≤ 50%), Eq. (9) is simplified to:
By linear fitting of Vt/V∞ versus t1/2, the effective diffusivity De (D/r2) as well as diffusion coefficient D can be calculated.
3.4 Arrhenius law
The activation energy for water vapor diffusion Ea represents the potential barrier that water molecule needs to overcome in the diffusion process, which can be used to determine the level of difficulty (Charrière et al., 2010). Arrhenius law is an effective method to calculate Ea on the basis of the diffusion coefficients estimated at different temperatures (Gomez and Mahinpey, 2015). The equation for Arrhenius law is expressed as:
where Af is the pre-exponential factor.
By logarithmic transformation, Eq. (11) is converted into:
The diffusion activation energy Ea is determined by the linear fitting of ln(D) versus 1/T.
4 Results and discussion
4.1 Properties of the coal samples
4.1.1 Mesopore analysis
Low-pressure adsorption–desorption N2 isotherms at 77 K are presented in Fig. 1(a). As plotted in the figure, all the isotherms are type Ⅳ according to the IUPAC classification (Ladavos, 2012). Curve of this type is characteristic of porous solids with distribution of narrow and wide mesopores. In comparison, DL coal exhibits the highest affinity to N2, followed by ZL, GY, and DT coals in sequence. Thus, the adsorption capacity of N2 is considerably reduced with increasing coal rank. In addition, the isotherms are characterized by a conspicuous adsorption–desorption hysteresis loop within relative pressures above 0.45. The appearance of hysteresis loop implies that evaporation is not coinciding with condensation process, which is usually explained by the theory of capillary condensation (Ustinov, 2009). The shape of hysteresis loop for DL coal and GY coal agree with de Boer type B and may indicate the distribution of slit shaped pores, whereas ZL coal and DT coal exhibit type C hysteresis loop and may reflect the distribution of wedge-shaped pores (Boer and Lippens, 1964).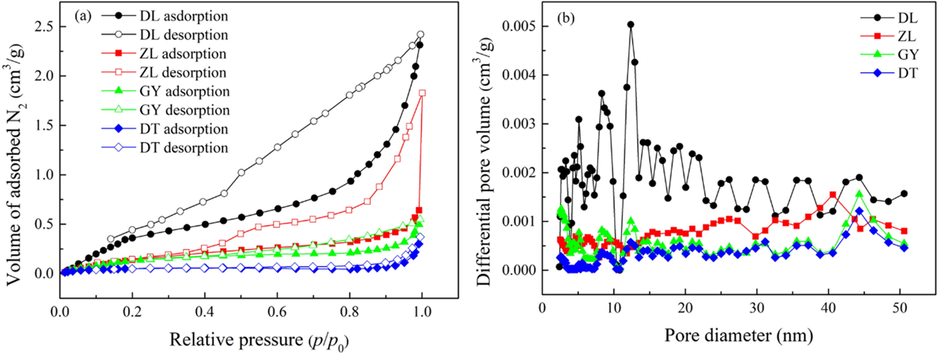
(a) N2 adsorption–desorption isotherms at 77 K, and (b) mesopore size distribution of the samples.
The mesopore size distribution calculated by BJH model is displayed in Fig. 1(b). It is apparent that all the curves exhibit multimodal distribution, indicating that the samples have continuous PSD at the mesopore scale. DL coal has the richest distribution of mesopore, with a prominent band at around 12 nm. The distribution of mesopore for ZL coal has a prominent band at around 41 nm, while GY coal and DT coal are subjected to prominent bands at around 44 nm.
The pore parameters determined by N2 adsorption–desorption are summarized in Table 2. The BET surface area and the DFT total pore area of the coal samples are within the ranges of 0.586 ∼ 1.498 m2·g−1 and 0.108 ∼ 0.764 m2·g−1, respectively. Moreover, the DFT total pore volume and BJH adsorption pore volume are within the ranges of 1.607 ∼ 6.831 × 10⁻³ cm3·g−1 and 0.660 ∼ 2.267 × 10⁻³ cm3·g−1, respectively, while BJH average pore width is within the range of 10.92 ∼ 23.12 nm. In comparison, either BET surface area or pore volume is significantly reduced with an increase of coal rank. These observations confirm the finding of Okolo et al. (2015) that polycondensation reactions during the coalification process may lead to the translations of mesopores into micropores. This effect may significantly change the microstructure of coalbeds, leading to a decrease in mesopore volume for higher-ranked coals. Actually, N2 molecule is not able to penetrate the microporosity of coal matrix due to the activated diffusion effect and pore shrinkage of coal at 77 K (Mastalerz et al., 2012; Erdogan and Kopac, 2019). As a result, the BET surface area and pore volume may be much lower than reality.
Parameter
ZL
DL
GY
DT
BET surface area (m2·g−1)
1.498
0.744
0.616
0.586
DFT total pore area (m2·g−1)
0.764
0.463
0.382
0.108
DFT total pore volume (×10-3 cm3·g−1)
6.831
4.329
2.847
1.607
BJH adsorption pore volume (×10-3 cm3·g−1)
2.267
1.362
1.641
0.660
BJH average pore width (nm)
18.16
23.12
18.19
10.92
4.1.2 Micropore analysis
Low-pressure adsorption isotherms of CO2 at 273 K are illustrated in Fig. 2(a). According to IUPAC classification, all the curves belong to type Ⅰ, where the characteristic of adsorption is restricted to monolayer (Mastalerz et al., 2008). Overall, the uptake capacity of CO2 on each of the sample is much higher than N2, which is correlated with the higher binding affinity of coal with CO2 molecules than N2 molecules (Zhao et al., 2016). Considering the coal rank, there is a poor association between CO2 adsorption and coal maturity, where GY coal (low-volatile bituminous) is proved to be subjected to the highest CO2 adsorption capacity.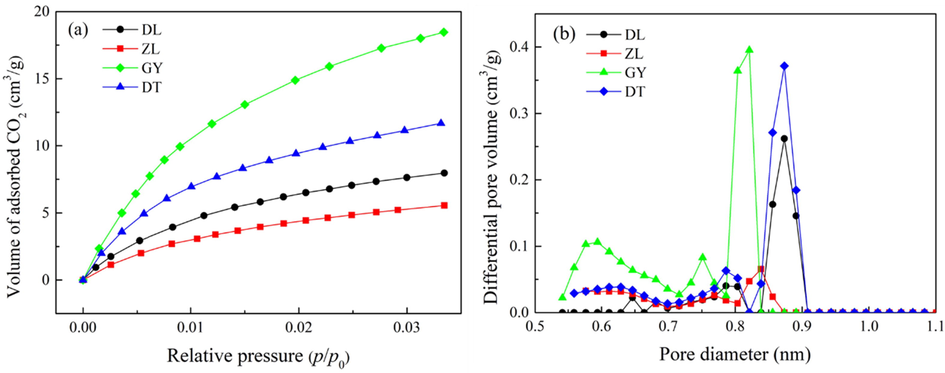
(a) CO2 adsorption isotherms on the coal samples at 273 K, and (b) micropore size distributions of the coal samples.
The micropore size distribution estimated by DFT method is plotted in Fig. 2(b). Interestingly, DL, ZL and DT coals exhibit unimodal distribution with prominent bands at approximately 0.89 nm, 0.85 nm and 0.90 nm, respectively. To the contrary, GY coal exhibits multimodal distribution with prominent bands at approximately 0.60 nm, 0.75 nm, and 0.86 nm. These results confirm that a higher connectivity of micropore is expected for high-ranked coals compared to low-ranked coals, as a consequence of the conversion of closed-pore into open-pore porosity during the coalification process (Zhao et al., 2016).
The micropore parameters determined by CO2 are shown in Table 3. As depicted in the table, the D–R SSA, D–A SSA and DFT total pore area are varied for different rank coals, ranging from 54.54 ∼ 222.42 m2·g−1, 45.77 ∼ 160.87 m2·g−1 and 33.48 ∼ 83.24 m2·g−1, respectively. Interestingly, these values are much higher than that determined by N2. This is because the measurement of CO2 adsorption was conducted at a higher temperature (273 K), thus overcoming the restriction of activated diffusion for N2 molecules (77 K), allowing CO2 molecules to access the finest porosity (Guo et al., 2019). The micropore volume of GY coal (low-volatile bituminous) is larger than any other coal sample, suggesting that the pore system for this coal rank is less constricted among the coal samples.
Parameter
DL
ZL
GY
DT
D-R surface area (m2·g−1)
98.71
54.54
222.4
120.38
D-A surface area (m2·g−1)
61.14
45.77
160.9
74.35
DFT total pore area (m2·g−1)
59.60
33.48
83.24
61.89
Micropore volume (cm3·g−1)
0.022
0.022
0.067
0.026
Mesopore volume (10-3cm3·g−1)
6.831
4.329
2.847
1.607
4.1.3 Surface chemistry analysis
The surface chemistry of the coal samples determined by FTIR analysis is presented in Fig. 3, where each peak in the FTIR spectra represents a distinct type of surface functional group (Mastalerz et al., 2010). As depicted in Fig. 3, the coal samples are characterized by heterogeneous chemical properties containing multiple types of surface functional groups. Each of the curve exhibits a broad hydroxyl distribution with a prominent band at approximately 3450 cm−1. This group is derived from the surface hydroxyls under the influence of adsorbed water molecules (Liu et al., 2018). The peaks at wave numbers of approximately 1600 cm−1 is an indication of amide carbonyl group (–C = O), while the prominent bands at approximately 1000 cm−1 are contributed to clays and mineral matter (Li et al., 2015). In comparison, DL coal (lignite) is characterized by stronger FTIR adsorption peaks than the other coal samples, suggesting that low-ranked coals possess higher density of surface functional groups than high-ranked coals.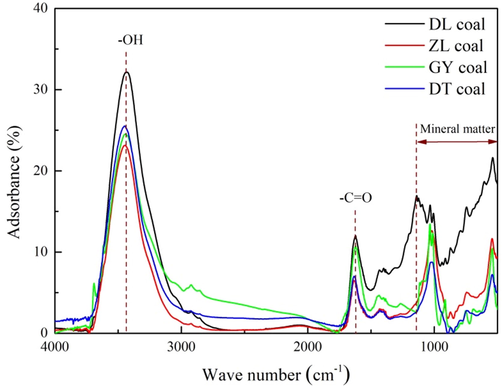
FTIR spectra of the coal samples.
4.2 Water vapor adsorption equilibrium
4.2.1 Adsorption isotherms
The experiments of water vapor adsorption were performed at temperatures of 288, 298 and 308 K. The obtained adsorption isotherms are shown in Fig. 4. It is apparent that the profile of all the isotherms is very similar, corresponding to type Ⅱ of the IUPAC classification (Ladavos et al., 2012). Curves of this form are characteristics of carbonaceous materials with medium density of surface functional groups (Nishino, 2001). The isotherms reveal three separate regions, each of which is the indication of a specific adsorption mechanism. At relative pressures below 0.2, a rapid increase of uptake capacity is observed, due to the strong binding forces between water molecule and the surface functional groups. With the increase of relative pressure, the surface functional groups are gradually occupied and water molecule starts to interact with pre-adsorbed water molecules in the form of clusters. This is shown as linear increases in the middle part of the isotherms. At the final stage of the isotherm (p/p0 greater than 0.6), there is a sudden increment in uptake capacity, which is related to the formation of larger clusters and capillary condensation (Li et al., 2019).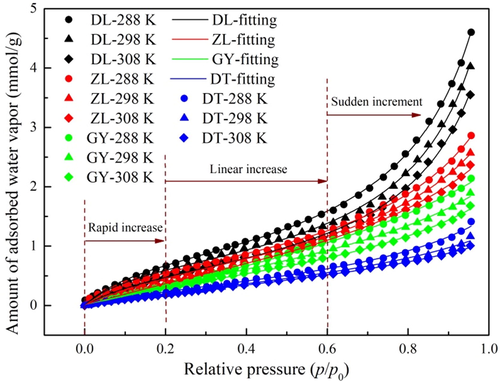
Water vapor adsorption isotherms and fitting of the modified BET model to the experimental data.
Further, Fig. 4 shows that there is a negative correlation between water vapor uptake capacity and temperature, particularly at higher relative pressures. According to Horikawa et al. (2013), water molecule is subjected to higher kinetic energy at a higher temperature and is prone to be released from the adsorbed phase. The validity of this assumption is verified by the results of this study. Regarding coal rank, it is clear that the equilibrium uptake capacity of DL coal is the highest, followed by ZL, GY, and DT coals in sequence, thus pointing out that the affinity of coal matrix with water vapor is inversely proportional to the degree of coalification. According to Mccutcheon et al. (2001), this is because the number of surface functional groups decreases with the increasing coal maturity, leading to lower average bond energy between water molecules and coal matrix. Combining these results with porosity and surface chemistry analysis, it is inferred that surface chemistry is a dominant factor governing water vapor adsorption. Instead, only a portion of the pore volume is filled with water molecules even at the saturation pressure, which is shown as a sudden increment in water vapor uptake capacity as relative pressures larger than 0.6.
4.2.2 Modeling of the adsorption isotherms
A comparison between the experimental data and the fitting values with modified BET model is shown in Fig. 4, and the parameters under different experimental conditions are summarized in Table 4. Obviously, the modified BET model provides good fits to the experiment data with high correlation coefficients (R2 greater than 0.99) in all the cases. Thereby, the modified BET model is applicable to the representation of water vapor adsorption data. As depicted in Table 4, the monolayer capacity (n0) reduces with the increase of temperature, suggesting that the significance of primary sites decreases with temperature. This is in agreement with the existing studies (Do et al., 2009; Busch and Gensterblum, 2011; Švábová et al., 2011). Meanwhile, the calculated values of n0 are decreased with coal rank, which is agree with the assumption that higher density of surface functional groups may promote the affinity of water molecule with coal (Arif et al., 2017). In comparison, energies of the primary sites (K1) are around one magnitude larger than the secondary sites (K2), indicating that the binding of coal-water needs more energy than the binding between water molecules.
Sample
n0 (mmol·g−1)
K1
K2
R2
288 K
298 K
308 K
288 K
298 K
308 K
288 K
298 K
308 K
288 K
298 K
308 K
DL
0.851
0.728
0.670
7.837
8.521
7.901
0.858
0.865
0.859
0.9995
0.9987
0.9991
ZL
0.798
0.768
0.649
6.282
3.985
2.182
0.775
0.744
0.677
0.9988
0.9989
0.9991
GY
0.625
0.614
0.536
2.345
2.293
2.853
0.579
0.651
0.684
0.9991
0.9991
0.9990
DT
0.486
0.464
0.445
3.383
2.529
2.367
0.727
0.658
0.626
0.9967
0.9962
0.9993
4.3 Water vapor adsorption thermodynamics
4.3.1 Surface potential (Ω)
Fig. 5 illustrates the surface potential (Ω) of water vapor on the coal samples at elevated temperatures. Obviously, Ω is negative under all experimental conditions, and the calculated values of Ω are decreased with the increase of relative pressure. Ω represents a criterion of work needed to attain adsorption equilibrium, where the higher values of Ω may lead to the greater adsorptive capacities of water vapor (Song et al., 2017). Accordingly, the reduction of Ω with relative pressure can be explained by the fact that more isothermal work is required to load water molecules onto secondary sites than primary sites. In addition, the values of Ω are close to zero at the initial stages of water vapor adsorption. This is because the chemical potential of water molecules contacted with coal is equal to that uncontacted with coal at low surface coverage (Ridha and Webley, 2010).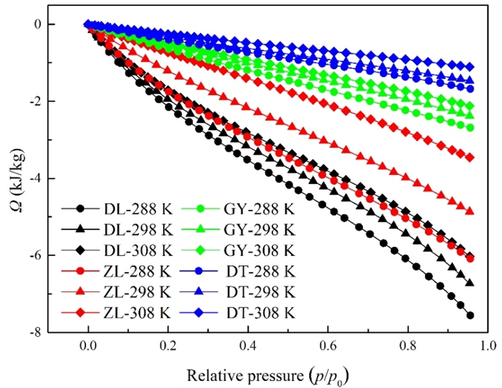
Surface potentials of water vapor at elevated temperatures.
According to Fig. 5, Ω exhibits a notable increase upon a temperature increase from 288 K to 308 K. This trend is consistent with decrease of water vapor uptake capacity with an increase in temperature. Therefore, higher temperature not only contributes to the loss of water vapor uptake capacity, but also lowers the work needed to attain equilibrium. Interestingly, there is a positive correlation between the surface potential of water vapor and coal rank. This observation may probably be ascribed to variations of surface chemistry and pore structure among different rank coals as addressed in Section 4.1. In coalification, the homogeneity of coal structure is gradually promoted, and therefore less work is required for the fluctuation of water molecules (Wang et al., 2014).
4.3.2 Gibbs free energy change (ΔG)
Gibbs free energy change (ΔG) represents the isothermal work required to load the molecules to a definite level under isobaric conditions, which can be used as a criterion for evaluating the spontaneity and equilibrium of adsorption (Zhou et al., 2011). The estimated ΔG of water vapor as a function of relative pressure is shown in Fig. 6. It is noticed that ΔG is negative in all cases, suggesting that water vapor adsorption is spontaneous under all the experimental conditions. ΔG first decreases with relative pressure, exhibiting minimum under medium relative pressures (p/p0 = 0.3 ∼ 0.5), and then increases significantly at higher relative pressures. This parabolic behavior indicates that the interaction of water vapor with primary sites has a higher degree of spontaneity than that of secondary sites. According to Mofarahi and Bakhtyari (2015), the higher degree of spontaneity corresponds to screened active sites. Considering the coal rank, the estimated values of ΔG for higher-ranked coals are much larger than lower-ranked coals, indicating that water molecules need lower isothermal work to be loaded on higher-ranked coal than lower-ranked coal.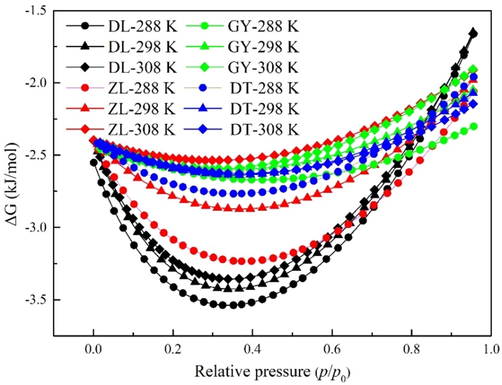
Gibbs free energy change of water vapor at different temperatures.
4.3.3 Isosteric heat of adsorption (Qst) and enthalpy change (ΔH)
Isosteric heat of adsorption Qst (−ΔH, enthalpy change) is a significant parameter to reveal the interplay among gases or vapors and a porous system (Duan et al., 2016). The estimated isosteric heat of adsorption and entropy change is shown in Fig. 7. Interestingly, either Qst or ΔH differs as a function of surface coverage in isothermal conditions. Indeed, the isosteric heat of adsorption uniformly decreased with an increase of surface coverage, indicating a high level of coal surface heterogeneity. This observation is in coincidence with the classification of primary and secondary sites adsorption as discussed in Section 4.2. Accordingly, the higher Qst in lower surface coverage is attributed to the interaction of water molecules with primary sites, while the decreased Qst in higher uptake stage may result from bonding of water molecules on secondary sites (i.e., on top of the previously adsorbed water molecules or within the hydrophobic pore). This result is agreed with the assumption that water molecules can form stronger bonds with primary sites than secondary sites.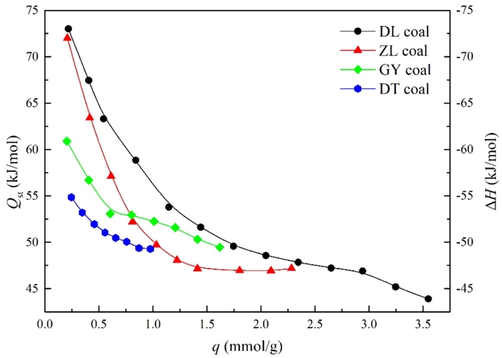
Isosteric heat of adsorption and enthalpy change of water vapor.
Fig. 7 shows that Qst are within the range of 43 ∼ 75 kJ·mol−1 for temperatures of 288 ∼ 308 K, which is larger than the heat of condensation (43.99 kJ·mol−1 at 298 K), except for DL coal at high loadings (above 3.25 mmol·g−1). In addition, isosteric heat of water vapor is larger than methane on a similar ranked coal, which is usually below 20 kJ·mol−1 (Du et al., 2021). The observed discrepancy is considered to result from the formation of hydrogen bonds, which is much larger than van der Waals forces between non-polar molecules and inner pore space. Therefore, water molecules are subjected to higher affinity with surface functional groups, forcing methane molecules to adsorb on lower energy sites with the presence of water. Interestingly, the isosteric heat seems to be a function of the degree of coalification. This effect is observed particularly at the initial stage, where adsorption on primary sites is predominantly. As stated by Dang et al. (2017), surface functional groups are close to each other for lower-ranked coal, facilitating the formation of hydrogen bonds and water clusters.
4.3.4 Entropy change (ΔS)
Entropy is a criterion for evaluating the degree of irregularity or the rearrangement patterns of a thermodynamic system (Mofarahi and Bakhtyari, 2015). The entropy change (ΔS) represents the interactions of adsorbate − adsorbent and the restricted translation of the adsorbate molecules (Duan et al., 2016). The estimated ΔS as a function of water vapor uptake are shown in Fig. 8. It is noted that ΔS is negative under all the experimental conditions, suggesting that the distribution of water molecule is transmitted from a random state to a relatively ordered state in the process of adsorption. Thus, the adsorption water vapor creates a considerable reduction in the degree of freedom of the water-coal system, which is considered to be associated with the generation of more stable rearrangements on coal surface (Du et al., 2022). Nevertheless, there does not appear to be any significant increment in ΔS with the increase of temperature, indicating that a considerable amount of water molecules are trapped in the pore space as a free form instead of binding on coal surface.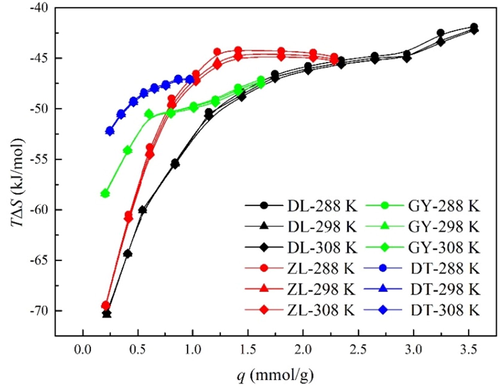
Entropy change of water vapor at different temperature.
The calculated ΔS vary from − 243.95 to − 137.16 J·(mol·K)-1 for a temperature range of 288 ∼ 308 K. The values of ΔS increase significantly as water vapor uptake increases, indicating a higher level of heterogeneity of coal surface. This decline follows from the assumption that water molecules are only partly trapped in the pores, some three-dimensional translational entropy is still existed. Du et al. (2021) have reported that the entropy changes of methane adsorption on different rank coals are within the ranges of − 82 to − 87 J·(mol·K)-1 and − 6.10 to − 62.5 J·(mol·K)-1, respectively. In comparison, ΔS of water vapor is much smaller than methane, suggesting that the degree of irregularity of methane in coalbeds is much higher than water vapor. It is thus concluded that the binding force of water vapor with coal matrix is much stronger than methane, which may probably be derived from the stronger interaction of water molecules with surface functional groups.
4.4 Adsorption kinetics of water vapor
4.4.1 Adsorption kinetic isotherms
For numerical modeling of adsorption kinetics, only the initial adsorption period was taken into account, where water vapor adsorbs at a higher rate (Liu et al., 2023). From unipore model (Eq. (10)), the estimated adsorption kinetic data at 288, 298, 308 K are plotted as function of time square for the initial stage of adsorption (Vt/V∞<0.5), and the fitting results are depicted in Fig. 9. It is found that unipore model can provide good fits to water vapor adsorption kinetics with correlation coefficients (R2) exceed 0.99 in all the cases. The determined effective diffusivity (D/rp2) and diffusion coefficient (D) are shown in Table 5. It is found that the estimated D/rp2 and D is around 10-5 ∼ 10-6 s−1 and 10-11 ∼ 10-12 m2·s−1, respectively, which is on the same order of magnitude with a previous study by Charrière and Behra (2010). The effective diffusivity of methane on different rank coals has been estimated at around 10-4 s−1 (Naveen et al., 2017). These are much higher than the values determined in the present study, which is partly attributed to the discrepancies of the equilibrium pressures of water vapor (0.34 ∼ 1.12 kPa) and methane (3.0 ∼ 8.0 MPa). In addition, the higher affinity between water molecules and coal matrix may be another influencing factor. In in-situ coal seam, a considerable amount of the pore space is filled with water molecules and the surface of coal becomes more hydrophilic (Charrière and Behra, 2010). Thereby, the presence of water may hinder methane molecules to the inner pore space of coalbeds, thus negatively affect the adsorption kinetics of methane.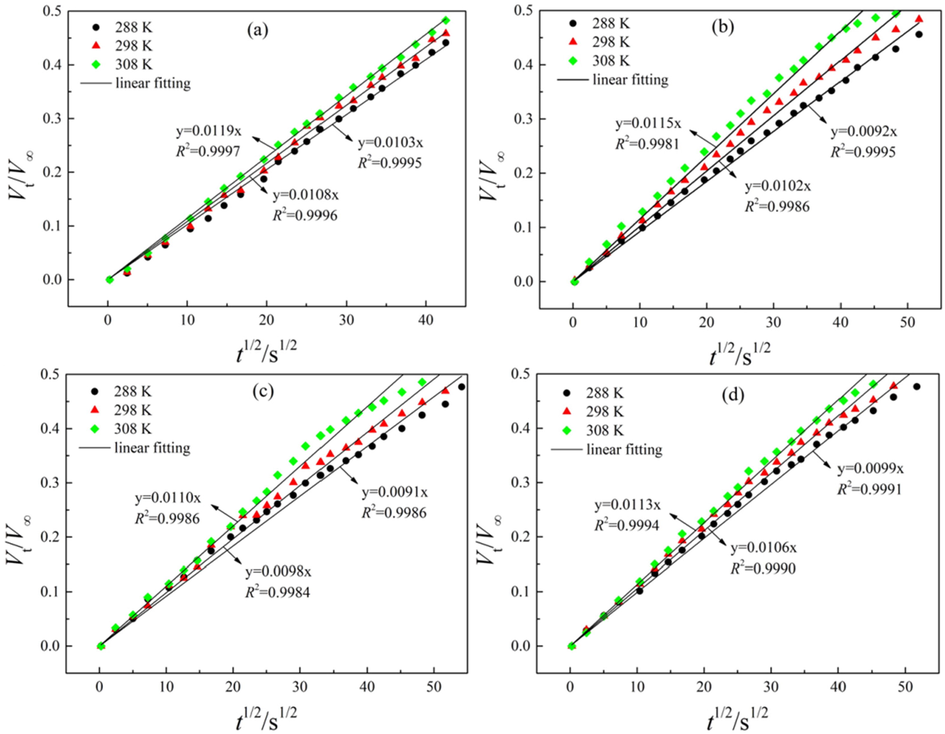
Fitting results of adsorption kinetic data at different temperatures: (a) DL, (b) ZL, (c) GY, (d) DT.
Sample
D/rp2 (10-6·s−1)
D (10-12 m2·s−1)
288 K
298 K
308 K
288 K
298 K
308 K
DL
9.258
10.179
12.358
4.394
4.831
5.865
ZL
7.386
9.079
11.540
3.505
4.309
5.477
GY
7.227
8.381
10.559
3.430
3.978
5.011
DT
8.553
9.805
11.143
4.059
4.654
5.289
As depicted in Table 5, the values of both D/rp2 and D are increased with temperature. This can be explained in terms of molecular kinetics change of water molecules with temperature. As temperature increases, the kinetic energy of water molecule raises, and the frequency and amplitude of molecular vibration enhances. In this process, the strength of irregular thermal motion of water molecule is expanded, leading to higher adsorption kinetics (Du et al., 2022). With respect to coal rank, diffusion coefficient for DL coal is the largest, followed by ZL and DT and GY coals in sequence. Accordingly, diffusion coefficient is reduced with coal rank. This trend is in good agreement with the change of surface functional group density with coal rank, but it is difficult to find any correlation between diffusion coefficients and pore structure. Therefore, surface chemistry may probably be the leading factor for water vapor adsorption kinetics under the operating pressure (p/p0 = 0.2).
4.4.2 Diffusion activation energy (Ea)
From Arrhenius law (Eq. (12)), diffusion coefficients of water vapor ln (D) were plotted as function of 1/T. The fitting process is described in Fig. 10, and the estimated diffusion activation energy Ea are plotted in Table 6. Obviously, Arrhenius law fits the adsorption kinetic data well with the R2 values all larger than 0.90. Diffusion activation energy Ea for ZL coal is larger than the other coals, indicating that the movement of water molecules within the pore space of ZL coal needs to overcome a higher potential barrier. Charrière et al. (2010) have reported that Ea is governed by kinetic diameter of gas molecule, pore morphology, and surface coverage. Therefore, it is reasonable to assume that the morphology of the pore system in ZL coal (high-volatile bituminous) is more complex and less inter-connected than the other rank of coals.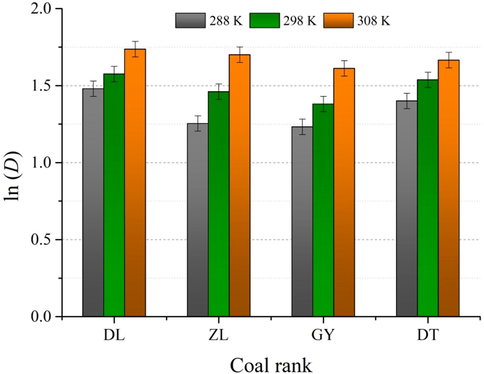
Estimation of the diffusion activation energy Ea using Arrhenius law.
Parameter
DL
ZL
GY
DT
Ea (kJ·mol−1)
10.60
16.44
13.94
5.10
R2
0.9769
0.9981
0.9896
0.9055
5 Conclusions
In this study, the combined effects of pore structure and surface chemistry on water vapor adsorption were studied. The main conclusions are summarized as follows:
Water vapor adsorption depends on surface chemistry, but there is a poor correlation between pore structure and water vapor uptake capacity.
The modified BET model can provide good fits to the adsorption isotherms at all relative pressures, and the monolayer adsorption capacity of water vapor decreases with coal rank.
Water vapor needs lower work to attain equilibrium on higher-ranked coal. Also, the binding affinity of water molecule is stronger with primary sites than secondary sites.
The diffusion coefficient of water vapor is at around 10-12 m2·s−1 and increases with temperature but decreases with coal rank. Moreover, the diffusion activation energy for high-volatile bituminous is higher than the other coals.
Finally, it should be noted that the adsorbate selected for the present study was pure water vapor, which cannot directly reflect the effects of water on methane adsorption. Therefore, further study concerning the competitive adsorption of water vapor and methane is still needed for enhancing the recovery of CBM with the presence of water.
Data Availability
The data applied to support the results in this study are available from the corresponding author upon request.
Acknowledgements
This study is financially supported by the Funding for school-level research projects of Yancheng Institute of Technology (Grant No. xjr2020036), Postdoctoral Science Foundation of China (Grant No. 2020 M673152), Yunnan Fundamental Research Projects (Grant No. 202101BE070001-039), and Yunnan Provincial Department of Education Science Research Fund Project (Grant No. 2022 J0055).
References
- Influence of surface chemistry on interfacial properties of low to high rank coal seams. Fuel. 2017;194:211-221.
- [Google Scholar]
- Studies on pore systems in catalysts II. The shapes of pores in aluminum oxide systems. J. Catal.. 1964;3:38-43.
- [Google Scholar]
- Correlation of type II adsorption isotherms of water contaminants using modified BET equations. Colloid Interfac. Sci.. 2022;46:100557
- [Google Scholar]
- CBM and CO2-ECBM related sorption processes in coal: A review. Int. J. Coal Geol.. 2011;87(2):49-71.
- [Google Scholar]
- Effect of pressure and temperature on diffusion of CO2 and CH4 into coal from the Lorraine basin (France) Int. J. Coal Geol.. 2010;81(4):373-380.
- [Google Scholar]
- Water adsorption characteristic and its impact on pore structure and methane adsorption of various rank coals. Environ. Sci. Pollut. R.. 2022;29(20):29870-29886.
- [Google Scholar]
- Mechanisms of shale gas adsorption: Evidence from thermodynamics and kinetics study of methane adsorption on shale. Chem. Eng. J.. 2019;361:559-570.
- [Google Scholar]
- The effect of pore structure and gas pressure upon the transport properties of coal: A laboratory and modeling study. 2. Adsorption rate modeling. Fuel. 1999;78:1345-1362.
- [Google Scholar]
- Coal bed methane sorption related to coal composition. Int. J. Coal Geol.. 1998;35:147-158.
- [Google Scholar]
- A systematic experimental and modeling study of water adsorption/desorption behavior in organic-rich shale with different particle sizes. Chem. Eng. J.. 2021;426:130596
- [Google Scholar]
- Molecular simulation of CO2/CH4 adsorption in brown coal, effect of oxygen-, nitrogen-, and sulfur-containing functional groups. Appl. Surf. Sci.. 2017;423:33-42.
- [Google Scholar]
- Adsorption of chromium (VI) and iron (III) ions onto acid-modified kaolinite: Isotherm, kinetics and thermodynamics studies. Arab. J. Chem.. 2021;14(4):103064
- [Google Scholar]
- A new adsorption-desorption model for water adsorption in activated carbon. Carbon. 2009;47(6):1466-1473.
- [Google Scholar]
- CO2 and CH4 adsorption on different rank coals, A thermodynamics study of surface potential, Gibbs free energy change and entropy loss. Fuel. 2021;283:118886
- [Google Scholar]
- Investigation into the adsorption of CO2, N2 and CH4 on kaolinite clay. Arab. J. Chem.. 2022;15(3):103665
- [Google Scholar]
- Adsorption equilibrium of CO2 and CH4 and their mixture on Sichuan basin shale. Energ. Fuel. 2016;30(3):2248-2256.
- [Google Scholar]
- Adsorption behavior of alcohol vapors on Zonguldak-Karadon coal derived porous carbons. Energ. Source Part A. 2019
- [CrossRef] [Google Scholar]
- Highly effective activated carbons from Turkish-Kozlu bituminous coal by physical and KOH activation and sorption studies with organic vapors. Int. J. Chem. React. Eng.. 2019;17(5):20180071.
- [Google Scholar]
- A new model to estimate CO2 coal gasification kinetics based only on parent coal characterization properties. Appl. Energ.. 2015;137:126-133.
- [Google Scholar]
- Experimental investigation on coal pore and fracture characteristics based on fractal theory. Powder Technol.. 2019;346:341-349.
- [Google Scholar]
- A new adsorption–desorption model for water adsorption in porous carbons. Carbon. 2011;49(2):416-424.
- [Google Scholar]
- Effects of temperature on water adsorption on controlled microporous and mesoporous carbonaceous solids. Carbon. 2013;56(6):183-192.
- [Google Scholar]
- Effect of ammonia and boron modifications on the surface and hydrogen sorption characteristics of activated carbons from coal. Int. J. Hydrog. Energ.. 2020;45(17):10494-10506.
- [Google Scholar]
- The BET equation, the inflection points of N2 adsorption isotherms and the estimation of specific surface area of porous solids. Micropor. Mesopor. Mat.. 2012;151:126-133.
- [Google Scholar]
- Surface properties of pulverized coal and its effects on coal mine methane adsorption behaviors under ambient conditions. Powder Technol.. 2015;270:278-286.
- [Google Scholar]
- Coal structure and its implications for coalbed methane exploitation: A review. Energ. Fuel. 2021;35(11):86-110.
- [Google Scholar]
- Molecular simulation study on the effect of coal rank and moisture on CO2/CH4 competitive adsorption. Energ. Fuel. 2019;33(9):9087-9098.
- [Google Scholar]
- Interactions of multiple processes during CBM extraction: A critical review. Int. J. Coal Geol.. 2011;87(3–4):175-189.
- [Google Scholar]
- Adsorption capacity, adsorption potential and surface free energy of different structure high rank coals. J. Petrol Sci. Eng.. 2016;146:856-865.
- [Google Scholar]
- Surface properties and pore structure of anthracite, bituminous coal and lignite. Energies. 2018;11:1502.
- [Google Scholar]
- Supercritical CO2 exposure-induced surface property, pore structure, and adsorption capacity alterations in various rank coals. Energies. 2019;12:3294.
- [Google Scholar]
- Effects of supercritical CO2 exposure on diffusion and adsorption kinetics of CH4, CO2 and water vapor in various rank coals. Arab. J. Chem.. 2023;16:104454
- [Google Scholar]
- Adsorption and diffusion characteristics of CH4, CO2, and N2 in micropores and mesopores of bituminous coal. Molecular dynamics. Fuel. 2021;292:120268
- [Google Scholar]
- Current status and effective suggestions for efficient exploitation of coalbed methane in China: A review. Energ. Fuel. 2021;35(11):9102-9123.
- [Google Scholar]
- Meso- and micropore characteristics of coal lithotypes, implications for CO2 adsorption. Energ. Fuel. 2008;22:4049-4061.
- [Google Scholar]
- Coal lithotypes before and after saturation with CO2, insights from micro- and mesoporosity, fluidity, and functional group distribution. Int. J. Coal Geol.. 2010;83(4):467-474.
- [Google Scholar]
- Porosity of coal and shale: Insights from gas adsorption and SANS/USANS techniques. Energ. Fuel. 2012;26:5109-5120.
- [Google Scholar]
- Kinetics of water adsorption/desorption on bituminous coals. Energ. Fuel. 2001;15(6):1387-1395.
- [Google Scholar]
- Characterization of water adsorbed on bituminous coals. Energ. Fuel. 2003;17(1):107-112.
- [Google Scholar]
- Experimental investigation and thermodynamic modeling of CH4/N2 adsorption on zeolite 13X. J. Chem. Eng. Data. 2015;60(3):683-696.
- [Google Scholar]
- Sorption kinetics of CH4 and CO2 diffusion in coal: Theoretical and experimental study. Energ. Fuel. 2017;31(7):6825-6837.
- [Google Scholar]
- Adsorption of water vapor and carbon dioxide at carboxylic functional groups on the surface of coal. Fuel. 2001;80(5):757-764.
- [Google Scholar]
- Comparing the porosity and surface areas of coal as measured by gas adsorption, mercury intrusion and SAXS techniques. Fuel. 2015;141:293-304.
- [Google Scholar]
- Macromolecular and pore structures of Chinese tectonically deformed coal studied by atomic force microscopy. Fuel. 2015;139:94-101.
- [Google Scholar]
- Estimation of Gas Adsorption Capacity in Coal: A Review and an Analytical Study. Int. J. Coal Prep. Util.. 2012;32(1):25-55.
- [Google Scholar]
- Gas diffusion behavior of coal and its impact on production from coalbed methane reservoirs. Int. J. Coal Geol.. 2011;86(4):342-348.
- [Google Scholar]
- Development of the micro- and ultramicroporous structure of coals with rank as deduced from the accessibility to water. Fuel. 2005;84(12–13):1645-1652.
- [Google Scholar]
- Entropic effects and isosteric heats of nitrogen and carbon dioxide adsorption on chabazite zeolites. Micropor. Mesopor. Mat.. 2010;132(1–2):22-30.
- [Google Scholar]
- Equilibrium and kinetics of water adsorption in carbon molecular sieve. Theory and experiment. Langmuir. 2004;20(20):8681-8687.
- [Google Scholar]
- Water adsorption and desorption of upgraded Brown coal. Part 1: Isotherms of adsorption and desorption. Energ. Fuel. 2014;28(8):4986-4992.
- [Google Scholar]
- Adsorption equilibrium and thermodynamics of CO2 and CH4 on carbon molecular sieves. Appl. Surf. Sci.. 2017;396:870-878.
- [Google Scholar]
- Validation of using a modified BET model to predict the moisture adsorption behavior of bituminous coal. Int. J. Coal Prep. Util.. 2016;36(1):28-43.
- [Google Scholar]
- Characterization of four hydrophilic sites in bituminous coal by ionic thermal current measurements. Fuel. 1993;72(1):13-18.
- [Google Scholar]
- Water vapor sorption on marcellus shale: measurement, modeling and thermodynamic analysis. Fuel. 2017;209(1):606-614.
- [Google Scholar]
- Development of a multi-mechanistic, dual-porosity, dual-permeability, numerical flow model for coalbed methane reservoirs. J. Nat. Gas Sci. Eng.. 2012;8:121-131.
- [Google Scholar]
- Modeling of N2 adsorption in MCM-41 materials, hexagonal pores versus cylindrical pores. Langmuir. 2009;25(13):7450-7456.
- [Google Scholar]
- Towards a better understanding of water adsorption hysteresis in activated carbons by scanning isotherm. Carbon. 2016;96:753-758.
- [Google Scholar]
- Influence of coalification on the pore characteristics of middle high rank coal. Energ. Fuel. 2014;28(9):5729-5736.
- [Google Scholar]
- Effect of water occurrences on methane adsorption capacity of coal: A comparison between bituminous coal and anthracite coal. Fuel. 2020;266:117102
- [Google Scholar]
- A comparative evaluation of coal specific surface area by CO2 and N2 adsorption and its influence on CH4 adsorption capacity at different pore sizes. Fuel. 2016;183:420-431.
- [Google Scholar]
- Thermodynamic analysis of competitive adsorption of CO2 and CH4 on coal matrix. J. China Coal Soc.. 2011;36(8):1307-1311.
- [Google Scholar]


