

Translate this page into:
Comparison of liquid chromatography with fluorescence detection to liquid chromatography-mass spectrometry for amino acid analysis with derivatisation by 6-aminoquinolyl-N-hydroxysuccinimidyl-carbamate: Applications for analysis of amino acids in skin
⁎Corresponding author. rafea.naffa@lasra.co.nz (Rafea Naffa)
-
Received: ,
Accepted: ,
This article was originally published by Elsevier and was migrated to Scientific Scholar after the change of Publisher.
Peer review under responsibility of King Saud University.
Abstract
The analysis of nineteen amino acids found in collagen was optimised using 6-aminoquinolyl-N-hydroxysuccinimidyl-carbamate (AQC) as a derivatisation reagent. The analysis and detection of nineteen AQC-amino acids using fluorescence and mass spectrometry were compared at different mobile phase pH’s and column temperatures. The pH range of the mobile phase was set between 2.7 and 6.0 and column temperatures, 15–60 °C. The majority of amino acids produced a mono-derivatised product with AQC, except cystine, lysine and hydroxylysine which were di-derivatised. Hydroxylysine’s retention time was affected most by changes in the pH, whilst hydroxyproline’s retention time was more affected by column temperature. Hydroxylysine was detected as two diastereomers which were completely resolved. The relative standard deviation of the retention times of AQC-amino acids was less than 1% and the limit of detection (LOD) and limit of quantitation (LOQ) were ranged from (0.05–0.23) µM and (0.07–0.76) µM on fluorescence and (0.02–0.10) µM and (0.06–0.33) µM on mass spectrometry respectively. This method was successfully applied for the quantitation of amino acids in different animal skins.
Keywords
Hydroxyproline
Hydroxylysine
Collagen
6-Aminoquinolyl-N-hydroxysuccinimidyl-carbamate
Fluorescence detection
Mass spectrometry

1 Introduction
Skin has a complex structure composed mainly of collagen and elastin fibres that are associated with proteoglycans (Hulmes, 2008). Collagen is the major structural protein of skin, contributing to its strength and toughness, while elastin maintains normal elasticity and flexibility, whilst the proteoglycans provide viscosity and hydration (Lindahl et al., 2015). Dry skin is made up mainly of 70% of collagen type I and 10% of collagen type III (Covington, 2009; Naffa et al., 2019b). The fibrous collagens are characterised by a helical domain that has a continuous Gly-X-Y repeating sequence where X and Y are frequently proline and 4-hydroxyproline (Hulmes, 2008). Although present in low amounts, lysine and hydroxylysine are essential for stabilizing the structure of the collagen fibrils through the formation of covalent crosslinks. Defects in the biosynthesis of these amino acids often results in diseases (Uitto and Lichtenstein, 1976; Prockop and Guzman, 1977). For example an under-hydroxylation of proline leads to scurvy skin disease and where hydroxylysine-deficient collagen causes Ehlers-Danlos syndrome (Lichtenstein et al., 1973). Therefore sensitive amino acid analysis, particularly hydroxyproline and hydroxylysine is essential for the identification and quantification of collagen in skin.
Cohen and Michaud (1993) synthesised a reactive amine derivatising agent called 6-aminoquinolyl-N-hydroxysuccinimidyl-carbamate (AQC) (Cohen and Michaud, 1993). This reagent reacts rapidly with both primary and secondary amino acids to produce stable derivatives which can be analysed by reversed phase high performance liquid chromatography (RP-HPLC) with fluorescence detection (Cohen and Michaud, 1993). Using excess AQC, derivatisation reaction occurs within seconds at pH 8.5 with minimum matrix interference (Cohen and Michaud, 1993). The excess AQC is hydrolysed to 6-aminoquinoline (AMQ), N-hydroxysuccinimide and carbon dioxide. Cohen’s method had been followed with many improved methods for different applications including human diseases (Ahmetaj-Shala et al., 2018), food (Liu et al., 1995; Bosch et al., 2006), enantiomeric amino acids (Pawlowska et al., 1993), peptides (Deantonis et al., 1994), collagen and gelatines (Frey et al., 1993; Choudhury and Norris, 2005; Azilawati et al., 2014) as well as many others (Oreiro-García et al., 2005; Wang et al., 2008; Sun et al., 2012; Ma et al., 2013; Song et al., 2018).
Although AQC is the most common method for quantitative determination of amino acids in peptides and proteins, the separation of the AQC-derivatised amino acids largely depends on the manufacturing of the column, the surface area and carbon load, column temperature and pH of the buffers (van Wandelen and Cohen, 1997; Cohen, 2001; Murnane et al., 2006; Jaworska et al., 2012; Azilawati et al., 2014; Sharma et al., 2014; Dahl-Lassen et al., 2018). The analysis of hydroxylysine, a unique amino acid in collagen, is proven to be difficult because it is found in very small amounts in skin and has two diastereomers that elute close to other amino acids (Cohen and van Wandelen, 1997; Choudhury and Norris, 2005). Although, Cohen and van Wandelen, (1997) had obtained a resolution of both hydroxylysine diastereomers, a complicated quaternary gradient proved to be necessary (van Wandelen and Cohen, 1997). Additionally, Choudhury and Norris, 2005 used binary gradients that needed long column conditioning and run times (>60 min) as well as high buffer concentration (140 mM of sodium acetate). Both Cohen’s and Choudhury’s methods lacked the use of an internal standard and utilised a complicated buffer system containing sodium acetate which made it unsuitable for mass spectrometry (Cohen and van Wandelen, 1997; van Wandelen and Cohen, 1997; Choudhury and Norris, 2005).
In this study, the effect of the column temperature and pH of the buffers on the separation of AQC derivatised amino acid using a RP-HPLC. Their detection sensitivity on both fluorescence and mass spectrometry was then investigated. Hydroxyproline and hydroxylysine amino acids found mainly in collagen were given more attention. This study provided essential information about the flexibility of the AQC method and was used to develop a method that is suitable for both fluorescence and mass spectrometry detections. It showed the feasibility of running simultaneous fluorescence and MS detection and allowed an easy method transfer between them. The developed AQC method was applied to skins taken from different animal species and was shown to be fast, accurate, sensitive and could be successfully transferred between fluorescence and MS detections using the same chromatographic conditions.
2 Experimental
2.1 Chemicals & materials
Amino acid standards were acquired from Sigma Aldrich (St. Louis, MO, USA). 6-aminoquinolyl-N-hydroxysuccinimidyl carbamate (AQC) was purchased from SYNCHEM (Altenburg, Germany). Mass spectrometry grade water and acetonitrile were purchased from Fisher Chemical (Fair Lawn, NJ, USA). Boric acid, Hydrochloric acid and acetic acid were purchased from Panreac (Barcelona, Spain). Ammonium acetate was purchased from Carl Roth (Carl Roth GmbH&Co., Karlsruhe, Germany) and phenol from pure Science (Wellington, New Zealand).
2.2 Preparation of amino acid standards
The concentration of the stock solutions of amino acids was 2.5 mM except for proline and hydroxyproline which were 12.5 mM and for cystine, 1.25 mM. The concentrations of both hydroxylysine diastereomers solutions were 2.5 mM. The stock solutions were diluted to give final amino acid concentrations of 100 µM, except for proline and hydroxyproline which had concentrations of 500 µM and cystine with a concentration of 50 µM. The internal standard norleucine was prepared with a final concentration of 100 µM solution. Norleucine was chosen as an internal standard as it does not occur naturally in skin and its concentration response is linear. It was added to the amino acid and skin solutions to correct for any variations during sample preparation and derivatisation.
2.3 AQC derivatisation of amino acids
Ten µL of either a standard amino acid solution or a skin hydrolysate extract and 10 µL of 100 µM of norleucine were mixed with 75 µL of 0.2 M borate buffer (pH 9.0) and then 5 µL of 1.5 mM AQC, dissolved in acetonitrile was added. The mixture was incubated for one minute at room temperature, then for 15 min at 55 °C. The resultant AQC-derivatized mixture was diluted by adding 900 µL of MS grade water, then centrifuged for 30 min at 14,100g prior to injection in HPLC. The final concentration of each amino acid after derivatisation was 1 µM except for proline and hydroxyproline (5 µM) and cystine (0.5 µM). Further 10-, 100- and 1000-folds dilutions were carried out to give the smallest amino acid concentrations of 10 nM, proline and hydroxyproline 50 nM and cystine 5 nM. Volumes of 1–10 µL were injected on the HPLC.
2.4 Liquid chromatography with fluorescence detection
Amino acid analysis was carried out using a Thermo Fisher UHPLC system equipped with LPG-3400RS Pump and WPS-3000 auto-sampler. Five µL samples were injected on to a Gemini® C18 (150 mm × 4.6 mm, 3 µm and 110 Å) HPLC column which was protected with a guard column. The analysis was performed at different temperatures ranging from 15 °C to 60 °C. Solvent A contained ammonium acetate (5 mM) in water which was adjusted to a pH range from 4.50 and 6.00 using glacial acetic acid. Solvent B contained 60% (v/v) of acetonitrile in water. The optimised gradient was 0.0% solvent B at 0.0 min, 70% solvent B at 20 min, 100% solvent B at 21 min, 100% solvent B at 25 min and 0.0% solvent B at 26 min. Total run time was set for 30 min with a flow rate of 1.0 mL/min. Eluted peaks were monitored using a DAD-3000 (245 nm and 280 nm) and FLD-3400RS fluorescence detector with excitation and emission wavelengths set at 245 nm and 395 nm, respectively.
2.5 Liquid chromatography with mass spectrometry detection
Thermo Fisher UHPLC system equipped with LPG-3400RS Pump, WPS-3000 auto-sampler and Q-Exactive mass spectrometer equipped with heated electrospray ionization (HESI). The same gradient and column were used as above (Section 2.4), however the column outlet was connected to a 4:1 flow splitter before introduction into the mass spectrometer. A capillary temperature of 320 °C and auxiliary gas heater temperature of 350 °C were used. The spray voltage of +3.3 kV and S-lens RF level of 50 V were used. The flow rate of sheath gas (N2) was 10 arbitrary units (a.u.). Positive ion mode was used with a resolution at 70,000 and mass range scanned was 150–600 m/z. All data were processed using Thermo Xcalibur 3.0 software. The repeatability of the retention times for each amino acid was assessed by the relative standard deviation of five consecutive injections and found to be <1% for both fluorescence and mass spectrometry detections.
2.6 Preparation of skin samples
Skin samples of sheep, goat, deer and cow were collected and analysed based on our previous studies (Naffa et al., 2016, 2019a, 2019b, 2019c). In summary a 100 mg sample was placed in an acid washed 6 × 50 mm screw cap (PTFE) borosilicate glass tubes. Five mL of 6 M HCl, containing 3% phenol, was added to the samples. Phenol is used to minimize the destruction of amino acids by oxidation during hydrolysis (Fountoulakis and Lahm, 1998). The samples were then heated at 105 °C for 24 h. After hydrolysis, any undissolved material was removed by filtering through plastic syringes plugged with glass-wool. The acid was removed by SpeedVac (Savant™ SPD131DDA, ThermoFisher) and then dissolved in 1.0 mL of water then diluted 100-fold with water and finally derivatized as above (Section 2.3).
3 Results and discussion
3.1 Mass spectrometry of AQC-derivatised amino acids
The separation of AQC-derivatized amino acids using a Gemini column and a mobile phase composed of binary gradients of sodium acetate and acetonitrile has been reported previously (Choudhury and Norris, 2005). Initially a complex buffer system of sodium acetate (140 mM), sodium azide (7.5 mM), EDTA (0.26 mM) and TEA (17 mM) as an ion pairing agent and solvent B containing 60% acetonitrile in water was used. Next the use of ammonium acetate was preferred over sodium because ammonium acetate is a volatile buffer (Konermann, 2017), and therefore more compatible with mass spectrometry. This was used to detect and confirm the structures of both the monoderivatised and diderivatised AQC-amino acids. Also sodium azide, EDTA and TEA were excluded from the buffer as they suppress the ionisation and significantly affect the performance of the mass spectrometer (Gustavsson et al., 2001; Gosetti et al., 2010). Several ammonium acetate concentrations of 5, 20 and 50 mM were prepared. The different buffer concentrations had slightly changed the separation of the amino acids particularly those with retention times <12 min (data not shown). The lowest ammonium concentration of 5 mM was selected for the rest of the experiment because higher concentrations will have a detrimental effect on the mass spectrometry detection (Constantopoulos et al., 1999).
Since the AQC reagent reacts with amino groups to give urea derivatives, it was expected that all amino acids would produce mono-derivatised products except for lysine, hydroxylysine and cystine producing di-derivatised products (Fig. 1). The presence of AMQ along with the hydrolysis product of AQC had confirmed the complete quantitative conversion of the amino acids under the set reaction conditions.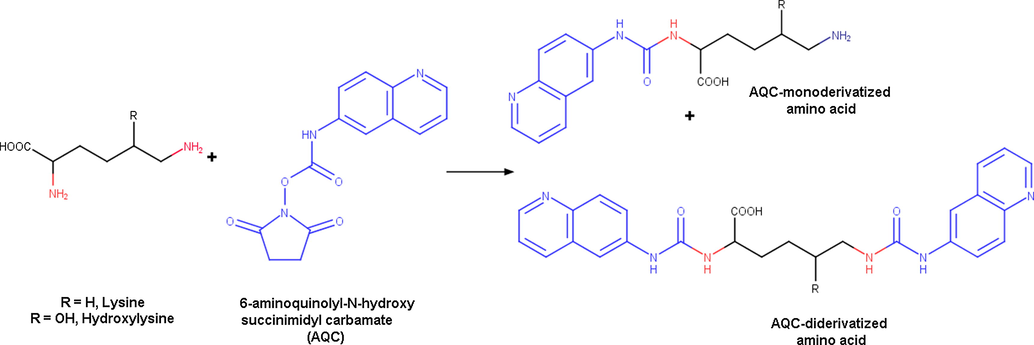
Reaction of lysine and hydroxylysine with AQC reagent producing the mono and di-derivatized products.
The masses of all derivatised amino acids are listed in Table 1. It was found that all amino acids formed mono-derivatised AQC products except for cystine which produced the di-derivatised product. Additionally, lysine and hydroxylysine produced both mono and di-derivatised AQC products (Naffa et al., 2019b). However these mono-derivatised products had shown significantly smaller peaks than those of the di-derivatised products (Naffa et al., 2019b).
Amino acid
Underivatised (m/z)
Monoderivatised (m/z)
Diderivatised (m/z)
Alanine
90.1
260.1
–
Arginine
175.1
345.1
–
Aspartic Acid
134.1
304.1
–
Cystine
241
–
581.1
Glutamic Acid
148.1
318.1
–
Glycine
76.1
246.1
–
Histidine
156.1
326.2
–
Hydroxylysine1
163.1
333.1
503.2
Hydroxylysine2
163.1
333.1
503.2
Hydroxyproline
132.1
302.1
–
Isoleucine
132.1
302.1
–
Leucine
132.1
302.1
–
Lysine
146.1
316.1
487.2
Methionine
150.1
320.1
–
Norleucine
132.1
302.1
–
Phenylalanine
166.1
336.1
–
Proline
116.1
286.1
–
Serine
106.1
276.1
–
Threonine
120.1
290.1
–
Tyrosine
182.1
352.1
–
Valine
118.1
288.1
–
3.2 Effect of pH on the separation of AQC-derivatised amino acid
Mass spectrometry was used to monitor the changes in the retention times of AQC derivatised amino acids because fluorescence detection suffered several peak overlaps by changing the pH and temperature. Even though the buffer capacity had no effect on the separation of amino acids, small changes in buffer pH had shown to have an adverse effect on resolution [8, 23, 35]. Therefore the development and implementation of the amino acid separation on multiple RP-HPLC systems required precise control of the pH buffer system.
Generally the buffering range of the weak acid is pKa ± 1 pH unit. Ammonium acetate solution is composed of NH4+ and CH3COO− ions and provides buffering around pH 5.0, hence its pH buffering range is from 4.0 to 6.0 (Konermann, 2017). The retention time of each amino acid was measured at a pH of 4.50 to 6.00 and a pH 2.7 of water containing 0.1% formic acid. Satisfactory separations were achieved at pH range of 5.00–5.50 (see below).
For comparison purposes, the differences between the retention time at pH 2.7 and retention times at pH 4.50, 5.05, 5.10, 5.20, 5.30, 5.40, 5.50 and 6.00 were calculated. This resulted in a zero difference in retention time at pH 2.7 and the remaining calculated differences were graphed against amino acids (Fig. 2).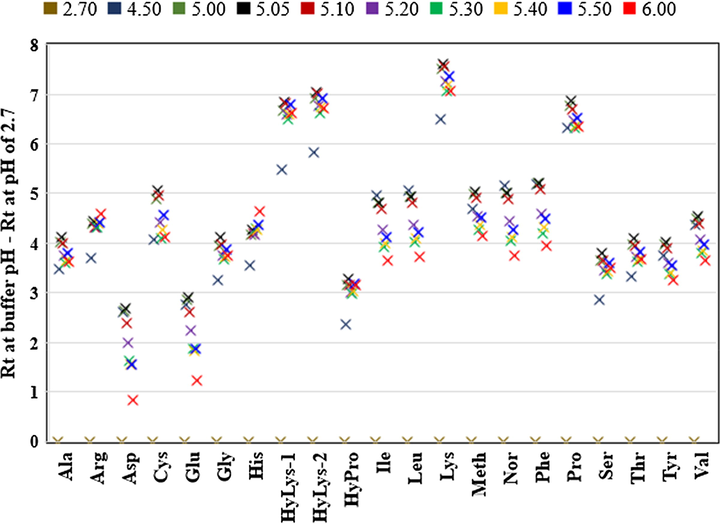
Retention times of AQC-amino acids water containing 0.1% formic acid (pH 2.7) and 5 mM ammonium acetate buffer pH ranges from 4.50 to 6.00. The difference in retention time (Rt) at each pH is calculated by subtracting Rt at pH 2.70. Each point is the average of five injections with relative standard deviation of all amino acids less than 1.0%.
Generally, increasing the pH as minimally as 0.05 units resulted in a variation in the retention times of amino acids (Fig. 2). This is in good agreement with the previous reports which showed the significant effect of pH of buffer on the AQC-amino acid separations, particularly the di-derivatised products (Cohen and De Antonis, 1994; van Wandelen and Cohen, 1997).
Increasing the pH from 2.7 to 4.5 by replacing water containing 0.1% formic acid with 5 mM ammonium acetate buffer (pH 4.5) resulted in a sudden increase in the retention times of all amino acids (Fig. 2). This increase in RT varied significantly between the amino acids; aspartic and glutamic acid showed the smallest increase while lysine, hydroxylysines and hydroxyproline had the largest increase (Fig. 2).
A graph of retention times of amino acids from pH 4.5 to pH 6.0 was provided (Fig. 3). A line placed at the zero of y-axis represents the retention time of each amino acid at pH 4.50 and was used to follow the change in the retention by changing the pH of the buffer.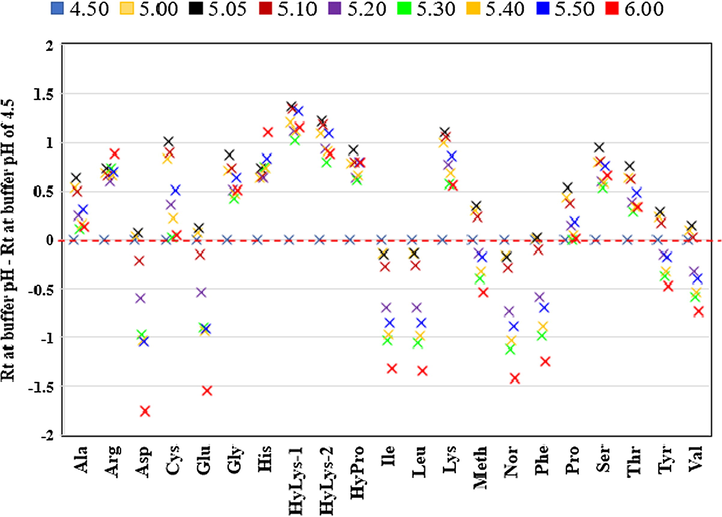
Retention times of AQC-amino acids at 5 mM ammonium acetate buffer pH ranges from 4.50 to 6.00. The difference in Retention time (Rt) at each pH is calculated by subtracting Rt at pH 4.50. Each point is the average of five injections with relative standard deviation of all amino acids less than 1.0%.
Cohen reported that high acidic pH significantly altered the retention time of cystine, hydroxylysines and lysine (van Wandelen and Cohen, 1997). Positive changes in the retention times were not only seen for the di-derivatised amino acids cystine, hydroxylysines and lysine but also for alanine, arginine, glycine, histidine, hydroxyproline, proline, serine and threonine (Fig. 3). In these amino acids, the largest positive was seen at pH 5.05, however for arginine and histidine the largest change was seen at pH 6.00. The quinoline (pKa 4.92) tag group attached to the amino acid (Fig. 1) can explain the increase in retention time (Perrin et al., 1981; van Wandelen and Cohen, 1997). Protonation of the quinoline group attached to the amino acids occurs at pH > 5.00 leading to longer retention times (van Wandelen and Cohen, 1997). For histidine and arginine, increasing the pH resulted in a gradual increase in the retention time as the amine side chain becomes deprotonated (loses its positive charge).
It was found that retention times of amino acids varied significantly by changing the pH of the buffer (Fig. 3). The negative values represent a decrease in the retention times while the positive values result in an increase in the retention times by changing the pH of the buffer. Generally larger negative or positive values indicate a larger change in the retention time.
The largest negative change in the retention time was for aspartic acid and glutamic acid followed by the hydrophobic amino acids: isoleucine, leucine, norleucine, phenylalanine, (Fig. 3). The smallest negative change was for tyrosine, and valine. It is known that AQC reagent only reacts with the amino group, therefore the carboxylic group remains intact (Cohen and Michaud, 1993). Aspartic acid and glutamic acid are the only standard amino acids with carboxylic acid groups on their side-chains, with pKa of 3.86 and 4.25 respectively (Voet and Voet, 2016). These residues are generally negatively charged depending on the pH of the solution. At pH equal to pKa ± 1; the carboxylic group will be a mixture of protonated and deprotonated species as predicted by the Henderson-Hasselbalch equation (Voet and Voet, 2016). As the pH increases, the charge on aspartic and glutamic acids becomes more negative and at pH ≥ pKa ± 1 (around pH 5.10) a large decrease in the retention time is seen associated with a large negative value > −0.5 (Fig. 2). For the other amino acids with negative values, it seemed that retention times were more uniformly distributed and decreased across the pH range. This is in good agreement with previous Cohen reports, however this study shows the retention times over a wide range of pH’s (see above) (Cohen and De Antonis, 1994; van Wandelen and Cohen, 1997).
Interestingly, methionine and tyrosine had an initial increase in the retention time before a sudden decrease. Both methionine and tyrosine have similar pKa’s (2.28), and hence similar behaviour was expected and observed. As the pH increases, protonation took place resulting in a decrease of the negative charges and eventually to less retention with the column. When the pH became higher that pKa, an increase in the negative charge resulted in a stronger affinity with the column (Cohen and De Antonis, 1994; van Wandelen and Cohen, 1997).
3.3 Effect of temperature on the separation of AQC-derivatised amino acid
It is known that column temperature has an effect on the separation using reversed-phase (RP) chromatography (Karger et al., 1976). It was previously shown that AQC amino acid separation can be modified by changing the column temperature (Cohen and De Antonis, 1994; van Wandelen and Cohen, 1997). However there is no complete study for the effect of the RP-column temperature on the separation of AQC-amino acids over a wide range of temperatures (15–60 °C). In this work, the temperature effects were determined in 5 mM ammonium acetate pH 5.05 and 60% acetonitrile. The column temperature was increased from 15 °C to 60 °C, at 5 °C intervals which resulted in shorter retention times for all mono-derivatised amino acids (Fig. 4). The di-derivatised amino acids including cystine, hydroxylysines and lysine showed smaller variations in their retention times with temperature (Fig. 4). Unlike all other amino acids, lysine and hydroxylysine-1 showed a U-curve correlation (Fig. 5).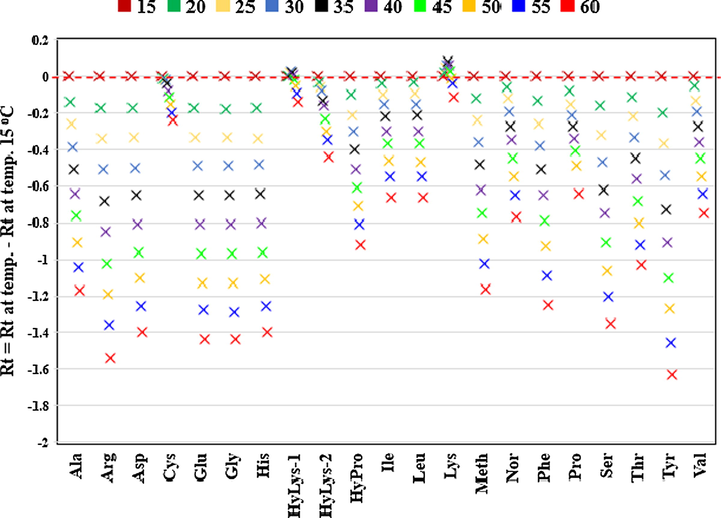
Retention times of AQC-amino acids at different temperatures ranging from 15 °C to 60 °C. Retention time (Rt) at each temperature is calculated by subtracting Rt at temperature of 15 °C. Each point is the average of five injections with relative standard deviation of all amino acids less than 1.0%.
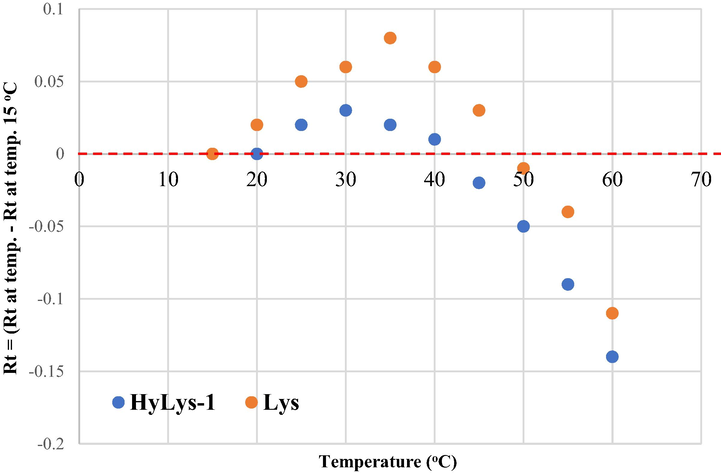
Lysine and hydroxylysine-1 curve taken from Fig. 4.
Based on the van’t Hoff theory, the transfer of the compound from the mobile phase to the stationary is usually an exothermic (negative ΔH°) process for RP chromatography (Karger et al., 1976; Chester and Coym, 2003). Plotting ln k against 1/T will give a straight line where slope is equal to −ΔH°/R which can be used to determine ΔH° (Fig. 6) (Chester and Coym, 2003). Generally amino acids show a positive slope which gives a typical negative ΔH° under reversed-phase conditions. Tyrosine is however the most affected by temperature as it has the steepest straight line producing the largest negative ΔH° which leads to stronger binding with the column. Interestingly cystine, lysine and hydroxylysines show straight lines with negative slope suggesting that their interaction with the stationary phase has positive ΔH° which leads to weaker binding with the column. This has been previously reported with retention behaviour in the aqueous normal-phase (ANP) mode and hydrophilic interaction chromatography (HILIC) (Guo and Gaiki, 2005; Pesek et al., 2008). This data provided an alternative for improving the separation of di-derivatised amino acids only by changing the temperature.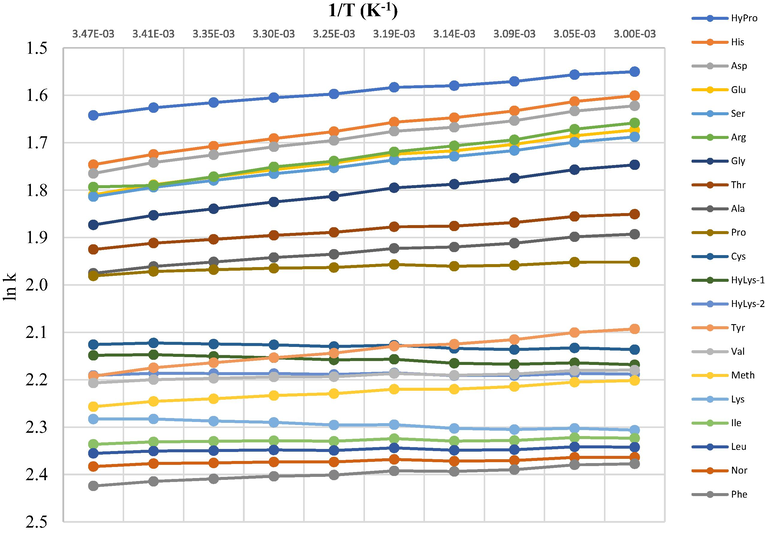
Plot of log k vs. 1/T (K) for AQC-amino acids.
3.4 Accuracy, precision. Limit of detection and limit of quantitation
The repeatability of retention times was tested by five consecutive injections of an AQC-derivatised amino acid standard at the optimised buffer pH and column temperature (Fig. 7). RSD of retention time on both fluorescence and mass spectrometry detections was lower than 1.0% for all amino acids. This indicates a high degree of precision in all the figures shown above. A calibration curve for each amino acid was constructed using mass spectrometry at different pH values (4.50, 5.50 and 6.00). The peak area of the extracted amino acid (Table 1) was the same at different pH values. Typical correlation coefficients (R2) for the calibration curves, concentration range, limit of detection (LOD) and limit of quantitation (LOQ) for both fluorescence and mass spectrometry detections are presented in Table 2. All correlation coefficients were higher than 0.99 for mass spectrometry and higher than 0.9999 for fluorescence detection. LOD and LOQ were calculated as 3.3σ/S and 10σ/S, respectively, where “σ” is the standard deviation of the lowest standard concentration and “S” is the slope of the standard curve. Generally the LOD and LOQ of the mass spectrometry for most of the amino acids was higher than those for fluorescence detection. However LOD and LOQ of cystine, isoleucine, leucine, methionine and valine on fluorescence detection was higher than those for mass spectrometry. Fluorescence detection was largely pH dependent where the response increased when raising the pH of the buffer (Fig. 8). This was in excellent agreement with the previous study where the amino acid eluted in highly aqueous gradient showing a significant reduction in the fluorescence response due to the aqueous quenching effect (Cohen and Michaud, 1993; Cohen, 2005).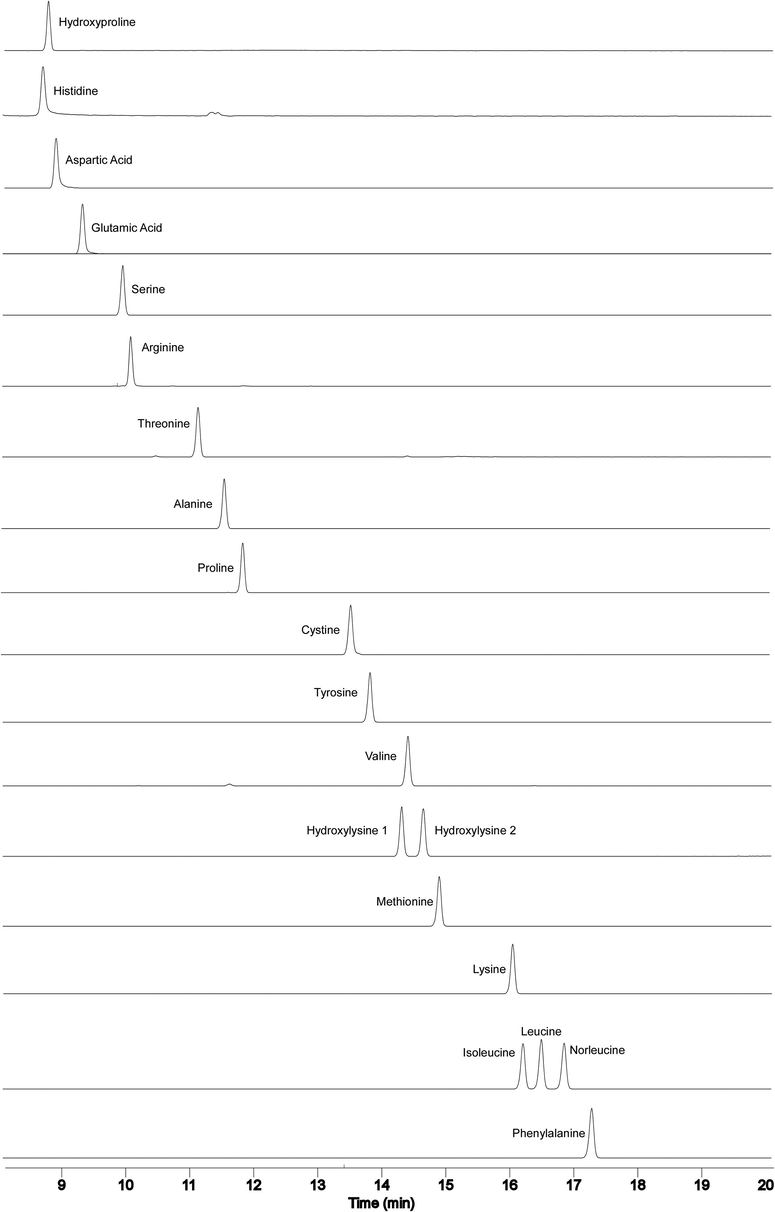
Total ion count chromatograms of the optimised MS method. Solvent A contained 5 mM ammonium acetate (pH 5.03) and solvent B was 60% acetonitrile. The optimised buffer pH 5.03 and 35 °C for column temperature were used. The gradient was 0.0% solvent B at 0.0 min, 70% solvent B at 20 min, 100% solvent B at 21 min, 100% solvent B at 25 min and 0.0% solvent B at 26 min. Total run time was 30 min and flow rate 1.0 mL/min. The ion count intensities of each AQC-derivatized amino acid the internal standard is norleucine. Time window between 8.0 and 20.0 min.
Amino Acid
Fluorescence Detection*
MS detection
Concentration Range (µM)
R2
LOD**
LOQ**
Concentration Range (µM)
R2
LOD**
LOQ**
Alanine
0.01–5.0
0.9999
0.07
0.23
0.01–25
0.9992
0.03
0.10
Arginine
0.01–5.0
1.0000
0.05
0.17
0.01–25
0.9974
0.02
0.07
Aspartic Acid
0.01–5.0
1.0000
0.06
0.20
0.01–25
0.9986
0.06
0.20
Cystine
0.005–12.5
1.0000
0.20
0.60
0.005–12.5
0.9966
0.04
0.13
Glutamic Acid
0.01–5.0
0.9987
0.22
0.73
0.01–25
0.9971
0.10
0.33
Glycine
0.01–5.0
1.0000
0.06
0.20
0.01–25
0.9934
0.06
0.20
Histidine
0.01–5.0
1.0000
0.05
0.17
0.01–25
0.9984
0.04
0.13
Hydroxylysine-1
0.005–12.5
1.0000
0.08
0.24
0.005–12.5
0.9972
0.03
0.10
Hydroxylysine-2
0.005–12.5
0.9999
0.06
0.18
0.005–12.5
0.9985
0.03
0.10
Hydroxyproline
0.05–25
1.0000
0.20
0.66
0.01–25
0.9970
0.04
0.13
Isoleucine
0.01–5.0
1.0000
0.05
0.17
0.01–25
0.9945
0.09
0.30
Leucine
0.01–5.0
1.0000
0.06
0.20
0.01–25
0.9928
0.10
0.33
Lysine
0.01–5.0
0.9999
0.05
0.17
0.01–25
0.9987
0.04
0.13
Methionine
0.01–5.0
1.0000
0.05
0.17
0.01–25
0.9954
0.08
0.26
Phenylalanine
0.01–5.0
0.9999
0.06
0.20
0.01–25
0.9986
0.05
0.17
Proline
0.05–25
1.0000
0.23
0.76
0.01–25
0.9974
0.04
0.13
Serine
0.01–5.0
0.9999
0.09
0.30
0.01–25
0.9959
0.06
0.20
Threonine
0.01–5.0
0.9999
0.06
0.20
0.01–25
0.9997
0.02
0.07
Tyrosine
0.01–5.0
0.9999
0.07
0.23
0.01–25
0.9982
0.05
0.17
Valine
0.01–5.0
1.0000
0.05
0.17
0.01–25
0.9970
0.07
0.23
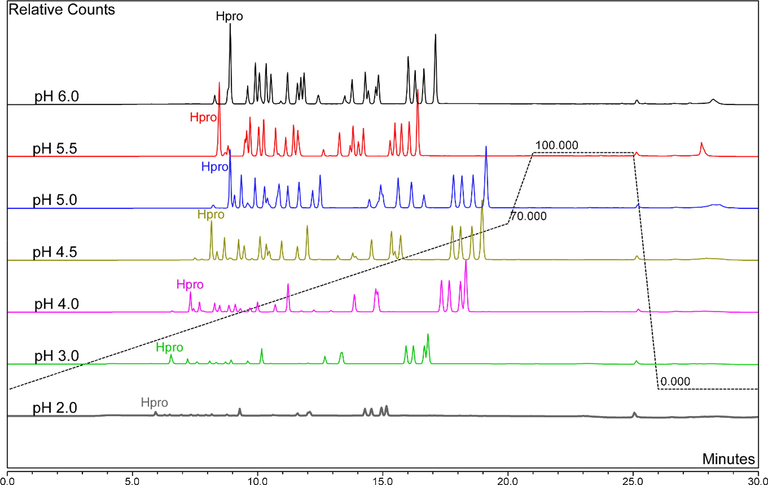
Chromatograms of the optimised HPLC-fluorescence method. Solvent A contained 5 mM ammonium acetate (pH 5.03) and solvent B was 60% acetonitrile. The buffer ranged from pH 2.0 to 6.0 and column temperature was 35 °C. The gradient was 0.0% solvent B at 0.0 min, 70% solvent B at 20 min, 100% solvent B at 21 min, 100% solvent B at 25 min and 0.0% solvent B at 26 min. Total run time was 30 min and flow rate 1.0 mL/min. “Hpro” represents the peak for hydroxyproline and all peaks have normalised to the same scale.
3.5 Amino acid analysis in skin
The method was tested by analysing the amino acid composition of the skin samples from sheep, goat, deer and cow. Generally, it was apparent that glycine, proline, hydroxyproline, alanine, arginine and glutamic acid were predominant in all skin’s samples. On the other hand, tyrosine, histidine, methionine and hydroxylysine were the least abundant amino acids (Covington, 2009; Naffa et al., 2019). Interestingly while cystine was quantified in the skin sample from sheep, it was detected in traces in goat, deer and cow skins. This occurs because sheep skin has a higher concentration of non-collagenous proteins (Naffa et al., 2019) such as proteoglycans and elastin, both of which contain multiple disulphide bonds in their structure. Hydroxylysine was well separated from other amino acids and into its two diastereomers (Piez, 1954; Naffa et al., 2019). Generally the hydroxylysine percentage was in good correlation with the value for hydroxyproline as they are both unique amino acids found in collagen (Hulmes, 2008). The more hydroxyproline the skin had, the higher the hydroxylysine concentration (see Table 3).
Sheep
CV%
Goat
CV%
Deer
CV%
Cow
CV%
Alanine
9.51
1.92
10.26
2.4
10.48
2.05
10.8
0.8
Arginine
7.07
2.95
6.57
1.8
6.4
2.07
6.22
0.42
Aspartic acid
5.58
1.9
4.96
2.11
4.76
2.19
4.68
1.72
Cystine
0.88
15.74
traces
–
traces
–
traces
–
Glutamic acid
10.7
2.56
8.96
1.66
8.61
1.78
8.33
1.66
Glycine
24.27
3.28
30.31
1.37
30.57
1.45
31
1.79
Histidine
0.83
2.92
0.63
7.23
0.6
3.95
0.57
14.87
Hydroxylysine-1
0.13
10.3
0.16
12.01
0.14
7.04
0.15
17.22
Hydroxylysine-2
0.03
46.98
0.09
19.14
0.14
24.62
0.28
11.2
Hydroxyproline
5.74
4.5
7.95
4.78
8.07
2.19
8.82
1.57
Isoleucine
2.29
4.76
1.68
3.04
1.57
3.6
1.43
1.11
Leucine
4.89
4.97
3.43
2.7
3.25
3.64
2.87
0.9
Lysine
3.67
1.72
3.02
2.95
2.97
3.36
2.82
1.09
Methionine
0.95
3.94
0.76
2.85
0.66
5.5
0.63
11.96
Phenylalanine
2.01
2.64
1.65
1.08
1.55
2.21
1.45
2.2
Proline
9.85
3.6
11.44
3.43
12.04
2.75
12.38
0.34
Serine
4.27
6.97
3.42
3.47
3.32
8.18
3.39
11.33
Threonine
1.8
6
1.14
7.95
1.15
3
0.95
2.99
Tyrosine
1.5
7.17
0.99
3.7
0.84
9.9
0.66
8.81
Valine
4.05
5.47
2.86
2.17
2.73
3.38
2.4
1.68
4 Conclusion
Amino acid analysis using AQC derivatisation is one of the most common methods which has been proven to be fast, robust and sensitive. Both mass spectrometry and fluorescence detection methods have been used herein. However complete separation of amino acids proved essential for fluorescence detection and specific buffers could only be suitable for mass spectrometry. The separation of AQC-derivatised amino acids on reversed-phase column was highly influenced by column temperature and buffer pH where a pH unit as small as 0.05 can make the difference between satisfactory and unacceptable separations. Here the effect of pH and column temperature were thoroughly investigated and showed that the retention time of AQC-derivatised amino acids varied significantly. The use of mass spectrometry helped in assigning all the peaks generated on the fluorescence detection to find the optimum buffer pH and column temperature for amino acid analysis. This study will help laboratories utilising amino acid analysis by AQC reagent to precisely control buffer pH and column temperature to obtain best separation protocols. In addition a powerful tool is being provided to choose between mass spectrometry and fluorescence detection methods.
Acknowledgments
This work was supported by NZ Leather and Shoe Research Association (LASRA®), Palmerston North, New Zealand through the Ministry of Business, Innovation and Employment (MBIE) grant numbers LSRX1301 & LSRX1801.
Declaration of Competing Interest
None.
References
- Development of a novel UHPLC-MS/MS-based platform to quantify amines, amino acids and methylarginines for applications in human disease phenotyping. Sci. Rep.. 2018;8:13987.
- [CrossRef] [Google Scholar]
- Validation of a reverse-phase high-performance liquid chromatography method for the determination of amino acids in gelatins by application of 6-aminoquinolyl-N-hydroxysuccinimidyl carbamate reagent. J. Chromatog. A. 2014;1353:49-56.
- [CrossRef] [Google Scholar]
- Application of the 6-aminoquinolyl-N-hydroxysccinimidyl carbamate (AQC) reagent to the RP-HPLC determination of amino acids in infant foods. J. Chromatog. B. 2006;831:176-183.
- [CrossRef] [Google Scholar]
- Effect of phase ratio on van’t Hoff analysis in reversed-phase liquid chromatography, and phase-ratio-independent estimation of transfer enthalpy. J. Chromatog. A. 2003;1003:101-111.
- [CrossRef] [Google Scholar]
- Improved binary high performance liquid chromatography for 68 amino acid analysis of collagens. New Zealand: Proc. First Int. Conf. Sensing Tech; 2005. p. :332-337.
- Amino acid analysis using precolumn derivatization with 6-aminoquinolyl-N-hydroxysuccinimidyl carbamate. In: Amino Acid Analysis Protocols. Springer; 2001. p. :39-47.
- [Google Scholar]
- Quantitation of amino acids as 6-aminoquinolyl-N-hydroxysuccinimidyl carbamate derivatives. J. Chromatog. Library. 2005;70:242-267.
- [CrossRef] [Google Scholar]
- Applications of amino acid derivatization with 6-aminoquinolyl-N-hydroxysuccinimidyl carbamate: analysis of feed grains, intravenous solutions and glycoproteins. J. Chromatog. A. 1994;661:25-34.
- [CrossRef] [Google Scholar]
- Synthesis of a fluorescent derivatizing reagent, 6-Aminoquinolylhydroxysuccinimidyl carbamate, and Its application for the analysis of hydrolysate amino acids via high-performance liquid chromatography. Anal. Biochem.. 1993;211:279-287.
- [CrossRef] [Google Scholar]
- Amino acid analysis of unusual and complex samples based on 86 6-aminoquinolyl-N-hydroxysuccinimidyl carbamate derivatization. Techn. Protein Chem.. 1997;87(8):185-196.
- [CrossRef] [Google Scholar]
- Effects of salt concentration on analyte response using electrospray ionization mass spectrometry. J. Am. Soc. Mass Spectrom. 1999;10(7):625-634.
- [CrossRef] [Google Scholar]
- Tanning Chemistry: The Science of Leather. Cambridge, UK: Royal Society of Chemistry; 2009.
- High-throughput analysis of amino acids in plant materials by single quadrupole mass spectrometry. Plant Methods. 2018;14:8.
- [CrossRef] [Google Scholar]
- High-performance liquid chromatographic analysis of synthetic peptides using derivatization with 6-aminoquinolyl-N-hydroxysuccinimidyl carbamate. Ana. Biochem.. 1994;223:191-197.
- [CrossRef] [Google Scholar]
- Hydrolysis and amino acid composition analysis of proteins. J. Chromatog. A. 1998;826:109-134.
- [CrossRef] [Google Scholar]
- Separation of amino acids using ion-paired reversed-phase high-performance liquid chromatography with special reference to collagen hydrolysate. Amino Acids. 1993;4 https://doi.org/45-51.10.1007/BF00805800
- [Google Scholar]
- Signal suppression/enhancement in high-performance liquid chromatography tandem mass spectrometry. J. Chromatogr. A. 2010;1217:3929-3937.
- [CrossRef] [Google Scholar]
- Retention behavior of small polar compounds on polar stationary phases in hydrophilic interaction chromatography. J. Chromatog. A. 2005;1074:71-80.
- [CrossRef] [Google Scholar]
- Studies of signal suppression in liquid chromatography–electrospray ionization mass spectrometry using volatile ion-pairing reagents. J. Chromatogr. A. 2001;937:41-47.
- [CrossRef] [Google Scholar]
- Collagen diversity, synthesis and assembly. In: Fratzl P., ed. Collagen: Structure and Mechanics. Boston, MA: Springer; 2008.
- [Google Scholar]
- New approach for amino acid profiling in human plasma by selective fluorescence derivatization. Amino Acids. 2012;43:1653-1661.
- [CrossRef] [Google Scholar]
- Hydrophobic effects in reversed-phase liquid chromatography. J. Chromatog. A. 1976;128:65-78.
- [CrossRef] [Google Scholar]
- Addressing a common misconception: ammonium acetate as neutral pH “buffer” for native electrospray mass spectrometry. J. Am. Soc. Mass Spectrom.. 2017;28:1827-1835.
- [CrossRef] [Google Scholar]
- Defect in conversion of procollagen to collagen in a form of Ehlers-Danlos syndrome. Science. 1973;182:298-300.
- [CrossRef] [Google Scholar]
- Lindahl, U., Couchman, J., Kimata, K., Esko, J., 2015. Proteoglycans and sulfated glycosaminoglycans.
- Determination of amino acids in food and feed by derivatization with 6-aminoquinolyl-N-hydroxysuccinimidyl carbamate and reversed-phase liquid chromatographic separation. J. AOAC Int. 1995
- [Google Scholar]
- Determination of fumonisins B1 and B2 in Chinese rice wine by HPLC using AQC precolumn derivatisation. J. Sci. Food Agric.. 2013;93:1128-1133.
- [CrossRef] [Google Scholar]
- Validation of a reverse-phase high performance liquid chromatographic method for concurrent assay of a weak base (salmeterol xinafoate) and a pharmacologically active steroid (fluticasone propionate) J. Pharm. Biomed. Anal.. 2006;40:1149-1154.
- [CrossRef] [Google Scholar]
- Liquid chromatography-electrospray ionization mass spectrometry for the simultaneous quantitation of collagen and elastin crosslinks. J. Chromatog. A. 2016;1478:60-67.
- [CrossRef] [Google Scholar]
- Molecular and structural insights into skin collagen reveals several factors that influence its architecture. Int. J. Biol. Macromol.. 2019;128:509-520.
- [CrossRef] [Google Scholar]
- Insights into the molecular composition of the skins and hides used in leather manufacture. J. Am. Leather Chem. As.. 2019;114:29-37.
- [Google Scholar]
- Rapid analysis of pyridinoline and deoxypyridinoline in biological samples by liquid chromatography with mass spectrometry and silica hydride column. J. Sep. Sci. 2019
- [CrossRef] [Google Scholar]
- Analysis of neuroactive amino acids from microdialysate samples by fluorescence detection using a modification of the 6-aminoquinolyl-N-hydroxysuccinimidyl carbamate method. Biomed. Chromatog.. 2005;19:720-724.
- [CrossRef] [Google Scholar]
- Enantiomeric separation of fluorescent, 6-aminoquinolyl-N-hydroxysuccinimidyl carbamate, tagged amino acids. J. Chromatog. A. 1993;641:257-265.
- [CrossRef] [Google Scholar]
- pKa Prediction for Organic Acids and Bases. London, New York: Chapman and Hall; 1981.
- Analysis of hydrophilic metabolites by high-performance liquid chromatography–mass spectrometry using a silica hydride-based stationary phase. J. Chromatogr. A. 2008;1204:48-55.
- [CrossRef] [Google Scholar]
- The separation of the diastereoisomers of isoleucine and hydroxylysine by ion exchange chromatography. J. Biol. Chem.. 1954;207:77-80.
- [Google Scholar]
- Collagen diseases and the biosynthesis of collagen. Hosp. Pract.. 1977;12:61-68.
- [CrossRef] [Google Scholar]
- Analysis of 26 amino acids in human plasma by HPLC using AQC as derivatizing agent and its application in metabolic laboratory. Amino Acids. 2014;46:1253-1263.
- [CrossRef] [Google Scholar]
- Recent trends in analytical methods for the determination of amino acids in biological samples. J. Pharm. Biomed. Anal.. 2018;147:35-49.
- [CrossRef] [Google Scholar]
- Analysis of free amino acids in A mur s turgeon by ultra-performance liquid chromatography using pre-column derivatization with 6-aminoquinolyl-carbamyl. J. Sep. Sci.. 2012;35:3421-3426.
- [CrossRef] [Google Scholar]
- Defects in the biochemistry of collagen in diseases of connective tissue. J. Investig. Dermatol.. 1976;66:59-79.
- [CrossRef] [Google Scholar]
- Using quaternary high-performance liquid chromatography eluent systems for separating 6-aminoquinolyl-N-hydroxysuccinimidyl carbamate-derivatized amino acid mixtures. J. Chromatogr. A. 1997;763:11-22.
- [CrossRef] [Google Scholar]
- Biochemistry (fourth ed.). NY: Hoboken, John Wiley and Sons; 2011.
- Optimizing high-performance liquid chromatography method for quantification of glucosamine using 6-aminoquinolyl-N-hydroxysuccinimidyl carbamate derivatization in rat plasma: application to a pharmacokinetic study. Biomed. Chromatog.. 2008;22:1265-1271.
- [CrossRef] [Google Scholar]


