

Translate this page into:
Competence azo dyes sensors of new based fluorophores for spectrophotometric trace determination of cobalt in real water samples
⁎Corresponding authors at: Chemistry Department, Faculty of Sciences, Umm Al-Qura University, Makkah, Saudi Arabia (S. Ahmed). aasayqal@uqu.edu.sa (Ali Sayqal), saahmed@uqu.edu.sa (Saleh A. Ahmed)
-
Received: ,
Accepted: ,
This article was originally published by Elsevier and was migrated to Scientific Scholar after the change of Publisher.
Abstract
In this work, a simple, time saving, accurate and sensitive method for the direct spectrophotometric detection of cobalt ion using two new fluorophore azo dyes, R1 and R2, were achieved. The method based on a complex formation between Co(II) and these two azo compounds-based fluorene and pyrene moieties. To attain the optimal conditions for the detection of cobalt ion, several parameters such as effect of solvents, pH, reagent concentration, sequence of addition, temperature and time were explored. The absorption maximum for Co(II)-R1 and Co(II)-R1 orange color complexes was accomplished at 472 nm using pH 8.97 of universal buffer and 470 nm using pH 10.98, respectively. The calibration graphs were linear over the concentration range of 0.2–3 and 0.4–3 µg mL−1 of Co(II) for Co(II)-R1 and Co(II)-R1, respectively with a stoichiometric ratio of (1:2) (Co2+: reagent). Various statistical analytical parameters including molar absorptivity, limit of detection, limit of quantification, precision and accuracy were estimated. In addition, the established approach was efficiently exploited for Co(II) determination in some water samples. The findings of this investigation may pave the way for advancements in sensor technologies.
Keywords
Azo dyes
Cobalt (II)
Fluorophores
Spectrophotometry
Water samples

1 Introduction
Azo dyes are known as organic-colored compounds which contain the azo group (Ar–N = N–Ar) in the structure, and it is considered as the most diverse group (Benkhaya et al., 2020). Generally, the azo dyes-based compounds, the azo group is coupled with two mono or polycyclic aromatic systems (Hashemi Kaykhaii 2022). Due to the physicochemical and biological qualities of azo compounds, a wide range of applications including pharmaceutical, cosmetic, food, dyeing/textile, corrosion inhibitors, and analytical chemistry industries use these dyes (Ali et al., 2018, Aljamali Hassen 2021). In addition, azo dyes have a huge number of biological activities which was previously reported for its pharmaceutical importance as antibiotic, antifungal, and anti-HIV (Ali et al., 2019, Węglarz-Tomczak and Górecki, 2012). Azo dyes are also used in analytical assays such as spectrophotometer techniques (Abdallah, 2012, Hulanicki and Głąb 1978, Nguyen and Saleh, 2016). The presence of azo group (R–N = N–R) led to shift their absorption maxima bathochrmically and absorbed in the visible light due to the chromophoric characteristic of this dye class.
Substances such as heavy metals, organic amines, inorganic pollutants and nitrophenol have the potential to contaminate the environment. Therefore, several methods have been proposed for the determination of these harmful compounds (Liu et al., 2020, Pan et al., 2023, Zhang et al., 2024, Zhong et al., 2024). Cobalt is one of the natural earth elements that exist in trace amount in the earth's environment. It has been applied for several purposes such as pigments, glass, metal alloys and as catalysts for petroleum industries (Kazi et al., 2012). It also exists in the chemical structure of vitamin B12, some enzymes, and it is well known to be an essential micronutrient in animals and plants for metabolic processes (Santos et al., 2020). However, one of the major issues in the environment is the elimination of large number of heavy metals from industries waste into the natural water. At high level, exposure to metals such as cobalt might lead to serious health problems and cause several diseases for human and animals including heart, lung and skin (Ali et al., 2021, Hussain et al., 2021, Kazi, et al., 2012). Consequently, it is essential to detect and determine cobalt element in different samples such as food and water. It’s worth mentioning that, many analytical techniques comprising atomic absorption spectroscopy (AAS) and ICP-MS have been applied for the determination cobalt along other heavy metal in various samples (Alorabi, 2022, El-Zomrawy, 2018, Khan and Kazmi, 1979). Nevertheless, these analytical instruments are expensive and time consuming. Accordingly, emerging a simple, selective, sensitive, inexpensive, and non-extractive spectrophotometric method is indispensable and needed to determine the heavy metal concentration, via an economical spectrophotometric assay (Alorabi, 2022, Dhaka et al., 2015, Echioda et al., 2021, Hatam et al., 2020, Khedr et al., 2010, Zhang et al., 2018). In this study, two new azo dye reagents were used at optimum parameters in order to determine cobalt ion through chelation with these reagents, namely, 1-[5-(9H-Fluoren-2-yl)-thiazol-2-ylazo]-naphthalen-2-ol, (R1) and 1-(5-Pyren-1-yl-thiazol −2-ylazo)-naphthalen-2-ol, (R2). The effect of several experimental variables on the sensitivity and stability of the method was examined. The approach herein was applied for Co(II) determination in some spiked local water samples.
2 Experimental
2.1 Instrumentation
A Shimadzu UV-1800 spectrophotometer was used to acquire all UV–visible spectra. Melting points (uncorrected) were measured on SMP3 melting point apparatus. A Shimadzu FT-IR3600 spectrophotometer was used to collect IR spectra (KBr). All 1H, 13C, Dept-135 NMR spectra were obtained on Bruker Avance 600 (at 600, 100, 135 MHz for 1H, 13C and dept, respectively) in fully deuterated chloroform (CDCl3) and DMSO‑d6. The pH for the used solutions was adjusted using pH-meter (METTLER TOLEDO MP220).
2.2 Reagent and materials
In this study, all solvents and chemicals were used without any further purification. Several buffer solutions were prepared according to the pervious method of Gomori (Gomorie, 1955). These prepared buffers included acetate, phosphate, borate and universal buffers. A stock solution of 1.0x10⁻³ M cobalt (II) nitrate hexahydrate, Co(NO3)2·6H2O, was prepared by dissolving an appropriate amount of the cobalt nitrate in a 100 mL measuring flask using bidistilled water. A working stock solution of 1.0x10⁻³ M were prepared by dissolving an appropriate amount of the investigated reagents 1-[5-(9H-fluoren-2-yl)-thiazol-2-ylazo]-naphthalen-2-ol, (R1) and 1-(5-pyren-1-yl-thiazol-2-ylazo)-naphthalen-2-ol, (R2) in absolute ethanol. From these stock solutions, fresh diluted solutions were prepared regularly. 0.5 % (v/v) solution of Triton X-100 and 0.5 % (w/v) solution of sodium dodecyl sulphate (SDS) were prepared. These solutions were prepared by dissolving an appropriate amount of each surfactant in 100 mL bidistilled water. Hydrochloric acid, HCl (37 %, 1.2 g/mL) and NaOH (97.0 %, pellets) were obtained from Sigma-Aldrich.
2.3 Synthesis of (E)-1-((5-(9H-fluoren-2-yl)thiazol-2-yl)diazenyl)naphthalen-2-ol (5a,R1) and/or (E)-1-((5-(pyren-4-yl)thiazol-2-yl)diazenyl)naphthalen-2-ol (5b,R2)
The synthesis of (E)-1-((5-(9H-fluoren-2-yl)thiazol-2-yl)diazenyl)naphthalen-2-ol (R1) and (E)-1-((5-(pyren-4-yl)thiazol-2-yl)diazenyl)naphthalen-2-ol (R2) was undertaken (scheme 1). As shown, a Friedel–Crafts acylation of fluorene 1a and/or pyrene 1b gave 1-(9H-fluoren-2-yl) ethanone (2a) and 1-(pyren-1-yl) ethanone (2b) in 86–92 % yield, respectively. Next, bromination of acetylated compounds 2a,b performed utilizing cuprous bromide as brominating agent in refluxing CHCl3/CH3CO2C2H5 for 9 h, to afford 2-bromo-1-(9H-fluoren-2-yl)ethanone (3a) and 2-bromo-1-(pyren-1-yl)ethanone (3b) in 81–93 % yields. On the other hand, the aminothiazole derivatives 4ab were obtained in 73–86 % yields as yellow crystals by refluxing compounds 3a, b with thiourea (1.1 eq.) in EtOH for 4 h. Products 4a, b were obtained as yellow crystals after recrystallization in ethanol. Finally the target azo dyes R1 and R2 were obtained via diazotization of the corresponding 2-aminothizole derivatives with freshly generated nitrous acid from NaNO2/ HCl at 0–5 °C. Coupling of the diazonium salt with β-naphthol in basic media (aq. NaOH) at 0–5 °C afforded the anticipated coupled products (E)-1-((5-(9H-fluoren-2-yl)thiazol-2-yl)diazenyl)naphthalen-2-ol (R1) and (E)-1-((5-(pyren-4-yl)thiazol-2-yl)diazenyl) naphthalen-2-ol (R2) as red-brown solid precipitate in 76–87 % yield, respectively. Both analytical and spectroscopic tools were used to characterize the synthesized compounds 2–4, R1 and R2 (see experimental section and supporting information).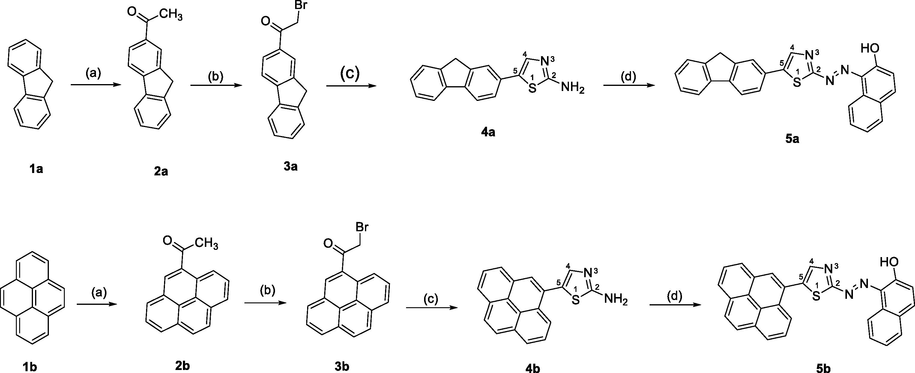
Synthesis of naphthalene and fluorene based azo dyes R1 and R2: (a) CH3COCl, AlCl3, DCM, 0 °C/ 6 h then rt/ overnight; (b) Cu2Br2, CHCl3/ CH3CO2C2H5/ rt/ reflux/ 9 h; (c) 1.1 eq. H2NCSNH2/ EtOH, reflux/ 4 h; (d) NaNO2/HCl/β-naphthol/NaOH.
2.3.1 Synthesis of 1-(9H-fluoren-2-yl)ethenone (2a)and/or 1-(pyren-1-yl)ethanone (2a,b)(Weng et al., 2012)
In an ice-cold bath, solution of fluorene (1a) and/or pyrene (1b) (100 mmol) in 250 mL CH2Cl2 was introduced drop by drop over a period of 2.5 h into an iced solution containing a mixture of 17.8 g of aluminum trichloride (132 mmol) and 9.6 mL of acetyl chloride (equimolar) dissolved in 30 mL of CH2Cl2. The resulting mixture was gently stirred at 0 °C for 6 h and then allowed to stand at room temperature overnight. Subsequently, the mixture was slowly poured into 500 L of deionized water to which 100 mL of concentrated hydrochloric acid was added, and the resulting solution was stirred for a period of 3 h. The complex formed during this process was then decomposed, yielding a clear yellow solution. The organic layer was separated, treated with anhydrous MgSO4, then filtered and evaporated in vacuo. The resulting product was purified on silica gel (elution: DCM) to give the titled compounds 2a, b in 86–92 yield, respectively.
1-(9H-fluoren-2-yl)ethenone 2a: Light-yellow crystals; mp 102–103 °C. IR (KBr): νmax = 3090, 2899, 1679 (carbonyl), 1632 (imine) cm−1. 1H NMR (500 MHz, CDCl3): δ 9.19 (1H, s, fluorene-H), 8.02 (1H, s, fluorene-H), 7.86 (2H, s, fluorene-H), 7.61 (1H, s, fluorene-H), 7.43–7.41 (2H, t, J = 1.78 Hz, fluorene-H), 3.97 (s, 2H, CH2, 9H-fluorene), 2.68 (3H, s, CH3); 13C NMR (125 MHz, CDCl3): δ 198.05 (carbonyl), 146.45 (C), 144.54 (C), 143.33C), 140.50 (C), 135.63 (CH), 128.05 (CH), 127.77 (CH), 127.09 (C), 125.97 (C), 124.97 (CH), 120.91 (CH), 119.86, 36.90 (CH2), 26.81 (CH3) ppm.
1-(pyren-1-yl)ethenone 2b: Yellow crystals; mp 86–88 °C. IR (KBr): νmax = 3082, 2927, 1686 (carbonyl), 1632 (C = C) cm−1.1H NMR (600 MHz, DMSO): δ 8.90 (1H, d, pyrene-H), 8.51 (1H, d, J = 6.45 Hz pyrene-H), 8.31–8.33 (2H, t, J = 2.78 Hz pyrene-H), 8.23–8.27 (3H, q, pyrene-H), 8.16 (1H, d, J = 6.50.78 Hz pyrene-H), 8.07–8.10 (t, 1H, J = 2.45 Hz, pyrene-H), 2.85 (3H, s, CH3); 13C NMR (100 MHz, DMSO): δ 202.43 (carbonyl), 133.76 (C), 132.15 (C), 131.03C), 130.30 (C), 129.88 (CH), 129.82 (CH), 128.82 (CH), 127.55 (CH), 127.13 (CH), 126.94 (CH), 126.49 (CH), 124.78 (CH), 123.87 (CH), 30.94 (CH3) ppm.
2.3.2 Synthesis of 2-bromo-1-(9H-fluoren-2-yl)ethanone (3a) and/or 2-bromo-1-(pyren-1-yl)ethenone (3b)(El Guesmi et al., 2020)
To a refluxing suspension of copper(I) bromide (17.22 g, 120 mmol) in 250 mL of ethyl acetate was added a solution containing 1-(9H-fluoren-2-yl)ethanone 2a and/or 1-(pyren-1-yl)ethenone 2b (100 mmol) in CHCl3 (0.1 L) was gently introduced over a span of 50 min. The resultant solution was maintained at reflux for a duration of 9 h. and subsequently, while still hot, it was filtered through Celite, approximately 1 in. in thickness. The filter cake was thoroughly rinsed multiple times with EtOAc, and the combined filtrate was removed under vacuo to afford products 3a and 3b as buff color solid in 81–93 % yield. The obtained product we pure enough and used for the next step without further purification.
2-bromo-1-(9H-fluoren-2-yl)ethanone (3a): Yellow needles, mp 128–130 °C. IR (KBr): νmax = 3122, 2925, 1678 (carbonyl), 1632 (imine) cm−1. 1H NMR (500 MHz, CDCl3): δ 8.11 (1H, s, fluorene-H), 7.95 (1H, s, fluorene-H), 7.89 (2H, s, fluorene-H), 7.63 (1H, s, fluorene-H), 7.46 (2H, t, J = 6.78 Hz fluorene-H), 4.14 (s, 2H, CH2), 3.98 (2H, s, CH2, 9H-fluorene); 13C NMR (125 MHz, CDCl3): δ 186.77 (carbonyl), 148.13 (C), 144.71 (C), 143.80 (C), 139.95 (C), 128.76 (CH), 127.95 (CH), 127.32 (CH), 125.97 (CH), 125.40 (CH), 125.14 (CH), 121.26 (CH), 120.14 (CH), 36.89 (CH2), 29.49 (CH2, 9H-fluorene) ppm. Anal. Calcd. for C15H11BrO (287.15): C, 62.74; H, 3.86; Br, 27.83. Found: C, 62.72; H, 3.85; Br, 27.97 %.
2-bromo-1-(pyren-1-yl)ethenone (3b): Yellow crystals, mp 134–135 °C. IR (KBr): νmax = 3038, 2887, 1670 (carbonyl), 1628 (imine) cm−1. 1H NMR (600 MHz, CDCl3): δ 9.18 (1H, d, J = 5.90 Hz pyrene-H), 8.56 (1H, d, J = 5.92 Hz pyrene-H), 8.47–8.45 (3H, m, pyrene-H), 8.38–8.32 (2H, m, pyrene-H), 8.30–8.25 (2H, m, pyrene-H), 4.98 (2H, s, CH2); 13C NMR (100 MHz, CDCl3): δ 189.82 (C‚O), 129.84, 126.19, 125.84, 125.67, 125.55, 125.44, 123.54, 122.25, 122.06, 121.98, 121.84, 121.75, 120.23, 119.84, 119.25, 119.18, 29.57 (CH2) ppm. Anal. Calcd. for C18H11BrO (323.18): C, 66.89; H, 3.43; Br, 24.72. Found: C, 66.85; H, 3.41; Br, 24.64 %.
2.3.3 Synthesis of 4-(9H-fluoren-2-yl)thiazol-2-amine (4a) and/or 5-(pyren-4-yl)thiazol-2-amine (4b)
To a clear solution of 2-bromo-1-(9H-fluoren-2-yl)ethenone and/or 2-bromo-1-(pyren-1-yl)ethenone (3b) (30 mmol) in EtOH (200 mL), obtained by heating to reflux, was added an ethanolic solution (50 mL) of thiourea (2.66 g), introduced dropwise over a period of 30 min. The reaction was maintained at reflux for 4 h and subsequently allowed to cool to room temperature. The precipitate that formed during cooling was rinsed with a sodium bicarbonate solution until no further effervescence was observed. The resulting solid was then filtered and dried in vacuum oven (2d), affording compounds 4a and 4b in 73 %-86 % yields. The obtained product we pure enough and used for the next step without further purification.
4-(9H-fluoren-2-yl)thiazol-2-amine (4a): Yellow crystals; mp = 169–172 °C. IR (KBr): νmax = 3265, 3175 (NH2), 3056, 2898, 1620 (imine) cm−1; 1H NMR (500 MHz, CDCl3): δ 8.01 (1H, s, thiazole), 7.86 (2H, s, fluorene-H), 7.59 (1H, s, fluorene-H), 7.38 (1H, s, fluorene-H), 7.31 (1H, s, fluorene-H), 7.06 (2H, t, J = 2.46 Hz fluorene-H), 3.95 (2H, s, CH2, 9H-fluorene), NH2 protons is not showing up due to hydrogen bond formation and π-stacking as well; 13C NMR (125 MHz, CDCl3): δ 168.56 (C), 150.63 (C), 143.69 (C), 143.73 (C), 141.40 (C), 134.13 (C), 122.28 (CH), 127.14 (CH), 125.60 (CH), 124.90 (CH), 122.73 (CH), 120.44 (CH), 120.41 (CH), 101.71(C), 39.41 (CH2, 9H-fluorene) ppm. Anal. Calcd. for C16H12N2S (264.34): C, 72.70; H, 4.58; N, 10.60; S, 12.13 Found: C, 72.69; H, 4.55; N, 10.57.97; S, 12.10 %.
5-(pyren-4-yl)thiazol-2-amine (4b): Pale yellow powder; mp = 188–189 °C. IR (KBr): νmax = 3264, 3174 (NH2), 3044, 1627 (C‚N) cm−1; 1H NMR (600 MHz, DMSO‑d6): δ 8.87 (1H, d, J = 2.46 Hz, pyrene-H), 8.27–8.24 (4H, m, pyrene-H), 8.19–8.14 (3H, m, pyrene-H), 8.09–8.05 (1H, m, pyrene-H), 7.29 (2H, s, NH2), 6.96 (1H, s, thiazole-H); 13C NMR (100 MHz, CDCl3): δ 168.74 (C‚N), 150.71 (C), 131.43 (C), 130.90 (C), 130.71 (C), 128.21 (C), 127.83 (CH), 127.81 (CH), 127.74, (CH), 126.76 (CH), 126.19 (CH), 125.71 (CH), 125.41 (C),125.29 (C), 124.50 (C), 106.30 (CH-thiazole) ppm. Anal. Calcd. for C19H12N2S (300.38): C, 75.97; H, 4.03; N, 9.33; S, 10.67. Found: C, 75.91; H, 3.97; N, 9.29; S, 10.73 %.
2.3.4 Synthesis of (E)-1-((5-(9H-fluoren-2-yl)thiazol-2-yl)diazenyl)naphthalen-2-ol (R1) and/or (E)-1-((5-(pyren-4-yl)thiazol-2-yl)diazenyl)naphthalen-2-ol (R2)
In 250 mL conical flask, 2.0 g of aminothiazole derivatives 4a, b was dissolved in 26.6 mL of 50 % (v:v) HCl. The solution was cooled-down in ice-bath with vigorous stirring till the reaction solution reaches a temperature of 0–3 °C. In another conical flask, a solution of sodium nitrite (3.4 g) in dissolved in 17 mL bidistilled water was chilled in an ice-bath at 0 °C. Then, sodium nitrite solution was added dropwise to the aminothiazoles 4a, b solutions under vigorous stirring. After the complete addition of sodium nitrite solution, the diazonium salts were formed and kept in the ice-bath for 15 min. In another 250 mL conical flask, 6.24 g β-naphthol was dissolved in 50 mL of 20 % NaOH solution, and the naphthol solution was cooled in ice-bath for 15 min. The cold diazonium salt solution was then slowly added to the β-naphthol solution under continuous stirring and the reaction temperature must kept below 5 °C after complete addition of diazonium salt by adding crushed ice from time to time for 30 min to assure the complete coupling and formation of the desired azo dyes, R1 and R2. A red-brown color acquires and solid crude fluorene and pyrene azo-β-naphthols R1 and R2 were precipitated. The reaction mixtures were left to stand for 2 h while being stirred to ensure the completion of the reaction. Subsequently, they were transferred to a refrigerator and left overnight. The red-brown solid products were decanted into a Büchner funnel under reduced pressure and washed 5x100 mL times with ice-cold water until the filtrate became clear. The solid products were dried under vacuum desiccator in absence of light for 2 days and the dried azo dye products were recrystallized from ethanol to afford the products R1 and R2 in 76–87 % yields.
(E)-1-((5-(9H-fluoren-2-yl)thiazol-2-yl)diazenyl)naphthalen-2-ol (R1): Red-brown; mp = 232–234 °C. IR (KBr): νmax = 3321 (OH), 3059, 2980, 2196 (N = N), 1627 (C‚N) cm−1, 1H NMR (600 MHz, DMSO‑d6): δ 8.01 (s, 1H, thiazole), 7.98 (d, 1H, J = 6.76 Hz Naphthol), 7.94 (d, 1H, J = 6.76 Hz, Naphthol), 7.83 (d, 1H, J = 6.80 Hz, Naphthol), 7.75 (2H, d, J = 6.80 Hz, fluorene-H), 7.61 (2H, d, J = 6.76 Hz fluorene-H), 7.54 (m, 3H, Naphthol), 7.41 (1H, t, J = 2.76 Hz fluorene-H), 7.33 (1H, s, fluorene-H), 7.25 (1H, d, J = 6.76 Hz fluorene-H), 6.42 (s, broad, 1H, OH), 3.99 (2H, s, CH2, 9H-fluorene); 13C NMR (100 MHz, DMSO‑d6): δ 170.27 (C), 155.77 (C), 144.12 (C), 143.91 (C), 140.88 (C), 130.91 (C), 130.56 (C), 129.73 (C), 127.71 (CH), 127.34 (CH), 125.70 (CH), 125.06 (CH), 123.07 (CH), 122.28 (CH), 120.87 (CH), 119.08 (CH), 109.10 (CH), 102.28 (C), 36.90 (CH2, 9H-fluorene) ppm. Anal. Calcd. for C26H17N3OS (419.50): C, 74.44; H, 4.08; N, 10.02; S, 7.64, Found: C, 74.45; H, 4.03; N, 10.11; S, 7.60 %.
(E)-1-((5-(pyren-4-yl)thiazol-2-yl)diazenyl)naphthalen-2-ol (R2): Red-brown powder; mp = 269–271 °C. IR (KBr): νmax = 3329 (OH), 3068, 1637 (C‚N) cm−1; 1H NMR (600 MHz, DMSO‑d6): δ 8.66 (1H, d, J = 4.80 Hz, pyrene-H), 8.30–8.33 (4H, m, pyrene-H), 8.21–8.23 (4H, m, pyrene-H), 8.09–8.11 (2H, t, J = 1.76 Hz Napthol), 7.73–7.76 (1H, m, Naphthol), 7.60 (1H, s, thiazole-H), 7.52–7.54 (2H, m, Naphthol);7.06 (1H, s, Naphthol), 6.45 (s, broad, 1H, OH); 13C NMR (100 MHz, DMSO‑d6): d 169.34 (C‚N), 158.78 (C), 131.78 (C), 131.19 (C), 130.90 (C), 130.82 (C), 130.54 (C), 129.74 (C), 128.52 (C), 128.24 (CH), 128.16 (CH), 128.12 (CH), 127.99 (CH), 127.88 (CH), 127.78, (CH), 126.95 (CH), 126.56 (CH), 126.44 (CH), 126.00 (CH), 125.70 (CH), 125.57 (C), 125.57 (C), 125.27 (C), 124.60 (C), 124.32 (C), 119.09(C), 109.11 (CH-thiazole) ppm. Anal. Calcd. for C29H17N3OS (455.53): C, 76.46; H, 3.76; N, 9.22; S, 7.04. Found: C, 76.53; H, 3.70; N, 9.19; S, 7.06 %.
2.4 General procedure
2.4.1 Solvent effect of the free reagents
The absorption spectra of the reagents R1 and R2 were investigated by measuring the reagents in different kind of solvents in order to examine a various parameters such as dielectric constant, refractive index, and H-bonding capacity (Avcı et al., 2016, Sayqal et al., 2020). The effect of different organic solvents (e.g., ethanol, methanol, dimethylformamide, acetonitrile, acetone, and hexane) were studied by measuring the absorption of 1.0x10⁻⁵ M solution of each reagent in these solvents against a pure solvent as a blank within a UV/Vis spectrum.
2.4.2 Spectrophotometric studies of complexes between Co(II) and the studied reagents
To establish the optimum conditions between Co(II) and reagents R1 and R2, numerous parameters such as concentration of reagents, wavelength, pH, buffers, time, sequence of addition, and temperature were investigated. The solution of the complexes formed between the two reagents and Co(II) were prepared by mixing 4.0 mL of 1.0 × 10⁻³ M R1 and 2.5 mL of 1.0 × 10⁻³ M R2 with 0.5 mL of 1.0 × 10⁻³ M cobalt ion in 10 mL measuring flask comprehending optimum buffer solution of the optimum pH. The absorbance of these mixtures were measured against a blank solution prepared by the same manner except of the metal ion, at λmax 472 and 470 nm for Co(II)-R1 and Co(II)-R2, respectively. In addition, the influences of time on the obtained complexes between the reagents and the metal ion were examined at different time intervals. Also, the effect of temperature was investigated at various temperature ranges 23–55 °C using thermoelectrically temperature controlled, Shimadzu UV-1800 spectrophotometer.
2.5 Measurement of the nature of Co(II) complexes
For the determination of the stoichiometric ratio, Job's procedure of continuous variation was used to track the generation of the complexes between R1 and R2 reagents with cobalt ion (Job, 1928). In this method, at optimum conditions, the cobalt ion was mixed with a series of 10 mL portions of each reagent solution separately. These mixture solutions represent different complementary proportions, and they were subsequently processed as per the prescribed protocol. To determine the stoichiometric proportions of the obtained complexes, the line intersections were calculated from the plot between the mole fraction of Co(II) and the measured absorbance signal.
2.6 Analytical application
To investigate the validation of the suggested approach, cobalt ion was measured in some water samples. All water samples were spiked with cobalt ion prior analysis. Tap water samples were collected from the laboratory at Umm Al-Qura University, whereas the wastewater samples were provided from a local wastewater treatments plant in Makkah region. An aliquot of standard solution of cobalt ion at the obtainable linearity range was transferred to each real tap water or wastewater sample. Samples were then investigated by the presented two approaches.
3 Results and discussion
A spectrophotometric assay is one of the most common analytical assay dependents on colorimetric properties of some compounds (Akram et al., 2020, Coulibaly, 2021, El-Zomrawy, 2018, Hatam, et al., 2020), Many compounds are characterized by their property to completely coordinate metal ion forming chelates. In this study, we report some results of this colorimetric assay using coupling with some prepared fluorophores based azo dyes that were effectively used to determine the concentration of Co(II) ion.
3.1 Solvatochromic properties of R1 and R2
Fig. 1 showed the impact of investigated solvents on the UV/Vis spectra for 1.0 × 10⁻⁵ M of the studied reagents, the resulted spectra of each reagent was collected by measuring the absorbance of reagents in organic solvents against a pure solvent as a blank solution. The obtained results confirm that, the absorption spectra of the exploited reagents are influenced by all the used solvents. The recorded bathochromic, red shifts, of the organic solutions absorption signals are understood as indication of changing of the series of structurally-related organic molecules or the kind of organic solvents polarities (Masoud et al., 2005, Sayqal, et al., 2020, Yazdanbakhsh and Mohammadi, 2009). The studied solvents were selected based on the diversity of solvent parameters (Sayqal, et al., 2020). Table 1, showed the molar absorptivity at the different λmax for each reagent in the used solvents. Predominantly, three absorption peaks were observed for R1 within the range 200–450 nm using most used solvents while for reagent R2, five peaks with different intensities were presented. After comparing the peaks at longer wavelength for both R1 and R2, which located around 370 nm for R1 and 350 nm for R2, a high molar absorptivity for R2 was observed using all solvents where for ethanol and methanol, as examples, equals 4.31x10⁴ and 4.06x10⁴ L mol−1 cm−1 for R2 and 0.72x10⁴ and 0.47x10⁴ L mol−1 cm−1 for R1, respectively. As seen from Fig. 1, the two reagents under investigation have dissimilar absorption region. Therefore, it is clear that each absorption peak's position and intensity was changed due to the diversity of solvent's polarity. In general, the position of the absorption peaks for all synthesized organic reagents shifts to higher wavelengths (bathochromic shift,) as solvent polarity increases (Yazdanbakhsh and Mohammadi 2009). This performance is elucidated by the fact that molecules in the ground and excited states exhibit different polarities. For the reagents (R1 and R1) with positive inductive groups on the thiazole moiety, a solvatochromism take place in the (n → π*) absorption due to the increase of the push–pull character of the groups (Masoud, et al., 2005). These findings emphatically affirm the notion that the examined substances are likely to exhibit strong chromophoric signals. *ε: The molar absorptivity ×104. **DMF: Dimethylformamide.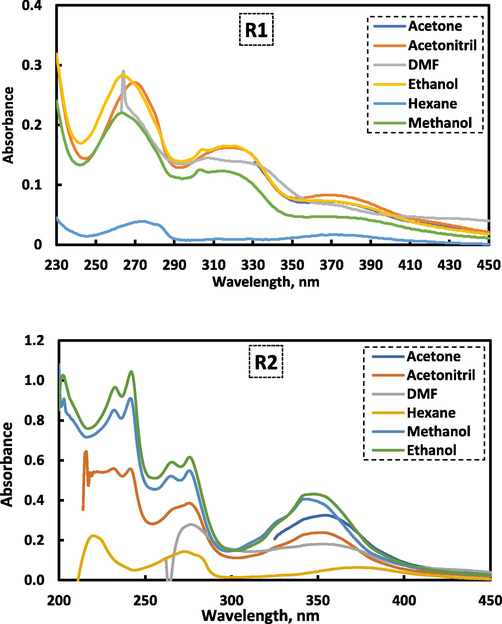
The electronic absorption spectra for 1.0x10⁻⁵ M solution for reagent R1 and R2 in different organic solvent against a pure organic solvent as a blank.
Solvent
Parameter*
R1
R2
Peak No.
Peak No.
1
2
3
1
2
3
4
5
Ethanol
λmax, nm
264
319
371
232
242
265
276
346
ε, L mol−1 cm−1
2.83
1.65
0.72
9.64
10.44
5.91
6.16
4.31
Methanol
λmax, nm
263
313
365
232
241
265
276
343
ε, L mol−1 cm−1
2.20
1.23
0.47
8.52
9.08
5.21
5.47
4.06
DMF**
λmax, nm
---
307
369
---
---
---
277
352
ε, L mol−1 cm−1
---
1.45
0.67
---
---
---
2.79
1.81
Acetone
λmax, nm
---
---
368
---
---
---
---
354
ε, L mol−1 cm−1
---
---
0.73
---
---
---
---
3.25
Acetonitrile
λmax, nm
270
317
370
232
241
---
275
352
ε, L mol−1 cm−1
2.71
1.62
0.83
5.58
5.56
---
3.85
2.38
Hexane
λmax, nm
273
---
370
220
---
---
273
370
ε, L mol−1 cm−1
0.39
---
0.17
2.23
---
---
1.44
0.64
3.2 Spectrophotometric studies for Co(II) complexes with the studied reagents
In order to investigate the relation between cobalt ion and the studied reagents, UV/Vis spectra were collected. As seen in Fig. 2 (a.b), the absorption spectra of free reagents R1 and R2 in a universal buffer exhibits absorption peaks in the ultraviolet region at λmax 358 and 360 nm, respectively. Upon binding of reagents R1 and R2 with Co(II) ions, it was found that the spectra have some bathochromic shift of the absorption peaks with a change in the absorbance. This clear observation is due to formation of the complex which resulted from the addition of the cobalt ion to the investigated reagents (El-Zomrawy, 2018, Mostafa et al., 2021). In case of curve (C) in both complexes, where the blank solution was (the used reagent and the buffer), a clear peaks for the formed Co(II) were obtained in the visible region at λmax 472 and 470 nm, respectively. This is bathochromic shift due to the complexation between Co (II) and the considered reagents indicating the formation of stable Co (II)-R1and Co(II)-R2 complexes.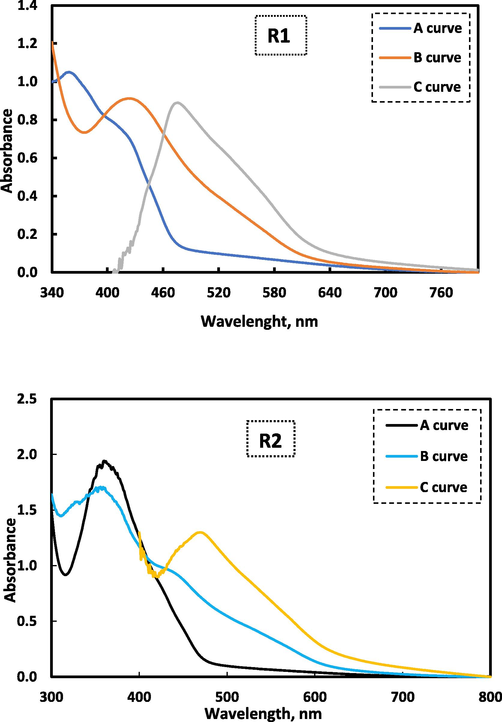
Absorption spectra for the Co(II) complex between Co(II) and reagents (R1 and R2) where A) is the absorption spectrum for 1.0 mL of 1.0 × 10⁻³ M reagent and universal buffer against buffer, B) the absorption spectrum for 0.5 mL 1.0 × 10⁻³ M Co(II), 1.0 mL of 1.0 × 10⁻³ M reagent and buffer against buffer, C) the absorption spectrum for 0.5 mL of 1.0 × 10⁻³ M Co(II), 2.5 mL of 1.0 × 10⁻³ M reagent and buffer against regent and buffer.
3.3 Optimum conditions for spectrophotometric determination of Co(II)
3.3.1 Effect of pH on Co(II) complex
For recognizing the most suitable buffer and the optimum pH used to achieve a maximum cobalt complex stability appeared in the highest absorbance and most obvious peak, different kinds of buffer solutions were studied for complex formation between cobalt and the two previously prepared reagents, R1 and R2. In addition, Fig. 3 was designated to show the effect of pH values of universal buffer solutions on the Co(II) complexes. Particularly, the increase of absorbance appeared with increasing pH and gave the highest absorbance at pH 8.97 for Co(II)-R1 and pH 10.98 for Co(II)-R1. As seen, the use of alkaline medium produced the best results for the Co(II) complexes under investigation. An increase in the absorption intensity at optimum pH values was reached to the optimal value after adding 3.0 mL of pH 8.97 for Co(II)-R1 and 4.0 mL of pH 10.97 for Co(II)-R2 using a universal buffer solution.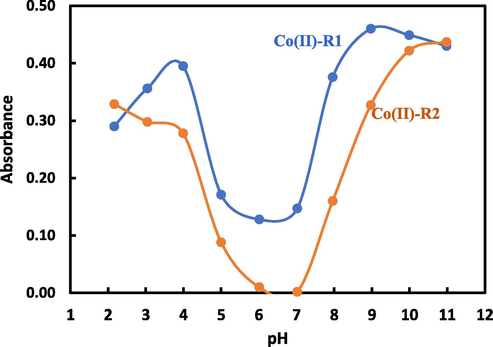
The effect of pH of universal buffer on the absorption intenistry for Co(II) complex between 1.0 mL of 1.0 × 10⁻³ M Co(II) and 1.0 mL of 1.0 × 10⁻³ M reagent solution.
3.3.2 Effect of reagent volume
The best reagent volume for the cobalt complexes with R1 and R2 was investigated and determined in this study. The reagent volumes were varied in a range of 1.0–5 mL of 1.0x10⁻³ M reagent concentration as shown in Fig. 4. For Co(II)-R1 complex, the use of 4.0 mL from R1 reagent gave a high stability and orange color development while at lower volumes, the absorbance decreased. Whereas, a 2.5 mL of 1.0x10⁻³ M of R2 was the optimum in case of Co(II)-R2 complex.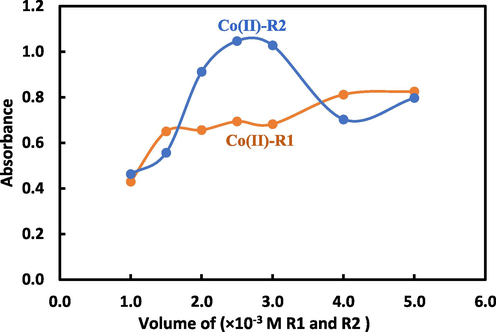
The volume effect of 1.0x10⁻³ M solution of R1 and R2 on the absorption spectra for Co(II) complexes using 0.5 mL of 1.0 × 10⁻³ M Co(II).
3.3.3 Effect of surfactants
The effect of different types and different volumes (0.5, 1.0, 1.5 mL) 0.5 % (w/v), for SDS and 0.5 % (v/v) for Triton X-100, and Tween-20 on the absorbance of Co(II)-R1 and Co(II)–R2 complexes was studied, and it showed no predictable effect in this study and did not affect the method sensitivity.
3.3.4 Influence of sequence of addition
The study also examined the impact of varying the sequence of addition during the complex formation between Co(II) and the two reagents, as this could potentially yield insightful findings. Interestingly, different sequence orders of mixing the reagents, cobalt ion, and buffering solution revealed that the most effective order which produced the highest absorption for cobalt complexes with R1 and R2 was (Co(II)-buffer-R1) and (Co(II)-R2-buffer), respectively. Other achievable orders of addition present not perfect peaks with a low absorbance response. Notably, experimenting with different sequence orders for combining the reagents, cobalt ion, and buffering solution yielded interesting results. It was found that the most effective sequences, which produced the highest absorption for cobalt complexes with R1 and R2, were (Co(II)-buffer-R1) and (Co(II)-R2-buffer), respectively.
3.3.5 Effect of temperature and time
To investigate the influence of time on the peak intensity of the cobalt complex at its maximum wavelength, (optimum conditions), the absorbance value was measured at different time intervals up to 30 min. The obtained results for R1-Co(II) complex found that six minutes is an appropriate time to reach the optimum absorbance properties. While in the case of R2 complexes, four minutes were required to reach a stable value of absorbance and a perfect peak. Furthermore, to elucidate the influence of temperature on cobalt complexes absorbance, different temperatures between 23 °C and 55 °C were examined. The results showed an obvious steady absorbance for all cobalt complexes at different temperature. Therefore, 23 °C was selected to perform all the measurements.
3.4 Determination of stoichiometric ratio
The stoichiometric ratios of the ion–associate complexes generated between the investigated cobalt ion and the azo dyes species were found by applying the continuous variation method (Gouda et al., 2016, Job, 1928). Fig. 5 represents the stoichiometric ratio for cobalt complexes with two reagents (R1 and R2) was (1:2) (Co(II):Reagent). The plot between absorbance and mole fraction of Co(II) shows that the intersections is at 0.3 and this finding support the stoichiometric ratio. Based on these results, the expected structure for cobalt complexes with the studied reagents are illustrated in Fig. 6.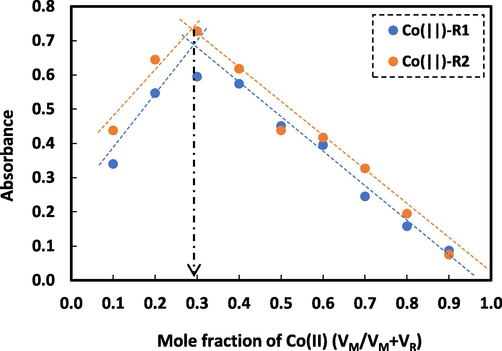
Job s process of continuous variation for Co(II) complexes with R1 and R2 at the optimum conditions.
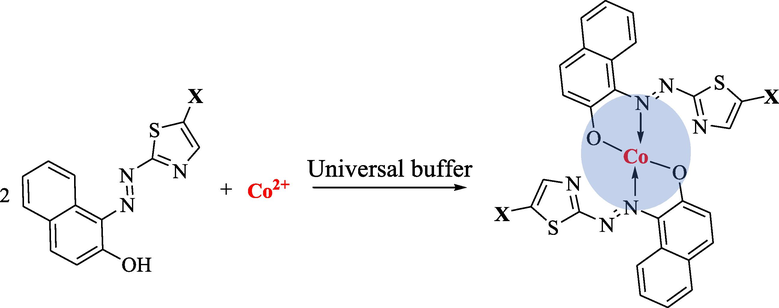
The (2:1) (R:Metal) structure for Co(II) complexes with R1 and R2 (X = fluorene moiety for R1 and pyrene moiety for R2).
3.5 Validation of the developed methods
3.5.1 Statistical analytical parameters
By numerous methods of optimal complex formation parameters, the relationship between peaks and their absorbance’s for the two synthesized azo dyes reagents and concentration of Co(II) is obtained. Fig. 7 (a,b) represents the calibration graph for spectrophotometric determination of cobalt ion with reagents R1 and R2, in that order.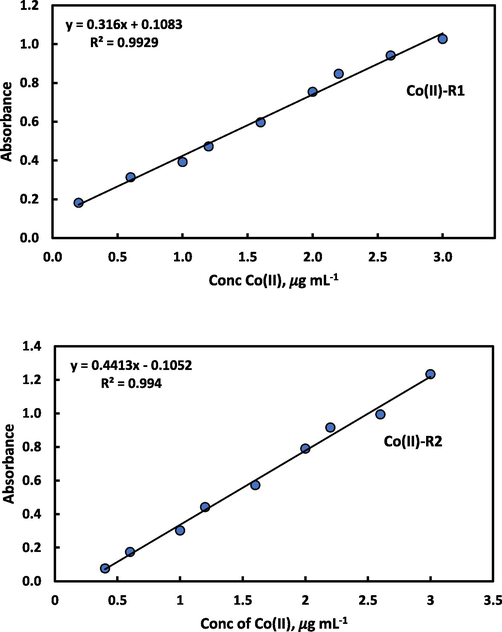
Calibration curve for determination of Co(II) using 4.0 mL of 1.0 × 10⁻³ M R1 after addition of 3.0 mL universal buffer of pH 8.97 and 2.5 mL of 1.0 × 10⁻³ M R2 after addition of 4.0 mL universal buffer of pH 10.98.
Table 2 shows the statistics of the used two reagents with results showing that, the linearity range for micro determination of Co(II) utilizing the reagents R1 and R2 were 0.2–3.0 and 0.4–3.0 μg mL−1, respectively. The calibration curves of Co(II)-R1 and Co(II)-R2 complexes represent a good linearity with a correlation coefficient (r) 0.9929 and 0.994, in that order. The detection limit (LOD) and quantification (LOQ) were calculated according to IUPAC recommendations (Guideline, 2005). The LOD was found to be 0.034 and 0.025 and LOQ determined as 0.102 and 0.076 μg mL−1 in that order. 1Confidence level 95 %, n = 6 and the theoretical value of t at 5 degree of freedom is 2.571.
Parameter
Co(II) – R1
Co(II) – R2
Color of complex
Orange
Orange
Type of buffers
Universal
Universal
Working pH
8.97
10.97
Volume of buffer, mL
3.0
4.0
Amount of reagent,1 × 10−3, mL
4
2.5
Sequence of addition
Co-B-R1
Co-R2-B
Time, min
6.0
4.0
λmax (nm), A curve
358 nm
360 nm
λmax (nm), B curve
424 nm
444 nm
λmax (nm), C curve
472 nm
470 nm
Beer law range, (μg/mL)
0.2 – 3.0
0.4 – 3.0
Detection limit, (μg/mL)
0.034
0.025
Quantification limit, (μg/mL)
0.102
0.076
Standard deviation (SD)
0.018
0.045
Relative Standard deviation (RSD)
2.46 %
5.65 %
Variance
3.37 × 10 −4
2.0332 × 10 −3
Error %
0.75
1.84
Slope
0.316
0.436
intercept
0.108
−0.099
Correlation coefficient
0.9929
0.994
Molar Absorptivity (×104 L mol −1 cm−1)
1.78
2.6
t-test 1
−1.33
0.434
Confidence limit 1
± 0.0192
± 0.047
Table 3 showed a comparison between some previous studies for spectrophotometric quantification of Co(II) using reagents and our obtained results using R1 and R2. This comparison indicated that the obtained linear range, detection limit and molar absorptivity, are in a good agreement and reasonable values in the light previous methods (Akl Alharawi 2018, Chandravanshi Asgedom 1995, Devi Reddy 2012, Nassir, 2007, Rajni Usha 2012, Shaheed et al., 2016, Soomro Shar 2014, Sulaiman Hamoudi 2018). Despite the existence of prior spectrophotometric techniques and alternative approaches for cobalt ion estimation, the discovered method employing newly synthesized azo dyes reagents stands out for its ease of use, high sensitivity, and time-saving nature. Consequently, the proposed method for the determination of cobalt ions was conducted in a few actual samples, in order to verify its reliability and validity. Furthermore, the created approach was labor-saving as the performance of any extraction or the use of numerous chemicals is not required prior to analysis. a4-(2-Pyridyl azo) resorcinol. bN1-Hydroxy-N1, N2-diphenylbenzamidine. c1-Nitroso-2-naphthol. d2-(4-Methoxyphenyl) azo (4, 5-dipheny imidazole). e2-Hydroxy-1-naphthaldehyde-p-hydroxybenzoichydrazone. f4-(6-Nitro-2-benzothiazolylazo) resorcinol. g The proposed methods.
Reagents used
R2
Linear range, μg mL−1
Detection limit,
μg mL−1
Molar absorptivity L mol−1 cm−1
Ref.
Azo dye reagenta
–
0.01–0.32
3.09 × 10⁻³
1.5 × 10⁴
(Akl and Alharawi, 2018)
Mordant Blue 9
0.999
0.004–1
4.006 × 10⁻³
3.97 × 10⁴
(Sulaiman and Hamoudi, 2018)
HDPBA reagentb
–
0.1–12
0.04
7.0 × 10³
(Chandravanshi Asgedom 1995)
NNPhc
0.999
0.12–4.0
0.12
2.05 × 10⁴
(Soomro and Shar, 2014)
MPAId
0.9989
3.00–50.00
2.083
0.2703 × 10⁴
(Shaheed et al., 2016)
HNHB reagente
0.9999
0.118–3.534
0.04
2.3 × 10⁴
(Devi and Reddy, 2012)
Alizarin Red S
0.999
0.293–4.124
–
–
(Rajni and Usha, 2012)
Azo dye reagentf
0.9997
1–8
0.2
4857.1
(Nassir, 2007)
R1
0.9964
0.2–3.0
0.034
1.78 × 10⁴
PM*
R2
0.9955
0.4–3.0
0.025
2.6 × 104
PM*
3.5.2 Analytical applications
Based on the exceeding achieved methods and at the optimal conditions, Co(II) was spectrophotometric micro determined in some tap and wastewater samples. Table 4 represents data measured for spiked H2O with a various quantity of Co(II), the average of recovery percent of the methods for all measurements were in the ambit of 99.1 % confirming that this assay can be applied to be used for determination of cobalt metal ions in different analytical samples with high degrees of efficacy and precision.
Sample
[Co(II)], μg mL−1
Recovery %
Added
Found + SD 1
R1
R2
R1
R2
Tap water
–
n.f 2
n.f 2
–
–
0.5
0.502 ± 0.01652
0.514 ± 0.015716
100.4
102.8
1
0.976 ± 0.018148
1.002 ± 0.017926
97.6
100.2
1.5
1.483 ± 0.036005
1.434 ± 0.024685
98.86
95.6
2
1.919 ± 0.03759
1.985 ± 0.046519
95.95
99.25
Wastewater
–
n.f 2
n.f 2
–
–
0.5
0.511 ± 0.02816
0.487 ± 0.015011
102.2
97.4
1
0.986 ± 0.018009
0.972 ± 0.009292
98.6
97.2
1.5
1.435 ± 0.026839
1.432 ± 0.007638
95.66
95.4
2
1.973 ± 0.028219
1.924 ± 0.023502
98.65
96.2
4 Conclusions
Utility of the two new synthesized azo dyes based fluorophores reagents, R1 and R2 were used successfully for spectrophotometric detection of cobalt ion. The structure of the prepared reagents was investigated and confirmed using 1H NMR, 13C NMR and DEPT-135 NMR. The developed procedure based on a formation of stable complexes between Co(II) and R1 and R2. Based on this research, the stoichiometric ratio for the azo dye reagents and cobalt complexes was determined to be (1:2) (Co(II):reagent). The chelation between cobalt and the used reagent was employed for the determination of cobalt in many spiked water samples, which can be easily determined with rapid, accurate, and cost-effective methods. The results obtained were highly accurate compared to previously published methods.
Funding
This research did not receive any specific grant from funding agencies in the public, commercial, or not-for-profit sectors.
CRediT authorship contribution statement
Ali Sayqal: Main idea, Conceptualization, Methodology, Data curation, Validation, Investigation, Visualization, Project administration, Supervision, Funding acquisition, Writing – review & editing the manuscript. Muthibah M. Alotaibi: Main idea, Conceptualization, Methodology, Data curation, Validation, Investigation, Visualization, Project administration, Supervision, Funding acquisition, Writing – review & editing the manuscript. Mohammed A. Kassem: Conceptualization, Methodology, Validation, Data curation and draft preparation. Saleh A. Ahmed: Conceptualization, Methodology, Data curation, NMR interpretation, Validation, Writing – review & editing the manuscript.
Acknowledgment
We hereby acknowledge Umm Al-Qura University for providing us with all facilities and support required to perform the practical work.
Availability of data and materials: All of these data and materials are available upon request.
References
- Metal complexes of azo compounds derived from 4-acetamidophenol and substituted aniline. Arab. J. Chem.. 2012;5(2):251-256.
- [Google Scholar]
- A green and simple technique for flotation and spectrophotometric determination of cobalt (II) in pharmaceutical and water samples. Egypt. J. Chem.. 2018;61(4):639-650.
- [Google Scholar]
- Synthesis and spectroscopic characterization of rhodanine azo dyes as selective chemosensors for detection of iron (III) Chem. Data Collect.. 2020;28:100456
- [Google Scholar]
- Ali, H.M., Badr, S.Q.,Hassan Al-Kinani, M.F., 2019. DNA Binding three Azo Dyes as new Antibiotics. IOP Conference Series: Materials Science and Engineering, 2019. Vol. 571, pp. 012102. IOP Publishing.
- Environmental pollution with heavy metals: A public health concern. Heavy Metals-Their Environmental Impacts and Mitigation. 2021:771-783.
- [Google Scholar]
- Review on azo-compounds and their applications. Journal of Catalyst & Catalysis.. 2021;8(2):8-16p.
- [Google Scholar]
- A new colorimetric chemosensor based on 1, 3, 4-oxadiazole derivative for the high selectivity and sensitivity of Fe3+ ion detection. J. Mol. Struct.. 2022;1251:132019
- [Google Scholar]
- Solvatochromic effect on UV–vis absorption and fluorescence emission spectra, second-and third-order nonlinear optical properties of dicyanovinyl-substituted thienylpyrroles: DFT and TDDFT study. J. Mol. Liq.. 2016;220:495-503.
- [Google Scholar]
- Classifications, properties, recent synthesis and applications of azo dyes. Heliyon.. 2020;6(1)
- [Google Scholar]
- Spectrophotometric determination of cobalt by extraction of its N1-hydroxy-N1-N2-diphenylbenzamidine complex. Chemia Analityczna.. 1995;40:225-229.
- [Google Scholar]
- Applications of metal complexes dyes in analytical chemistry. IntechOpen: In Dyes and Pigments-Novel Applications and Waste Treatment; 2021.
- Devi, V.,Reddy, V.K., 2012. Spectrophotometric determination of iron (II) and cobalt (II) by direct, derivative, and simultaneous methods using 2-hydroxy-1-naphthaldehyde-p-hydroxybenzoichydrazone. International journal of analytical chemistry. 2012.
- A facile ratiometric and colorimetric azo-dye possessing chemosensor for Ni2+ and AcO− detection. Supramol. Chem.. 2015;27(10):654-660.
- [Google Scholar]
- UV-Vis spectrophotometric determination of selected heavy metals (Pb, Cr, Cd and As) in environmental, water and biological samples with synthesized glutaraldehyde phenyl hydrazone as the chromogenic reagent. European Journal of Advanced Chemistry Research.. 2021;2(3):1-5.
- [Google Scholar]
- Nucleophilicity and solvent effects on the kinetics of 4-(pyren-1-yl) thiazol-2-amine interaction with 4, 6-dinitrobenzofuroxan. Arab. J. Chem.. 2020;13(2):3702-3713.
- [Google Scholar]
- Selective and sensitive spectrophotometric method to determine trace amounts of copper metal ions using Amaranth food dye. Spectrochimica Acta Part a: Molecular and Biomolecular Spectroscopy.. 2018;203:450-454.
- [Google Scholar]
- Optimized and validated spectrophotometric determination of two antifungal drugs in pharmaceutical formulations using an ion-pair complexation reaction. Journal of Taibah University for Science.. 2016;10(1):26-37.
- [Google Scholar]
- Validation of Analytical Procedures: Text and Methodology.. 2005;Q2(R1). 1 (20):05.
- Hashemi, S.,Kaykhaii, M., 2022. Azo dyes: Sources, occurrence, toxicity, sampling, analysis, and their removal methods. 267-287.
- Spectrophotometric Determination of Copper (II) using 2, 2 [O-Tolidine-4, 4-bis azo] bis [4, 5-diphenyl imidazole](MBBAI) Baghdad Sci J.. 2020;17(1):287-294.
- [Google Scholar]
- Analytical Chemistry Division Commission on Analytical Reactions and Reagents.. 1978;465
- Blood, hair and feces as an indicator of environmental exposure of sheep, cow and buffalo to cobalt: A health risk perspectives. Sustainability.. 2021;13(14):7873.
- [Google Scholar]
- Formation and stability of inorganic complexes in solution. Ann. Chim.. 1928;9(10):113-134.
- [Google Scholar]
- Kazi, T.G., Shah, F., Afridi, H.I., Khan, S., Arian, S.S.,Brahman, K.D., 2012. A green preconcentration method for determination of cobalt and lead in fresh surface and waste water samples prior to flame atomic absorption spectrometry. Journal of analytical methods in chemistry. 2012.
- Spectrophotometric Determination of Cobalt (II) Journal- Chemical Society of Pakistan.. 1979;1:73-74.
- [Google Scholar]
- Rapid and simple spectrophotometric determination of Mn (II), Fe (III), Co (II), Ni (II) and Cu (II) ions in natural samples using 2-(2-hydroxynaphth-1-ylazo)-pyridine. Egypt J Chem.. 2010;53(6):885-902.
- [Google Scholar]
- Multi-functional fluorescent responses of cobalt complexes derived from functionalized amide-bridged ligand. Dyes Pigm.. 2020;174:108064
- [Google Scholar]
- Solvent and substituent effects on spectroscopical changes of some diazoaminobenzene derivatives. Spectrochimica Acta Part a: Molecular and Biomolecular Spectroscopy.. 2005;61(13–14):3102-3107.
- [Google Scholar]
- The use of complex formation manner for spectrophotometric analysis of gatifloxacin drug based on Co (II), Ni (II) and La (III) ions. Heliyon.. 2021;7(1)
- [Google Scholar]
- Spectrophotometric Determination of Cobalt (II) Using 4-(6-Nitro-2-benzothiazolylazo) resorcinol. National Journal of Chemistry.. 2007;26:263.
- [Google Scholar]
- Detection of azo dyes and aromatic amines in women undergarment. J. Environ. Sci. Health A. 2016;51(9):744-753.
- [Google Scholar]
- A new aggregation-induced emission-based fluorescent probe for effective detection of Hg2+ and its multiple applications. Chin. Chem. Lett.. 2023;108237
- [Google Scholar]
- Simultaneous determination of zinc (II) and cobalt (II) by first order derivative spectrophotometry in triton X-100 micellar media. Research Journal of Chemical Sciences.. 2012;2231:606X.
- [Google Scholar]
- Solid-Phase Extraction and Detection by Digital Image Directly in the Sorbent: Determination of Nickel in Environmental Samples. Water Air Soil Pollut.. 2020;231:476.
- [Google Scholar]
- Development a spectrofluorometric micellar supported encapsulated method for micro determination of silver ion using new 2, 6-disubstituted pyridine derivatives. Spectrochimica Acta Part a: Molecular and Biomolecular Spectroscopy.. 2020;242:118711
- [Google Scholar]
- Spectrophotometric study for determination of cobalt (II) by the reagent [2-(4-methoxyphenyl) azo (4, 5-dipheny imidazole)](MPAI) International Journal of Pharmacy and Pharmaceutical Research.. 2016;6(4):671-683.
- [Google Scholar]
- A simple spectrophotometric method for the determination of cobalt (II) using 1-nitroso-2-naphthol in anionic aqueous solution of sodium dodecyl sulphate. Int J Chem Sci.. 2014;12:982-992.
- [Google Scholar]
- Spectrophotometric determination of cobalt (II) with mordant blue 9-application to vitamin B12 (injections and powder) Raf. J. Sci.. 2018;27:93-100.
- [Google Scholar]
- Azo dyes–biological activity and synthetic Strategy. Chemik Science-Technique-Market.. 2012;66:1298-1307.
- [Google Scholar]
- A new colorimetric and fluorescent ratiometric sensor for Hg2+ based on 4-pyren-1-yl-pyrimidine. Tetrahedron. 2012;68(14):3129-3134.
- [Google Scholar]
- Synthesis, substituent effects and solvatochromic properties of some disperse azo dyes derived from N-phenyl-2, 2′-iminodiethanol. J. Mol. Liq.. 2009;148(1):35-39.
- [Google Scholar]
- Azobenzene disperse dye-based colorimetric probe for naked eye detection of Cu2+ in aqueous media: Spectral properties, theoretical insights, and applications. J. Photochem. Photobiol. A Chem.. 2018;356:652-660.
- [Google Scholar]
- Metal-/carboxylate-directed four d10 piperazine-amide-based coordination polymers for the fluorescent detection of nitrophenol and nitroaniline in various water environments. J. Mol. Struct.. 2024;1297:136929
- [Google Scholar]
- A colorimetric and NIR fluorescent probe for ultrafast detecting bisulfite and organic amines and its applications in food, imaging, and monitoring fish freshness. Food Chem.. 2024;438:137987
- [Google Scholar]
Appendix A
Supplementary data
Supplementary data to this article can be found online at https://doi.org/10.1016/j.arabjc.2024.105686.
Appendix A
Supplementary data
The following are the Supplementary data to this article:Supplementary Data 1
Supplementary Data 1


