

Translate this page into:
Comprehensive screening, separation, extraction optimization, and bioactivity evaluation of xanthine oxidase inhibitors from Ganoderma leucocontextum
* Corresponding author: E-mail address: sainan_85@163.com (S. Li)
-
Received: ,
Accepted: ,
Abstract
This study presents a novel approach for screening, extracting, and preparing xanthine oxidase (XOD) inhibitors from Ganoderma leucocontextum. These inhibitors have potential applications in drug and food research and development. Affinity ultrafiltration-liquid chromatography coupled with mass spectrometry, molecular docking (MD), and molecular dynamics simulations (MDS) were employed to accurately and rapidly screen bioactive compounds as XOD inhibitors. These methods allowed for structural identification and assessment of target efficacy, enabling a comprehensive analysis of the active compounds at three levels. To overcome challenges related to low content and extraction efficiency of bioactive compounds from G. leucocontextum, a complex, activity-oriented preparation method was developed, utilizing a BP neural network combined with response surface methodology and universal quasichemical functional group activity coefficient-based (UNIFAC) activity-driven consecutive-countercurrent chromatography. Optimal process conditions, such as alcohol concentration, material-to-liquid ratio, extraction time, and the number of extractions were determined, leading to theoretical predictions of triterpene yield. Seven active ingredients, including Ganoderic acid A, Ganoderic acid D, Ganodermanontriol, Ganoderiol F, Ganoderiol B, Ganoderiol A, and Ganoderal A, were successfully identified and isolated using a solvent system of n-hexane/ ethyl acetate/ methanol/ water (4.0: 8.0: 5.3: 3.0, v/v/v/v). The mechanism of action of these xanthine oxidase inhibitors was further elucidated through enzyme kinetics. These findings highlight the potential of G. leucocontextum extracts in gout prevention and treatment, advancing our understanding of the molecular mechanisms of edible fungi and offering promising prospects for discovering new therapeutic agents from natural food sources.
Keywords
AUF-LC-MS
G. leucocontextum
PSO-BP
UNIFAC activity-oriented CCC
XOD inhibitors

1. Introduction
Ganoderma leucocontextum (G. leucocontextum) is a newly discovered species from Tibet in 2014 [1]. It contains unique triterpene and polysaccharide components having anticancer and immune regulatory effects not found in traditional Ganoderma lucidum varieties [2-5]. Gout is a metabolic disorder caused by impaired purine metabolism [6,7]. Xanthine oxidase (XOD) is a key enzyme that converts xanthine and hypoxanthine into uric acid. Inhibiting XOD activity can reduce uric acid production, providing a therapeutic strategy for gout [8]. Currently, common XOD inhibitors are allopurinol and febuxostat [9,10]. However, they have side effects such as liver and kidney damage, fever, and an increased risk of cardiovascular diseases, which limit their clinical use [11]. Compared to chemical drugs, plant-based drugs usually have fewer adverse effects, and their multiple components in synergy make them promising options for treating gout. Therefore, exploring the anti-gout potential of G. leucocontextum is crucial for improving human health.
The efficient screening of bioactive components in complex matrices of traditional Chinese medicine is of great significance for elucidating their pharmacological nature. Traditional methods of screening the activity of traditional Chinese medicine, such as animals, tissues/organs, and cells, are not only blind but also ignore the systemic and holistic action of traditional Chinese medicine. At the same time, the screening cycle is long, the success rate is low, and it is time-consuming and costly. To solve these problems, this study adopted an affinity ultrafiltration (AUF) screening method based on receptor-ligand interactions, which can quickly and simply achieve high-throughput screening of compounds and overcome the complex operational problems faced due to traditional screening methods [12-16]. Subsequently, molecular docking (MD) was used to simulate the interaction between active monomeric components and XOD, explore their interaction sites, and predict their binding energies [17-20]. Finally, molecular dynamics simulation (MDS) was used to predict the dynamic behavior of substances to evaluate the structural stability of biological macromolecules [21-25]. This multi-level approach provides comprehensive coverage of active component screening, structural analysis, and molecular mechanism research.
The triterpenoid compounds in G. leucocontextum are the principal secondary metabolites and active constituents. However, at present, there is no appropriate extraction technology to guarantee the optimal extraction of the bioactive components in G. leucocontextum. Research indicates that the combination of the Box-Behnken design and BP neural network can optimize the process of extracting Chinese medicine, enhance the accuracy and reliability of the results, and overcome the limitations of traditional regression models [26,27]. Nevertheless, when constructing the BP neural network, the random initialization of connection weights can lead to prediction errors, and the gradient descent training method is slow and prone to getting trapped in local minima, thereby hindering the achievement of the global optimal solution [28]. Particle swarm optimization (PSO) is a population-based intelligent algorithm that can simulate the collective behaviors of organisms, such as birds or fish, to find the best solution. The application of PSO can improve the prediction accuracy and generalization ability [29,30]. Therefore, the combination of the Box-Behnken response surface method and PSO-BP multi-criteria optimization can enhance the extraction process of total triterpenoids in G. leucocontextum and offer a new approach for process optimization.
High-speed countercurrent chromatography (HSCCC) has become increasingly popular in the separation and purification of natural products due to its fast separation speed, irreversible adsorption, and large sample size [31-34]. However, long-term separation or repeated preparation can lead to stationary phase wastage. The UNIFAC (universal pseudo-chemical activity coefficient) model based on the group contribution theory allows calculation of the total activity coefficient and the molar fractions of each component based on phase equilibrium data, thereby enabling the calculation of the volume of each solvent in the mixture system, allowing for the preparation of individual solvent systems [35-39]. Therefore, the coupling of the UNIFAC model with activity-based continuous countercurrent chromatography is considered to be an energy-saving and effective separation strategy. Enzyme kinetics focuses on the study of the rate of enzyme-catalyzed reactions and the factors that influence these rates [40-42]. In this study, the inhibitory activity of an XOD inhibitor isolated from G. leucocontextum was evaluated by enzymatic reaction kinetics to minimize false positive results in experiments. Additionally, by conducting in vitro enzymatic kinetic studies, we can explore the structure-activity relationship between the inhibitor and XOD and the various factors that affect the reaction rate, and further elucidate the inhibition type and mechanism of action.
In this study, we employed Affinity ultrafiltration-liquid chromatography and mass spectrometry (AUF-LC-MS), molecular docking, and molecular dynamics simulation to comprehensively screen and identify potential XOD inhibitors from G. leucocontextum. Furthermore, we innovatively combined the response surface with POS-BP to optimize the extraction conditions of total triterpenes from G. leucocontextum. Additionally, we applied the universal quasichemical functional group activity coefficient-based (UNIFAC) mathematical model to calculate the parameters of the activity-guided consecutive-countercurrent chromatography (CCC) solvent system to efficiently separate and purify high-purity XOD inhibitors while reducing the use of organic solvents. Finally, we conducted in vitro enzymatic kinetic experiments to study enzymatic reaction rates, inhibition patterns, and pharmacological action mechanisms. By combining modern computational techniques (molecular docking and molecular dynamics simulation) with classical separation techniques (CCC and HPLC), we established a rapid, efficient, and accurate process for the discovery and separation of active compounds, thus providing a transferable technical platform for the development of natural drugs.
2. Materials and Methods
2.1. Apparatus
Consecutive-countercurrent chromatography (CCCC) was performed on a TBE300B Spectrum HSCCC system (TAUTO, Shanghai, China). A 2545 Quaternary Gradient Module pump, Waters 2489 UV/Vis detector, Fraction Collector III. A Waters 2695 instrument containing a Waters PDA detector (Milford, CT, USA) was used to perform liquid chromatography (LC). High-performance liquid chromatography (HPLC) was performed using a Waters 2695 system equipped with a Waters 2998 Diode array detector and analytic SunFireTM C18 Column (internal diameter 5.0 μm, 250×4.6 mm; Waters Corporation). A Q-Exactive Orbitrap™ mass spectrometer (Thermo Fisher Scientific, Waltham, MA, USA) was used for the mass spectrometry (MS) assay.
2.2. Reagents and materials
Ganoderma leucocontextum was sourced from Nyingchi County, Tibet Autonomous Region, China. XOD and Tris-HCl buffer solution were obtained from Fluka. A Microcon YM-100 ultrafiltration device, with a molecular weight cutoff of 100 kDa, was used for ultrafiltration (Bedford, USA). HPLC-grade acetonitrile was supplied by Thermo Fisher Scientific, and all other solvents and reagents of analytical grade were purchased from Beijing Chemical Engineering Corporation. Water was purified using the Milli-Q® system.
2.3. Screening of potential XOD in G. leucocontextum by AUF-LC-MS
2.3.1. Affinity ultrafiltration method
AUF-LC-MS enabled the rapid identification of ligands capable of binding to enzymes, while affinity-guided isolation facilitated the efficient preparation of ligands for subsequent bioactivity validation. For the incubation mixtures, 40 μL of 100 mg/mL G. leucocontextum sample solution was combined with 90 μL of 0.2, 0.5, and 1.0 U/mL XOD in 90 μL Tris-HCl buffer solution, bringing the final volume to 220 μL. The mixture was incubated in a 37°C constant temperature water bath for 30 mins, injected into the affinity ultrafiltration (AUF) chamber, and centrifuged at 12,000 × g for 15 mins at 25°C. To release bound ligands, 200 μL of 50% methanol was added, followed by centrifugation at 12,000 × g for 15 mins, repeated three times, and analyzed via high performance liquid chromatography (HPLC). In a controlled experiment, the negative control group (treated with denatured enzyme) serves to account for non-specific reactions or background interference, thereby validating the specificity of the experimental results [43]. The binding degree to XOD was calculated as follows: Binding degree (%) = (A1 − A2)/A0 ×100%. where A0 is the peak area of the blank group, and A1 and A2 are the peak areas of the compound interacting with active and denatured XOD, respectively. The concentrated ultrafiltrate was analyzed via LC-MS, with a control experiment (without XOD) conducted prior to each screening for comparison.
2.3.2. HPLC method
The changes of XOD combined with XOD inhibitor were determined by high-performance liquid chromatography. HPLC strip: The detection wavelength of photodiode array detector (PDA) was 254 nm, the binary mobile phase consisted of acetonitrile (solvent D) and 0.01% formic acid water (solvent B), and the flow rate was 0-5 mins, 2% A at 0.7 mL/min. 5-35 min, 2∼45% A, 35∼55 min, 45% A, 55∼70 min, 45∼70% A, 70∼90 min, 70∼100% A, 90∼120 min, 100% A.
2.4. Computer simulation methods
2.4.1. Molecular simulation
The PubChem database () was utilized to retrieve the chemical structures of XOD inhibitors in “SDF” format, which were subsequently subjected to energy minimization and converted into “.pdbqt” format. The structure of XOD (PDB ID: 1fiq) was obtained from the RCSB database (). Pre-processing of the large proteins included the removal of side chains, identification of the active site, elimination of heteroatoms and water molecules, and the addition of hydrogen atoms. Autodock Tools 1.5.7 was used for molecular docking (MD) simulation to determine the inhibition sites and parameters with the interaction of amino acid residues and the formation of chemical bonds and combined with other experimental results to elucidate inhibitors the mechanism of action. Finally, the processed protein structures were visualized and analyzed using PyMOL to generate mock-up representations of the results.
2.4.2. Molecular dynamics simulation
Molecular dynamics simulation is often used to characterize the movement of atoms in a system, explore molecular interaction mechanisms, and analyze structural changes in matter. In this simulation, AmberTools22 and Gaussian 16W were used to add general amber force field (GAFF) and hydrogenation to small molecules, respectively, and calculate restrained electrostatic potential (RESP) potentials. The simulation operation was carried out at a static temperature of 300K and atmospheric pressure. Amber99sb-ildn was used in the force field, water molecules were used as solvent, and Na+ was added to neutralize the total charge in the simulated system. Upon completion, built-in tools within the software were employed to analyze trajectories by calculating root mean square deviation (RMSD), root mean square fluctuation (RMSF), and rotational radius for each amino acid trajectory, alongside assessments of free energy using molecular mechanics/poisson-boltzmann surface area (MM/PBSA) methods and evaluations based on free energy topography.
2.5. Extraction and optimization of triterpenoids from G. leucocontextum
2.5.1. Box-Behnken experiment design
The yield of triterpenoids from G. leucocontextum was assessed as the inspection index, utilizing the Vanil aldehyde-glacial acetic acid method to determine the extraction rate. Specifically, a series of oleanolic acid standard solutions (0.2 mg/mL) were prepared in test tubes in volumes of 0.1, 0.2, 0.4, 0.6, 0.8, and 1.0 mL. Each sample solution was treated with 0.2 mL of 5% Vanil aldehyde-glacial acetic acid solution and 0.8 mL of perchloric acid, then incubated for 15 mins in a constant temperature water bath at 70°C. Afterward, the samples were cooled in an ice bath for 5 mins, and 8 mL of ethyl acetate was added. The absorbance was measured at 546 nm after thorough mixing. The standard curve for oleanolic acid was established as y = 2.0067x − 0.0087y = 2.0067x − 0.0087y = 2.0067x − 0.0087 (R2 = 0.9991).
The yield of triterpenoids was calculated using the formula: X (%) = (A + 0.0087) × N × V/ 2.0026 × m. Where X is the total amount of triterpenes extracted from the sample; A is the absorbance value; N is the dilution factor; V is the volume of extracted liquid (mL); m is the sample material quality (g).
The Box-Behnken design was implemented based on the optimal results from preliminary single-factor experiments, which indicated an extraction environment of 70% ethanol, a liquid-to-solid ratio of 60 mL/g, an extraction time of 70 mins, and three extraction cycles. The response variable was set as the yield of total triterpenoids from G. leucocontextum, and four factors (alcohol concentration, material-liquid ratio, extraction time, and number of extractions) were tested at three levels each. A total of 29 randomized experimental runs were conducted, and the Box-Behnken design was facilitated using Design Expert 11.0 software.
2.5.2. PSO-BP optimization process parameters
This research utilized an artificial neural network model that comprised an input layer, a hidden layer, and an output layer [44]. The input layer incorporated nodes representing alcohol concentration, material-liquid ratio, extraction time, and the number of extractions, which were subsequently normalized. The normalization process was defined by the following formula: Dni = [2 × (Di – Dmin)/ ( Dmax – Dmin )] – Dmin. Where Di is the i th input in the training sample, Dni is the normalized result of Di. Dmax is the maximum value entered in the training sample, Dmin is the minimum value entered in the training sample.
After normalization, all the data was processed to -1∼1, which is more suitable for neural network processing. The total triterpene extraction rate of G. leucocontextum was taken as the node of the output layer.
Upon completing the training of the back propagation (BP) neural network, the network was simulated and optimized using experimental data. The BP neural network model was integrated with the particle swarm optimization algorithm to perform simulation experiments aimed at optimizing the process parameters for extracting total triterpenoids from G. leucocontextum. The Python programming language was employed to establish the operational framework for the particle swarm optimization algorithm. The training iterations were set to 1,000, the learning rate was defined as 0.01, and the target minimum error for training was established at 0.00001. Subsequently, a genetic algorithm was utilized to determine the optimal weight threshold, with an initial population size of 30, a maximum evolutionary generation of 50, a crossover probability of 0.8, and a mutation probability of 0.2.
2.6. XOD inhibitors were isolated from G. leucocontextum by activity-oriented CCC
2.6.1. Optimization of activity-oriented CCC solvent
The solvent systems for activity-oriented CCC were optimized. Given the weak polarity of the target Ganoderma triterpenes, solvent systems exhibiting both weak and medium polarity were selected for investigation. In the n-hexane/ ethyl acetate/ methyl alcohol/ water and petroleum ether/ ethyl acetate/ methanol/ water systems, the compound is dissolved in both the upper and lower phases. Therefore, “n-hexane/ ethyl acetate/ methyl alcohol/ water,” “n-hexane/ ethyl acetate/ acetonitrile,” “petroleum ether/ethyl acetate/methanol/water,” and “ethyl acetate/acetonitrile/water” were selected as the extraction solvent systems for optimization.
To assess the K values of the target compounds, preliminary experiments were conducted for each solvent system. Following the preparation of the solvent systems, wait for the solution to stratify. Subsequently, 2.0 mL of the upper and lower phases and 2.0 mg of G. leucocontextum extract were added to the test tube and completely dissolved. After the samples were stratified, 1.0 mL of the upper phase and 1.0 mL of the lower phase were taken and dried in the evaporating dish, then dissolved with 300 mL methanol and filtered through a 0.45 μm filter membrane and then determined by HPLC after standing. The formula for calculating the distribution coefficient is shown below: K = Aupper/Alower. In the above formula, Aupper is the peak area of the target compound in the upper phase and Alower is the peak area of the target compound in the lower phase.
2.6.2. Conventional method and UNIFAC model configuration solvent system
An n-hexane/ ethyl acetate/ methanol/ water (4.0: 8.0: 5.3: 3.0, v/v/v/v) solvent system was employed to isolate the target compounds, two different methods (methods 1 and 2) were used to prepare the two-phase solvent system. In method 1, the solvent was mixed in a separation funnel, followed by multiple oscillations and degassing, and left to rest until the upper and lower phases had completely stratified. In method 2, according to the UNIFAC model, the molar fraction and mass density of each solvent in the upper and lower phases of the solvent system were calculated, and the volume content of each reagent in the upper and lower phases was calculated according to the molecular weight of each reagent, to prepare the two-phase solvent system separately. Eqs (1) and (2) were used to calculate the proportions of different reagents in two phases in a two-phase solvent system [40,41]:
V1 is the volume of reagent 1. X1, X2..., and X n are the solvents 1, 2, 3..., and n molar fraction in a two-phase solvent system. V is the total volume of the stationary and mobile phases required for separation. ρ is the average density of the stationary and mobile phases. ρ1 is the mass density of solvent 1. D1, D2..., and Dn is the molecular weight of solvents 1, 2, 3..., and n. Da is the average molecular weight of the prepared stationary and mobile phases (Table 1).
| Mole fraction | Calculation parameters | |||||
|---|---|---|---|---|---|---|
| n-hexane | Ethyl acetate | Methanol | Water | Vt (mL) | ρt (g/cm) | |
| CAS Registry number | 110-54-3 | 141-78-6 | 67-56-1 | 7732-18-5 | 600 | 0.7995 |
| Upper phase | 0.3165 | 0.4406 | 0.1569 | 0.086 | 925 | 0.8764 |
| Lower phase | 0.0151 | 0.1377 | 0.3632 | 0.484 | ||
| Molecular mass (M) | 86.18 | 88.11 | 32.04 | 18.01 | ||
| Density (p) | 0.66 | 0.902 | 0.791 | 1 | ||
2.7. Kinetic analysis of XOD inhibition in G. leucocontextum
2.7.1. Solution preparation
Preparation of Tris-HCl buffer solution: Accurately weigh 121.01 g of Tris-HCl drug and use 1 L to remove the ionized water that was dissolved; the pH of the solution was adjusted to 7.5 using 0.10 mol/L hydrochloric acid, and the solution was stored in an airtight container.
XOD solution: Accurately weighed 6 mg 50 U/mg XOD was dissolved in 10.0 mL Tris-HCl buffer solution to obtain 30.0 U/L XOD solution. It was stored in the dark at -20°C. Before clinical use, the enzyme solution was prepared into 0.5, 1.0, 3.0, and 7.0 U/mL concentrations.
Xanthine solution: A certain amount of xanthine was accurately weighed and dissolved in 0.2 mL 1 mol/L NaOH, diluted with buffer solution. The pH was adjusted to 7.5, and xanthine solutions with concentrations of 50, 75, 100, 150, 175 mg/L were prepared.
XOD inhibitor configuration: Seven monomer compounds (Ganoderic acid A, Ganoderic acid D, Ganodermanontriol, Ganoderiol F, Ganoderiol B, Ganoderiol A, Ganoderal A) and positive control (allopurinol) were accurately weighed, respectively. It was dissolved in an appropriate amount of chromatographic methanol, prepared as 400 μg/mL storage solution, and diluted before use.
2.7.2. Evaluation of XOD inhibiting activity of active components in G. leucocontextum
In this study, a 96-well purple outer plate (corning 3635) was selected. In the reaction system of 200 μL, 175 mg/L xanthine solution of 100 μL, Tris-HCl of 40 μL, XOD inhibitor solutions in different concentrations 30 μL (Ganoderic acid A: 0.20, 5.00, 20.00, 60.00, 100.00 μg/mL; Ganoderic acid D: 0.10, 25.00, 60.00, 90.00, 125.00 μg/mL; Ganodermanontriol: 0.20, 6.00, 20.0, 55.00, 90.00 μg/mL; Ganoderiol F: 0.10, 9.00, 35.00, 60.00, 95.00 μg/mL; Ganoderiol B: 0.15, 4.00, 36.00, 76.00, 110.00 μg/mL; Ganoderiol A: 0.14, 6.10, 34.00, 68.00, 108.00 μg/mL; Ganoderal A: 0.15, 8.00, 27.00, 55.00, 96.00 μg/mL; allopurinol: 5.00, 10.00, 30.00, 60.00, 80.00 μg/mL) mix well and place in 37°C constant temperature water bath 15 mins, then added 30 μL XOD solution (3.0 U/mL) to initiate the reaction, which was carried out in 96-well enzymic labeled plates and incubated in 37°C constant temperature water bath for 15 mins. The absorbance was measured at 290 nm. The calculation results of reaction rate (Eq. 3) and inhibitory activity (Eq. 4) have been published as follows:
ΔAi is the difference value in absorbance of the sample group within 0-15 mins, and ΔA0 is the difference value in absorbance of the blank group within 0-15 mins. Vi is the reaction rate of the sample group, and V0 is the reaction rate of the blank group.
2.7.3. Evaluation method of enzyme inhibition type of monomer compound
In the above reaction system, fix the concentration of xanthine at 175 mg/L and prepare XOD solutions of different concentrations (0.0, 0.5, 1.0, 3.0, and 7.0 U/mL). The effects of different concentrations of XOD inhibitors on enzyme activity were determined. A linear fitting line was obtained by analyzing the correlation between reaction rate and enzyme concentration in enzymatic reaction kinetics. If multiple lines cross zero, the inhibitor is considered to exhibit reversible inhibition. If the line is parallel to the X-axis, the XOD inhibitor is considered irreversibly inhibited.
2.7.4. Determination of enzyme inhibition constants by different monomer inhibitors and study of inhibition mechanism
The concentration of XOD (3.0 U/mL) was fixed, and the concentration of the xanthine substrate solution was changed. The values of 75, 100, 125, 150, and 175 mg/L were used to determine the effects of different concentrations of Ganoderic acid A, Ganoderic acid D, Ganodermanontriol, Ganoderiol F, Ganoderiol B, Ganoderiol A, and Ganoderal A samples on the activity of xanthine substrates catalyzed by XOD. The trend of enzymatic reaction rates with different concentrations of substrates in the reaction system was determined. Under the conditions of different compound concentration inhibitors, 1/V is fitted to 1/[S], and the type of inhibition of Ganoderic acid A, Ganoderic acid D, Ganodermanontriol, Ganoderiol F, Ganoderiol B, Ganoderiol A, and Ganoderal A is judged according to the intersection of the lines on the axis. The kinetic parameters of the enzymatic reaction were calculated according to the Lineweaver-Burk double reciprocal plotting and quadratic plotting. The mechanism of inhibiting gout by inhibitor was obtained.
2.7.5. Data processing
GraphPad Prism, Excel 2021, and Origin 2018 software analyzed the data graph, and the experimental data were the average values of three parallel experiments.
3. Results and Discussion
3.1. Screening of potential XOD inhibitors by AUF-LC-MS
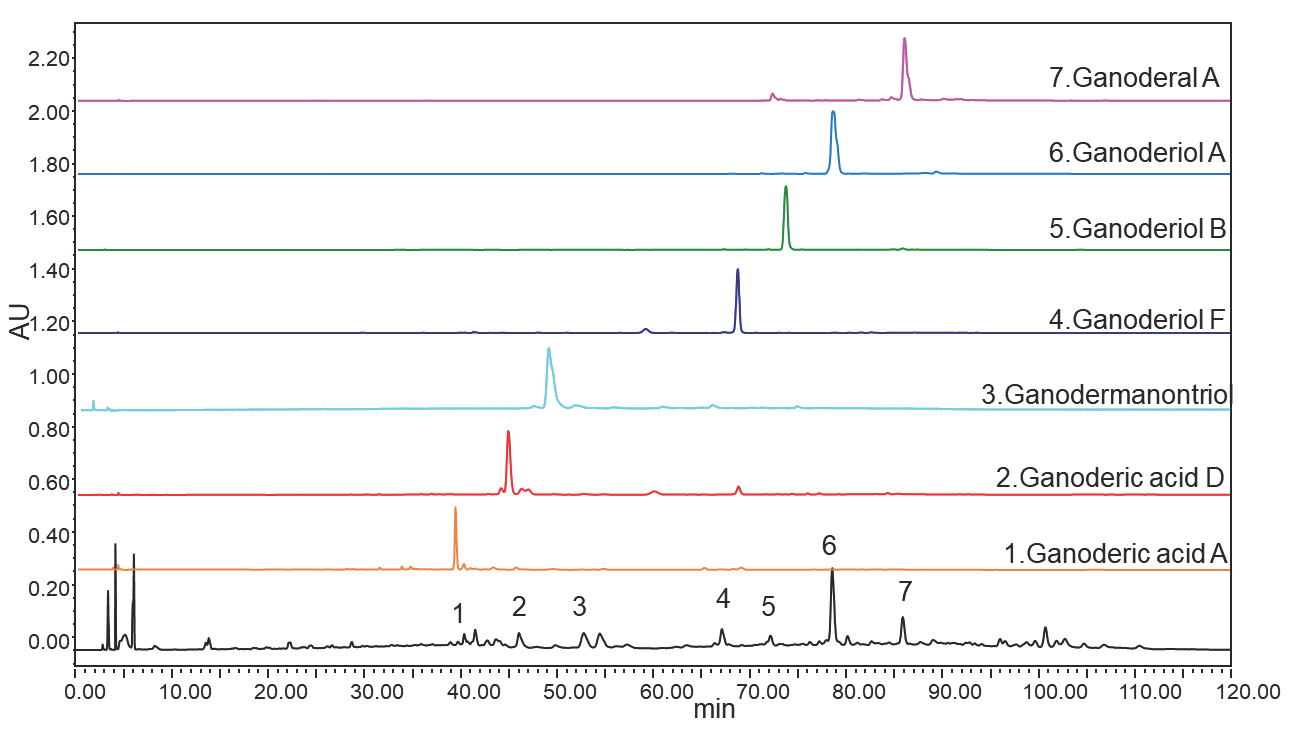
The outcomes of the ultrafiltration experiment following HPLC detection have been illustrated in Figure 1. The standard comparison method was employed to analyze the chromatographic peaks corresponding to the primary active compounds in the LC-MS chromatogram, with the findings summarized in Table 2.
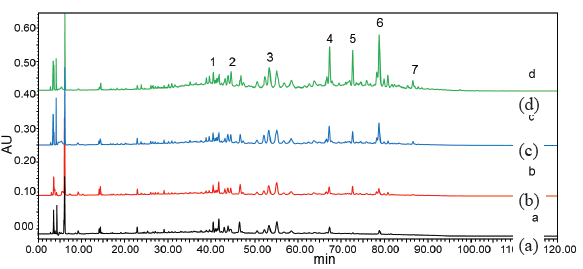
- HPLC results of ultrafiltration experiment. (a) negative control group, (b) 0.2 U/mL, (c) 0.5 U/mL, (d)1.0 U/mL. HPLC: High-performance liquid chromatography.
|
TR (min) |
Formula |
MS (m/z) |
MS2 (m/z) |
Identity | XOD (%) | ||
|---|---|---|---|---|---|---|---|
|
0.2 U/mL |
0.5 U/mL |
1.0 U/mL |
|||||
| 40.58 | C30H44O7 | 515.30 |
515.30, 497.29 |
Ganoderic acid A | 10.84 | 63.87 | 64.32 |
| 46.86 | C30H42O7 | 513.29 |
495.27, 451.28 |
Ganoderic acid D | 6.72 | 54.48 | 59.51 |
| 55.08 | C30H48O4 | 472.70 |
454.14, 396.20 |
Ganoderma nontriol |
85.46 | 98.92 | 190.69 |
| 67.12 | C30H46O3 | 454.35 |
436.03, 419.24 |
Ganoderiol F |
231.75 | 329.48 | 90.60 |
| 72.84 | C30H46O4 | 470.34 |
452.11, 352.46 |
Ganoderiol B |
282.04 | 119.82 | 121.36 |
| 78.68 | C30H50O4 | 374.38 |
459.23, 456.11 |
Ganoderiol A |
15.02 | 17.37 | 52.20 |
| 86.09 | C30H44O2 | 436.67 |
417.30, 402.02 |
Ganoderal A |
14.51 | 19.47 | 78.27 |
XOD: Xanthine oxidase.
Triterpenoids 1, 2, 3, 4, 5, 6, and 7 derived from G. leucocontextum demonstrated significant activity in conjunction with XOD. Mass spectrometry identified seven compounds: Ganoderic acid A, Ganoderic acid D, Ganodermanontriol, Ganoderiol F, Ganoderiol B, Ganoderiol A, and Ganoderal A, with the corresponding MS data available in the Supporting Information. A comparison of the HPLC chromatograms between the negative control and the samples exhibiting positive affinity for XOD (at concentrations of 0.2, 0.5, and 1.0 U/mL) showed increased HPLC peak areas for the seven primary target compounds from G. leucocontextum, indicating specific binding. The binding affinity reflects the potency of these seven compounds against XOD (Figure 1). These primary target compounds are successfully bound to XOD at concentrations of 0.2, 0.5, and 1.0 U/mL, demonstrating inhibitory effects on XOD activity. At an XOD concentration of 0.5 U/mL, Ganoderiol F displayed the highest binding affinity, while the other components exhibited comparable binding. The inhibitory effects of the seven primary target compounds on XOD activity were ranked as follows: (5) Ganoderiol B > (7) Ganoderal A > (6) Ganoderiol A > (4) Ganoderiol F > (1) Ganoderic acid A > (3) Ganodermanontriol > (2) Ganoderic acid D.
3.2. Computer simulation methods
3.2.1. Molecular docking result
Following the screening of active ingredients through ultrafiltration-mass spectrometry, the seven identified active components were further validated using MD techniques. In the MD process, the parameter of binding energy serves as an indicator of the interaction strength between the receptor and ligand. A binding energy value below zero signifies spontaneous binding between the ligand and receptor. The stability of the docking results is confirmed when the binding energy falls below -5; additionally, a larger absolute value of binding energy indicates a stronger interaction.
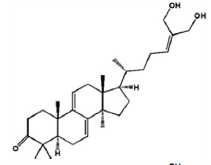
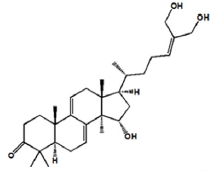
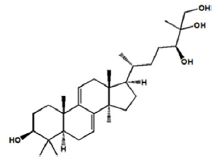
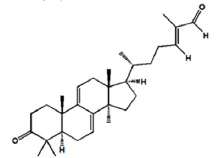
As shown in Figure 2, seven components strongly interact with XOD amino acid residues (Ganoderic acid A with ILE-264, ARG-394, LYS-395; Ganoderic acid D with ASP-360, PHE-337, TRP-336, ALA-338, ILE-358, ARG-426, ALA-1231; Ganodermanontriol with GLY-349, LEU-257, THR-354, PRO-400, LYS-395; Ganoderiol F with ALA-304, SER-307, LYS-310, ASN-130; Ganoderiol B with SER-347, LYS-256, LEU-404, ILE-403; Ganoderiol A with LYS-433, ASP-360, ARG-426, LYS-422, TRP-336, ALA-1231, GLY-1233; Ganoderal A with PHE-337, ALA-338, THR-354, SER-356, ILE-358, ARG-426, LYS-1228). XOD proteins interact with small molecular ligands through hydrophobic interactions, hydrogen bonds, and salt bridges. Binding energy values of −9.1, −9.8, −8.7, −7.7, −8.1, −8.8, and −8.5 kcal/mol, respectively (Table 3).
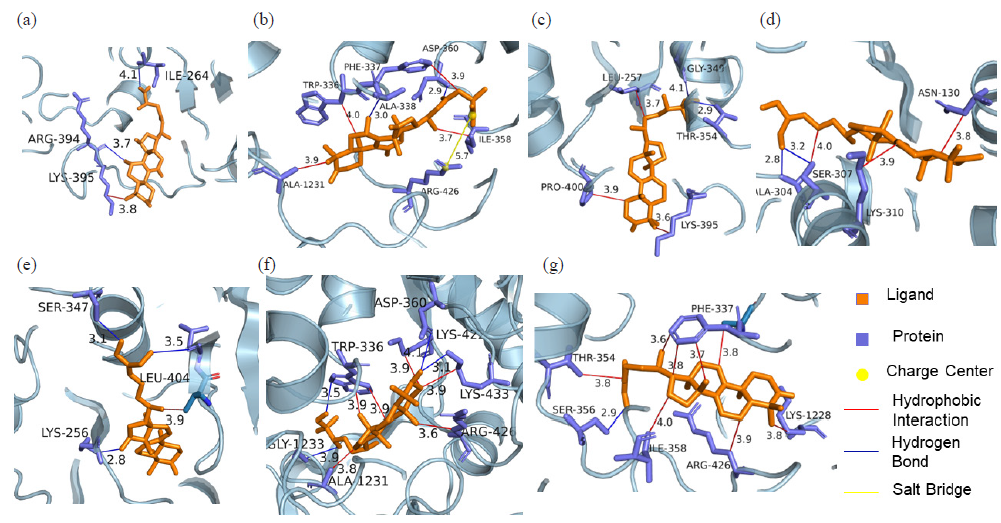
- Molecular docking of XOD inhibitors and XOD: (a) Ganoderic acid A-XOD, (b) Ganoderic acid D-XOD, (c) Ganodermanontriol-XOD, (d) Ganoderiol F-XOD, (e) Ganoderiol B-XOD, (f) Ganoderiol A-XOD, (g) Ganoderal A-XOD. CCC: Consecutive-countercurrent chromatography.
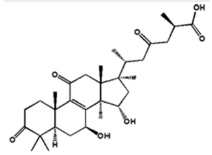
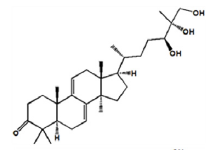
| Ligand name | Ligand structure | Intermol energy (kcal/mol) | Interaction force | Interactions amino acid |
|---|---|---|---|---|
| Ganoderic acid A |
|
-9.1 | Hydrophobic interaction, Hydrogen bonding |
ILE-264 ARG-394 LYS-395 |
| Ganoderic acid D |

|
-9.8 | Hydrophobic interaction, Hydrogen bonding, Salt Bridges |
ASP-360 ILE-358 ARG-426 ALA-338 PHE-337 TRP-336 ALA-1231 |
| Ganoder manontriol |
|
-8.7 | Hydrophobic interaction, Hydrogen bonding, Salt Bridges |
GLY-349 THR-354 LYS-395 PRO-400 LEU-257 |
| Ganoderiol F |
|
-7.7 | Hydrophobic interaction. Hydrogen bonding |
ALA-304 SER-307 LYS-310 ASN-130 |
| Ganoderiol B |
|
-8.1 | Hydrophobic interaction. Hydrogen bonding |
SER-347 LEU-404 ILE-403 LYS-256 |
| Ganoderiol A |
|
-8.8 | Hydrophobic interaction. Hydrogen bonding |
LYS-433 ASP-360 LYS-422 TRP-336 GLY-1233 ALA-1231 ARG-426 |
| Ganoderal A |
|
-8.5 | Hydrophobic interaction, Hydrogen bonding |
PHE-337 ALA-338 LYS-1228 ARG-426 ILE-358 SEP-356 THR-354 |
3.2.2. Molecular dynamics simulation results
The root mean square deviation (RMSD) was used to evaluate the stability of the simulation system [45] (Figure 3). The results indicated that the protein-ligand RMSD values were initially high during the first 100 ns of the simulation but gradually stabilized afterward, suggesting stable protein-ligand binding. Ganoderic acid A exhibited sustained minor fluctuations, whereas the RMSD values of other small molecules remained relatively constant after some initial variation. Each sample group showed relative stability throughout the simulation, with minimal changes in RMSD, maintaining fluctuations generally within a range of 0.2 nm. RMSF is the average of atomic position changes over time, which can characterize the flexibility and motion intensity of protein amino acids during the whole simulation process [46]. The RMSF of a protein is thought to determine the deviation of each residue from the reference position. This parameter determines the suitability of the ligand-protein interaction in the simulation time. Amino acids located far from the active site exhibit higher RMSF values. At the same time, RMSF is also directly related to protein flexibility, i.e., the more flexible the region, the larger the RMSF value. RMSF between proteins and ligands were calculated and mapped (as detailed in Supporting Data 1 Figure S1a-7a). The results show that the RMSF of the protein is smaller in the bound part but larger in the unbound part, indicating that the binding of ligands has some influence on the stability of the protein. As shown in Table 4, the total free energy of each ligand-protein complex was determined through calculations of protein-ligand interactions, revealing that all complexes could bind stably. Hydrogen bonding, self-van der Waals force, and electrostatic interaction can enhance the stability of ligand-protein binding. Binding of the ligands leads to a more compact protein structure, reduced surface area, and more hydrogen bonds with ligands, indicating successful ligand-protein interaction (as detailed in Supporting Data 1 Figure S1b-7b). MDS was used to characterize the dynamic changes of XOD before and after binding with inhibitors, which provided a theoretical basis for further elucidating the molecular mechanism of anti-gout active ingredients in G. leucocontextum inhibiting XOD.
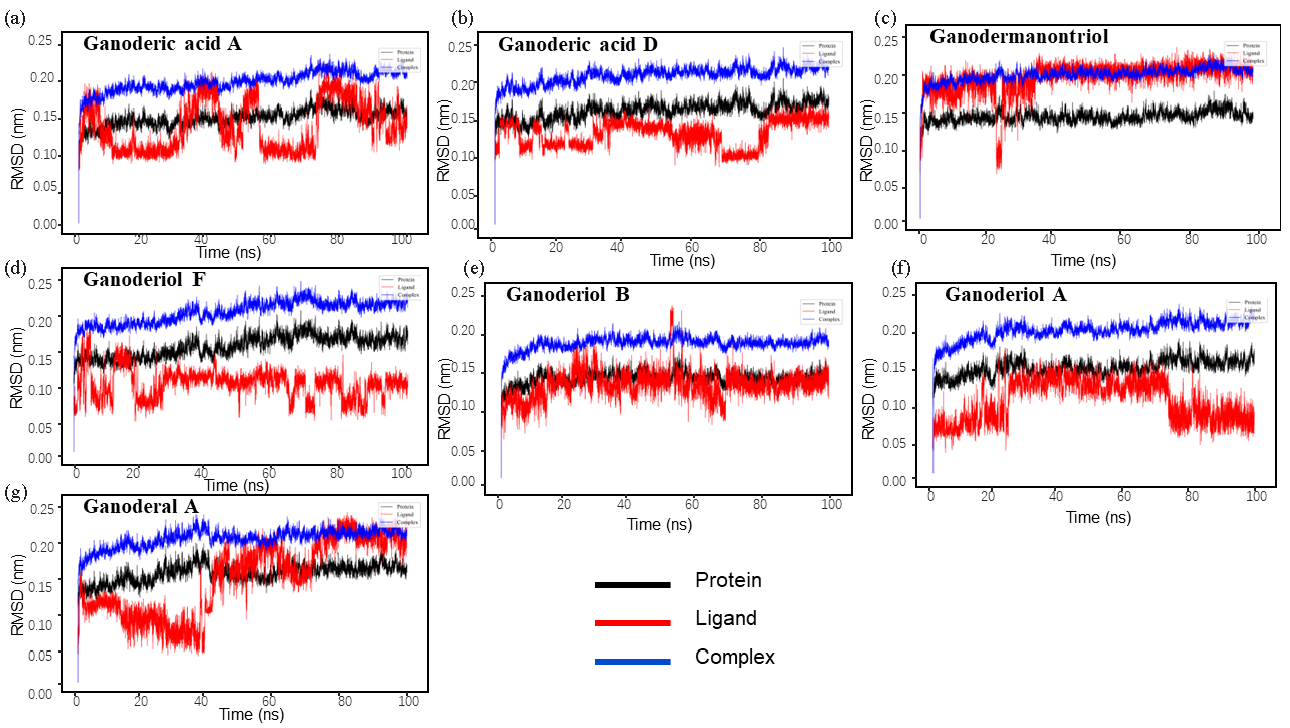
- RMSD diagrams for different systems: (a) Ganoderic acid A-XOD, (b) Ganoderic acid D-XOD, (c) Ganodermanontriol-XOD, (d) Ganoderiol F-XOD, (e) Ganoderiol B-XOD, (f) Ganoderiol A-XOD, (g) Ganoderal A-XOD. RMSD: Root mean square deviation.
| NO. | Ligand name | Binding free energy (kJ/mol) |
|---|---|---|
| 1 | Ganoderic acid A | -24.36 |
| 2 | Ganoderic acid D | -42.68 |
| 3 | Ganodermanontriol | -32.29 |
| 4 | Ganoderiol F | -40.76 |
| 5 | Ganoderiol B | -46.74 |
| 6 | Ganoderiol B | -43.69 |
| 7 | Ganoderal A | -41.87 |
3.3. Extraction and optimization of triterpenoids from G. leucocontextum
3.3.1. Box-Behnken design and statistical analysis
A Box-Behnken experiment was conducted using four factors at three levels, with the response variable being the extraction rate of total triterpenes from G. leucocontextum. The results have been displayed in Figure 4. Consequently, the extraction conditions were optimized. After analyzing and processing the data with software, a regression equation for the total triterpene extraction rate of G. leucocontextum was derived: Y = 0.86 − 0.010A + 0.011B − 0.027C − 0.026D − 0.044AB − 0.035AC − 0.019AD − 9.250E − 003BC − 3.250E − 003BD + 0.046CD − 0.030A2 − 0.10B2 − 0.10C2 − 0.083D2.
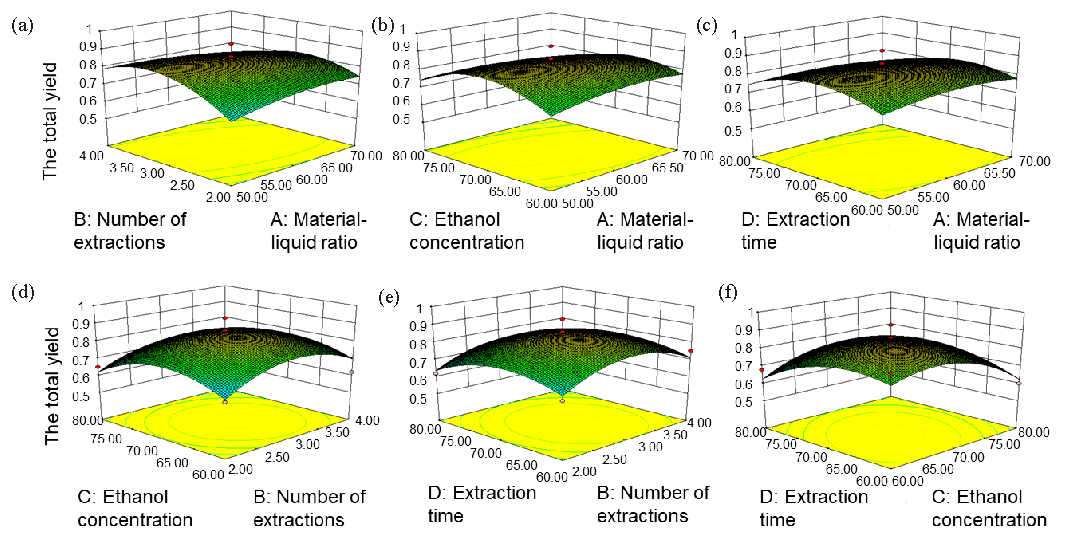
- Box-Behnken experiment total triterpenoid ultrasound extraction of G. leucocontextum. (a) The effects of number of extractions and material-liquid ratio on the total triterpenoid yield of G. leucocontextum, (b) ethanol concentration and material-liquid ratio on the total triterpenoid yield of G. leucocontextum, (c) extraction time and material-liquid ratio on the total triterpenoid yield of G. leucocontextum, (d) ethanol concentration and number of extractions on the total triterpenoid yield of G. leucocontextum, (e) extraction time and number of extractions on the total triterpenoid yield of G. leucocontextum, (f) extraction time and ethanol concentration on the total triterpenoid yield of G. leucocontextum.
The absolute values and signs of the coefficients for each primary term in the equation indicate the magnitude and direction of the influence each factor exerts on the response variable. The factors are ranked in order of influence as follows: C > D > B > A. Ethanol concentration has the most significant impact on the total triterpene yield, while the liquid-solid ratio exerts the least influence on the number of states. The negative coefficient of the first term in this equation suggests that the 3D surface plot generated from the Box-Behnken experiment equation displays extreme points both inside and outside the opening.
The significance test for the model yielded a p-value < 0.05, indicating statistical significance. The experimental results revealed that the quadratic terms of the independent variables AB, A2, B2, C2, and D2 were significant (p < 0.05). The lack of fit measures the degree to which the model corresponds to the experimental data, reflecting the extent of any discrepancies. The p-value obtained in this study was not significant, which supports the validity of the model, indicating no missing fitting factors, thus allowing for the substitution of this regression equation. The analysis of the experimental results confirmed that the model exhibited good goodness of fit, making it suitable for analyzing and predicting the extraction process of triterpenes from G. leucocontextum prepared by the ultrasonic-assisted method (Table 5).
| Source sum | Of squares | df | Mean _ F square | Value | p-value | p-value |
|---|---|---|---|---|---|---|
| Model | 0.20 | 14 | 0.015 | 5.38 | 0.0017 | Significant |
| A-material-liquid ratio | 2.700E-003 | 1 | 2.700E-003 | 1.00 | 0.3338 | |
| B-number of extractions | 1.564E-003 | 1 | 1.564E-003 | 0.58 | 0.4588 | |
| C-alcohol concentration | 8.856E-003 | 1 | 8.856E-003 | 3.29 | 0.0914 | |
| D-extraction time | 8.164E-003 | 1 | 8.164E-003 | 3.03 | 0.1037 | |
| AB | 0.017 | 1 | 0.017 | 6.42 | 0.0239 | |
| AC | 0.011 | 1 | 0.011 | 4.09 | 0.0626 | |
| AD | 3.192E-003 | 1 | 3.192E-003 | 1.18 | 0.2948 | |
| BC | 3.423E-004 | 1 | 3.423E-004 | 0.13 | 0.7269 | |
| BD | 4.225E-005 | 1 | 4.225E-005 | 0.016 | 0.9021 | |
| CD | 8.556E-003 | 8.556E-003 | 3.17 | 0.0965 | ||
| AA2 | 0.031 | 1 | 0.031 | 11.32 | 0.0046 | |
| BA2 | 0.070 | 1 | 0.070 | 26.14 | 0.0002 | |
| CA2 | 0.070 | 1 | 0.070 | 25.95 | 0.0002 | |
| DA2 | 0.045 | 1 | 0.045 | 16.77 | 0.0011 | |
| Residual | 0.038 | 14 | 2.695E-003 | |||
| Lack of fit | 0.030 | 10 | 3.013E-003 | 1.59 | 0.3481 | Not significant |
| Pure error | 7.599E-003 | 4 | 1.900E-003 | |||
| Cor total | 0.24 | 28 |
As illustrated by the curved surfaces in Figure 4, each plot from the Box-Behnken experiment displayed downward-opening curves. The center of the minimum ellipse in the contour plot fell within the experimental factor range, indicating that the extraction rate of total triterpenes from G. leucocontextum reached its maximum value within the limits established by the various factors. The contour lines labeled (A), (B), (C), (D), (E), and (F) appeared oval, suggesting significant interactions among the number of extractions and material-liquid ratio, ethanol concentration and material-liquid ratio, material-liquid ratio and extraction time, as well as extraction time and ethanol concentration. Furthermore, in Figure 4(a-f), the steeper effect surface curve at lower values of each factor signified that the four factors had a more pronounced impact on the yield (Y) of G. leucocontextum triterpenes.
The Box-Behnken experimental design was employed to identify four factors that significantly influenced the extraction rate of triterpenes from G. leucocontextum. Utilizing the principles of central composite design according to Box-Behnken, the factors tested included material-liquid ratio (A), number of extractions (B), ethanol concentration (C), and extraction time (D). The analysis involved four factors at three levels each. The optimal process parameters were determined as follows: material-liquid ratio of 59.36 g/mL, number of extractions of 3.08, ethanol concentration of 68.32%, and extraction time of 68.03 mins. Under these conditions, the yield of triterpene compounds reached 0.8642%.
3.3.2. PSO-BP model test results
According to the BP neural network regression algorithm, the maximum number of festival points of the hidden layer was 7, the mean square error of the training set was 0.012, and the goodness of fit R2 was 0.973. It can be seen from Figure 5(a) that the predicted value of the neural network is consistent with the actual value, and the R2 in the training set was 0.994. It can be seen from Figure 5(b) that there was little difference between the predicted value and the actual value of the test set. The prediction performance of the BP neural network constructed in this experiment was good and could be used as a reliable basis for optimizing the extraction parameters of total triterpenoids from G. leucocontextum.
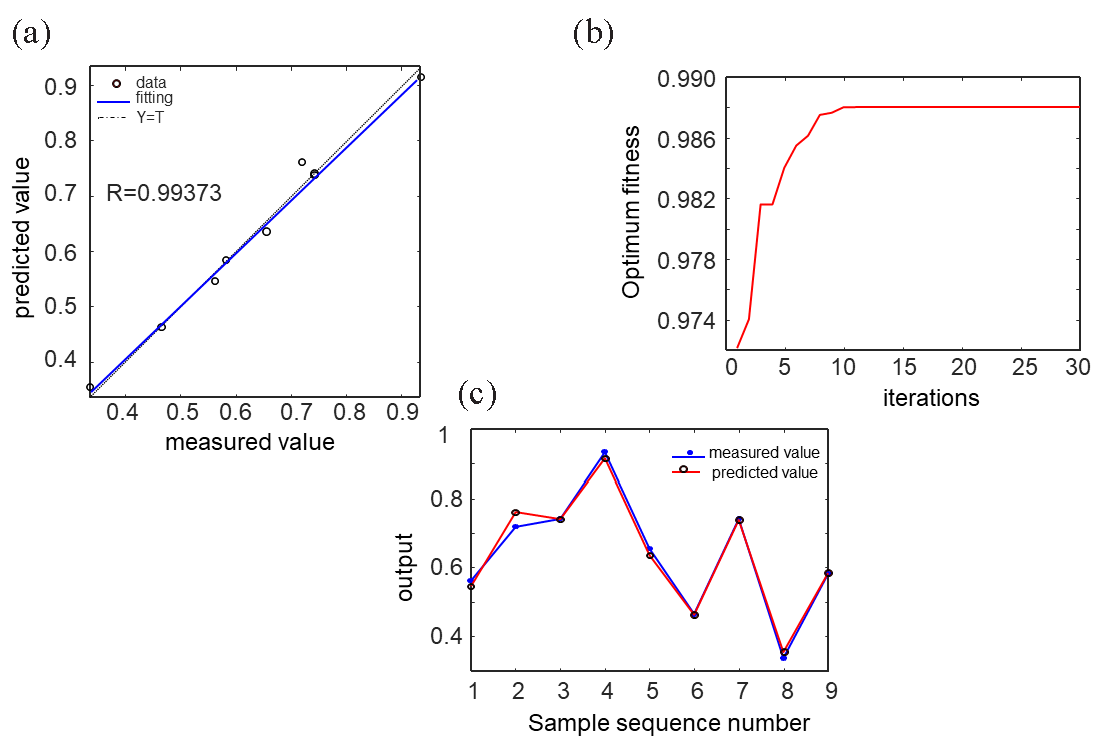
- PSO-BP neural network optimization process: (a) Comparison of true value and predicted value of total triterpenes extraction, (b) the predicted and actual values of the neural network test set are compared in the image, (c) optimization process of particle swarm algorithm.
Based on the BP neural network regression algorithm, the maximum number of hidden layer nodes was set to 7, resulting in a mean square error of 0.012 for the training set and a goodness of fit R2 of 0.973. As illustrated in Figure 5(a), the predicted values generated by the neural network closely aligned with the actual values, with an R2 of 0.994 for the training set. Additionally, Figure 5(b) demonstrates minimal differences between the predicted and actual values in the test set. These results indicate that the BP neural network developed in this study exhibited strong prediction performance, providing a reliable basis for optimizing the extraction parameters of total triterpenoids from G. leucocontextum.
With 29 groups of data in the Box-Behnken experiment as the original data, BP neural network as the fitness function, G. leucocontextum total triterpene extraction rate as the output value of the algorithm, PSO-BP was used to globally optimize the extraction process parameters and find the optimal conditions. As can be seen from Figure 5(c), the maximum extraction value began to stabilize after the number of iterations reached 10. The optimal extraction conditions obtained by PSO were as follows: the expected extraction amount of G. leucocontextum triterpenes was 0.989%, the material-liquid ratio was 1:65.99 g/mL, the number of extractions 3.26 times, the ethanol concentration was 80.120%, Extraction time 68.41 min. To facilitate the actual operation process, the best extraction process was selected as Material-liquid ratio 1:66 g/mL, Number of extractions: 3 times, Ethanol concentration: 80%, Extraction time: 68 mins. Under the optimal extraction conditions, the experiment was repeated 3 times, and the average extraction rate was 1.034 ± 0.247%. The difference between the predicted value and the actual value was 0.045%, which was 0.170% higher than that of the Box-Behnken experiment method.
3.4. Separation of XOD inhibitors by activity-oriented CCC method
3.4.1. Optimization results of activity-oriented CCC solvent
Based on the findings from molecular docking (MD), molecular dynamics simulations (MDS), and ultrafiltration experiments regarding XOD inhibition, seven compounds were identified as target compounds and subsequently separated using activity-oriented CCC. Solvent systems with K values ranging from 0.5-2.0 were determined to be optimal for this type of CCCC. As indicated in Table 6, most of the target compounds in solvent systems 4, 6, and 10 had K values in the range 0.5-2.0, making them suitable for the separation of triterpenoids in G. leucocontextum. However, the K value for target compound 2 in the solvent system comprising n-hexane/ ethyl acetate/ methanol/ water at a ratio of 4.0:8.0:5.0:3.0 (v/v/v/v) was too low, suggesting that the retention time of this compound in the stationary phase might be insufficient for effective separation from impurities. Furthermore, the retention rate of the stationary phase in solvent system 10 was below 40%, rendering it unsuitable for the separation and purification of target compounds. Consequently, we selected a solvent system composed of n-hexane/ ethyl acetate/ methanol/ water in a ratio of 4.0:8.0:5.3:3.0 (v/v/v/v) for isolating and purifying the XOD inhibitors in G. leucocontextum.
| No. | Solvent system | v/v/v/v | K1 | k 2 | K3 | k 4 | K5 | K6 | K7 |
|---|---|---|---|---|---|---|---|---|---|
| 1 | n-hexane/ethyl acetate/methyl alcohol/water | 1.0:5.0:5.0:1.0 | 0.015 | 0.061 | 0.327 | 0.225 | 0.599 | 0.470 | 0.622 |
| 2 | n-hexane/ethyl acetate/methyl alcohol/water | 2.0:5.0:5.0:3.0 | 0.176 | 0.056 | 0.636 | 0.368 | 1.257 | 0.973 | 1.369 |
| 3 | n-hexane/ethyl acetate/methyl alcohol/water | 4.5:8.0:5.3:3.0 | 0.253 | 0.125 | 0.821 | 0.631 | 2.239 | 1.505 | 2.027 |
| 4 | n-hexane/ethyl acetate/methyl alcohol/water | 4.0:8.0:5.3:3.0 | 0.508 | 0.543 | 0.797 | 0.575 | 1.979 | 1.333 | 1.906 |
| 5 | n-hexane/ethyl acetate/methyl alcohol/water | 4.0:8.3:5.3:3.0 | 0.467 | 0.389 | 1.019 | 6.359 | 2.886 | 1.813 | 2.699 |
| 6 | n-hcxanc/cthyl acetate/methyl alcohol/water | 4.0:8.0:5.0:3.0 | 0.454 | 0.110 | 0.989 | 0.672 | 2.007 | 1.427 | 1.958 |
| 7 | n-hexane/ethyl acetate/methyl alcohol/water | 4.0:8.0:6.0:3.0 | 0.064 | 0.058 | 0.369 | 0.319 | 0.929 | 0.767 | 1.067 |
| 8 | n-hexane/ethyl acetate/methyl alcohol/water | 4.0:8.0:4.5:3.0 | 0.16 | 0.06 | 0.90 | 0.18 | 0.47 | 0.94 | 0.62 |
| 9 | n-hexane/ethyl acetate/methyl alcohol/water | 4.0:8.0:4.0:3.0 | 0.16 | 0.06 | 0.90 | 0.18 | 0.47 | 0.94 | 0.62 |
| 10 | n-hexanc/ethyl acetate/acetonitrile | 3.0:1.0:4.0 | 0.133 | 0.845 | 0.910 | 0.244 | 0.756 | 0.892 | 0.908 |
| 11 | n-hexane/ethyl acetate/acetonitrile r | 5.0:2.0:5.0 | 0.236 | 0.153 | 0.182 | 0.237 | 0.901 | 0.411 | 0.682 |
| 12 | petroleum ether/ethyl acetate/methanol/water | 1.0:2.0:1.0:3.0 | 0.20 | 0.15 | 0.18 | 0.40 | 0.88 | 0.78 | 0.65 |
| 13 | petroleum ether/ethyl acetate/methanol/water | 1.0:2.0:1.0:2.0 | 0.02 | 0.12 | 0.06 | 0.56 | 0.76 | 0.61 | 0.89 |
| 14 | ethyl acetate/acetonitrile/water | 4.0:2.0:5.0 | 0.361 | 0.206 | 0.813 | 0.270 | 0.755 | 0.837 | 0.772 |
During the subsequent separation process, it became evident that the purity of the target compound was inadequate. We hypothesized that the high level of impurities in the ethanolic extract of G. leucocontextum necessitated purification prior to separation. The ethanol extract was dissolved in water and subsequently subjected to sequential extraction with petroleum ether, ethyl acetate, and n-butanol. The resulting solution was dried and re-dissolved in chromatography-grade methanol, followed by component detection via HPLC. The results indicated that the target compound predominantly resided in the ethyl acetate extract. The ethyl acetate layer was concentrated in significant quantities and then separated using activity-oriented CCC with solvent system 4 after drying, yielding satisfactory results.
The retention rate of the stationary phase and the resolution of the chromatographic peak are affected by the flow rate of the mobile phase and the speed of the centrifugal pump [47]. Therefore, we investigated the effects of constant column speed at 851 rpm and sample volume speed at 450 mg. When the flow rate was 1.5 mL/min, the retention rate of the stationary phase was 74.20% and the separation time was 450 min. When the flow rate was increased to 3 mL/min, the fixed phase retention rate and separation time decreased to 62.00% and 225 min, respectively. Many experiments show that the separation time and fixed phase retention decrease significantly with the increase of flow velocity. Due to the good retention rate of the stationary phase (72.73%), 2.5 mL/min is the optimal flow rate for the separation of monomer compounds. In addition, the detection wavelength is 254 nm, and at this flow rate, the XOD inhibitor can be effectively separated from other components.
3.4.2. Comparison of UNIFAC Model and Traditional Method for Solvent System Configuration
By employing traditional methods (1) and the UNIFAC model (2) to formulate the solvent system, seven XOD inhibitors were effectively isolated from G. leucocontextum using activity-oriented CCC (Figure 6(a) and 6(b), respectively. The separation efficiency of the two methods for the target compounds is like that of the stationary phase retention. The XOD inhibitor was successfully separated for 320 min at a rate of 2.5 mL/min, utilizing a solvent composition of n-hexane/ ethyl acetate/ methanol/ water in a ratio of 4.0: 8.0: 5.3: 3.0 (v/v/v/v). When the separation operation is performed with method 1, 90 mL of mobile phase is required to balance the two phases, for a total of 800 mL of mobile phase and 330 mL of stationary phase in a single operation, which corresponds to the capacity of the activity-oriented CCC column. Thus, a minimum of 1525 mL of solution (600 mL of stationary phase and 925 mL of mobile phase) was necessary for each CCCC separation to ensure the complete isolation of all target compounds while maintaining an adequate volume of mobile phase. Consequently, this resulted in a wastage of at least 270 mL of stationary phase for each activity-oriented CCC separation experiment, leading to significant organic solvent waste in successive separations. To mitigate this issue, the UNIFAC model (method 2) was implemented, Using the molar fraction and mass density obtained by UNIFAC model, formulas (1) and (2) were used to calculate the ratio of n-hexane/ ethyl acetate/ methanol/ water in the upper and lower phases as 27.3: 28.4: 4.2: 1.0 (v/v/v/v) and 4.7: 32.3: 35.3: 20.8 (v/v/v/v).
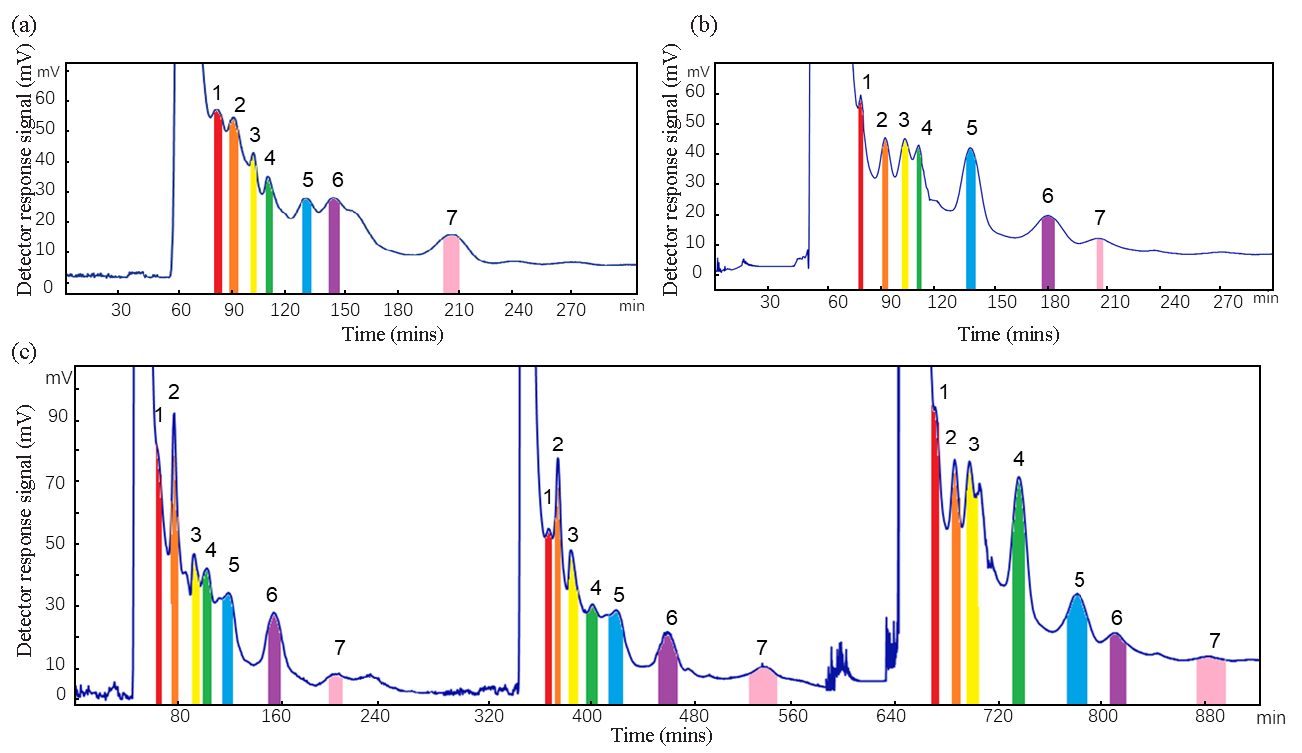
- Activity-oriented CCC separation of G. leucocontextum extract. Solvent system: n-hexane: ethyl acetate: methanol: water (4.0: 8.0: 5.3: 3.0, v/v/v/v), flow rate: 2.5 mL/min, detection wavelength: 254 nm, rotational speed: 851 rpm, sample size: 450 mg. Activity-oriented CCC separation using methods (a) 1 and (b) 2 for solvent system preparation. (c) Consecutive activity-oriented CCC separation using method 2. CCC: Consecutive-countercurrent chromatography.
In three consecutive countercurrent chromatography separation operations by method B, save 1456.4 mL of organic solvent (577.4 mL n-hexane, 696.8 mL ethyl acetate, and 182.2 mL methanol). Therefore, method 2 is more suitable for activity-oriented CCC separation. Compared with method 1, method 2 avoids the waste of a lot of organic reagents, is more environmentally friendly, and conforms to the concept of “green chemistry”.
3.4.3. Separation Results and Fraction Analysis
To enhance the efficiency of chemical reagent usage and facilitate the rapid preparation of multiple required samples, the UNIFAC model was utilized to design the stationary and mobile phases of the solvent system for continuous sampling. The findings are depicted in Figure 6(c). Seven fractions of G. leucocontextum isolated via complex chromatography were subsequently analyzed by HPLC. The HPLC chromatograms for both the extract and the activity-oriented CCC fractions are shown in Figure 7. All seven phytochemicals exhibited purities exceeding 85%, with the purities of fractions 1-7 from the activity-oriented CCC measured at 88.33%, 85.12%, 86.42%, 93.75%, 95.63%, 91.23%, and 85.18%, respectively.
- HPLC diagram of crude extract and isolated product of G. leucocontextum. HPLC: High-performance liquid chromatography.
The identification of activity-oriented CCC fractions was based on HPLC retention time and MS/MS data (Supporting data 2). After the MS/MS spectral data was obtained, it was compared with previously reported data and verified with a standard to identify the seven compounds. The experimentally obtained [M-H]- (m/z) values for compounds 1-7 were 515.3021, 513.2847, 472.6997, 454.3491, 470.3415, 374.3779, 436.6690 respectively. By comparing the MS data and the LC retention times, the target compounds, Ganoderic acid A, Ganoderic acid D, Ganodermanontriol, Ganoderiol F, Ganoderiol B, Ganoderiol A, and Ganoderal A [48-54].
3.5. Experimental results of enzymatic reaction
3.5.1. Evaluation of XOD inhibiting activity of active components in G. leucocontextum
This study systematically analyzed the interaction data between natural triterpenoid compounds at different concentrations and XOD. Based on Eqs. (3) and (4), the inhibition rates of Ganoderic acid A, Ganoderic acid D, Ganodermanontriol, Ganoderiol F, Ganoderiol B, Ganoderiol A, and Ganoderal A on XOD were calculated. Concentration-inhibition rate curves for each compound were constructed using GraphPad Prism software, and the half-maximal inhibitory concentration (IC50) was determined through a nonlinear regression model. As shown in Figure 8. Within the optimal concentration range, an increase in sample concentration corresponded to a rising inhibition rate for the seven monomeric components against XOD. The inhibition rate curves for Ganoderic acid A, Ganodermanontriol, and Ganoderal A exhibited a gradual flattening, suggesting that XOD was not completely inactivated. Allopurinol was used as a positive control to investigate the inhibitory activity of seven monomer compounds with different concentrations on XOD. The results indicated that the IC50 values for Ganoderic acid A, Ganoderic acid D, Ganodermanontriol, Ganoderiol F, Ganoderiol B, Ganoderiol A, and Ganoderal A against XOD were 21.50, 24.76, 11.72, 46.26, 97.23, 150.0, and 25.94 μg/mL, respectively, while Allopurinol had an IC50 of 31.88 μg/mL. These findings showed that seven active compounds in G. leucocontextum showed inhibitory activity against XOD at different concentrations, and the IC50 of Ganoderic acid A, Ganoderic acid Dc, and Ganodermanontriol were lower than that of allopurinol. It showed that the drug effect was higher than allopurinol.
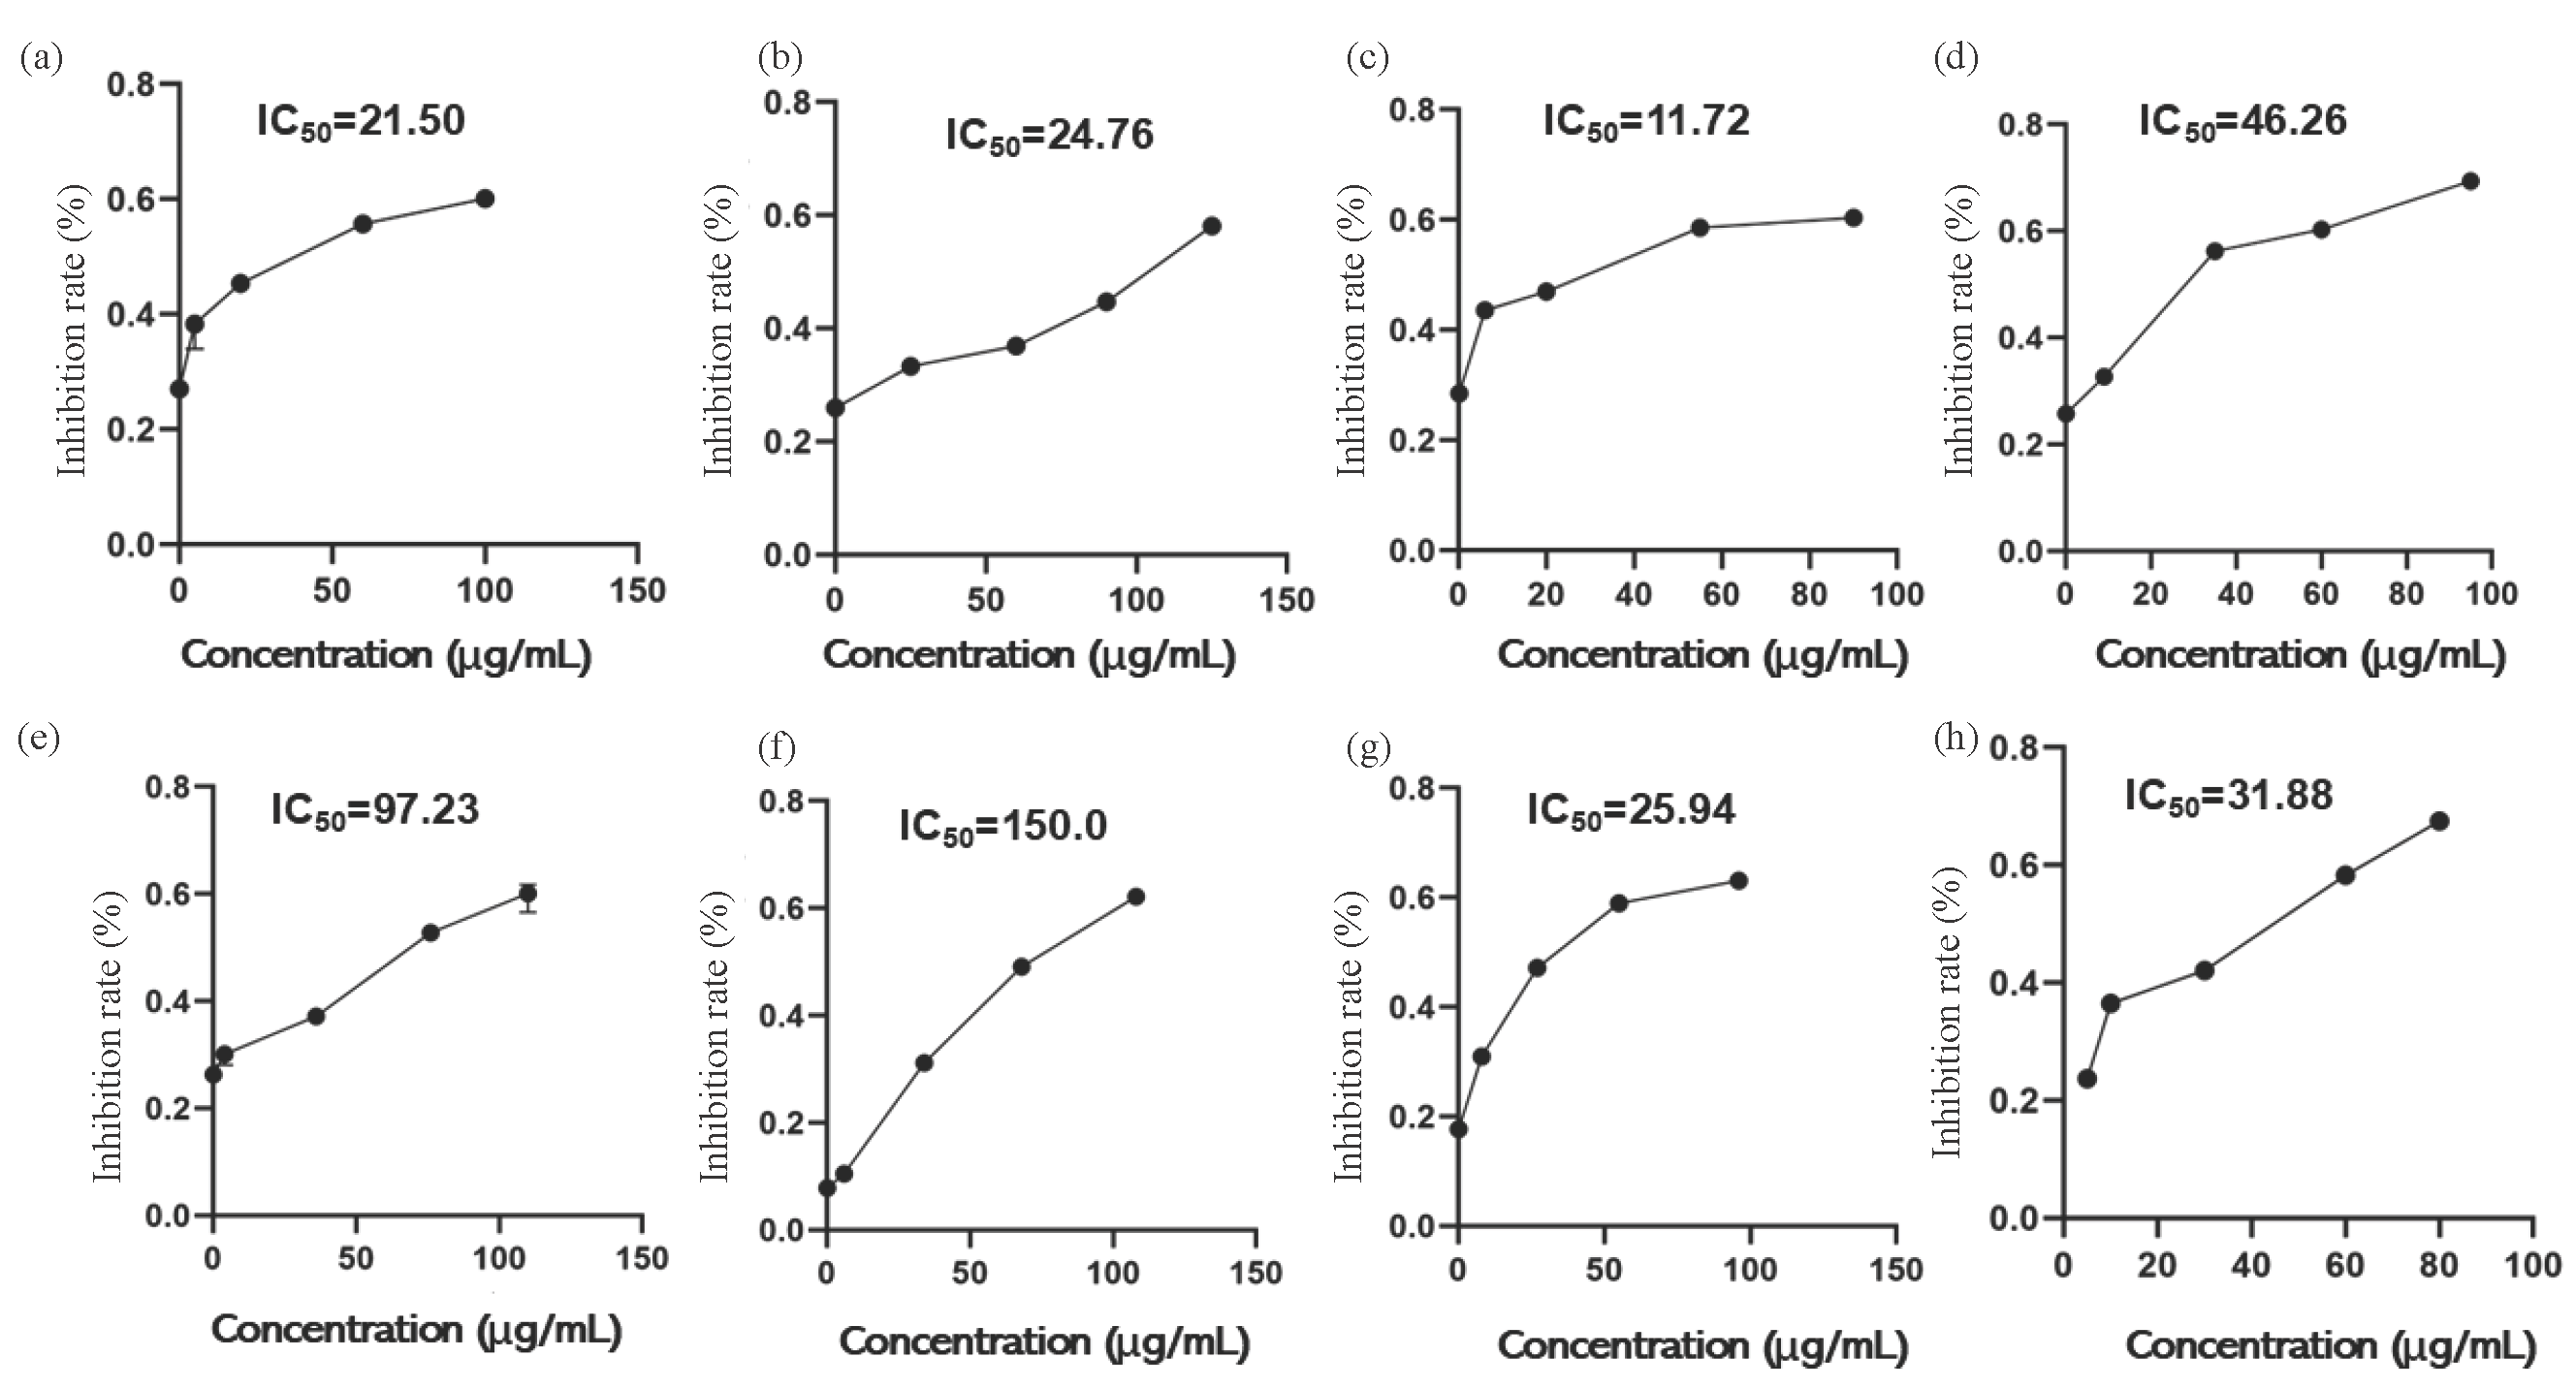
- Curve of inhibition rate change with substrate concentrate. (a) Ganoderic acid A, (b) Ganoderic acid D, (c) Ganodermanontriol, (d) Ganoderiol F, (e) Ganoderiol B, (f) Ganoderiol A, (g) Ganoderal A, (h) Allopurinol.
3.5.2. Evaluation method of enzyme inhibition type of monomer compound
The type of inhibition of XOD by an inhibitor (reversible or irreversible) was determined by V∼[E] mapping. According to the relationship between inhibitor, substrate concentration and enzyme concentration, whether it is reversible inhibition is determined. As shown in Figure 9, when the substrate concentration was unchanged, in the reaction system of monomer compounds with different concentrations and different enzyme concentrations, all spectral lines pass through the origin, and the slope of spectral lines decreased with the increase of monomer compound concentration. The type of inhibition of XOD by monomer compounds was reversible inhibition.
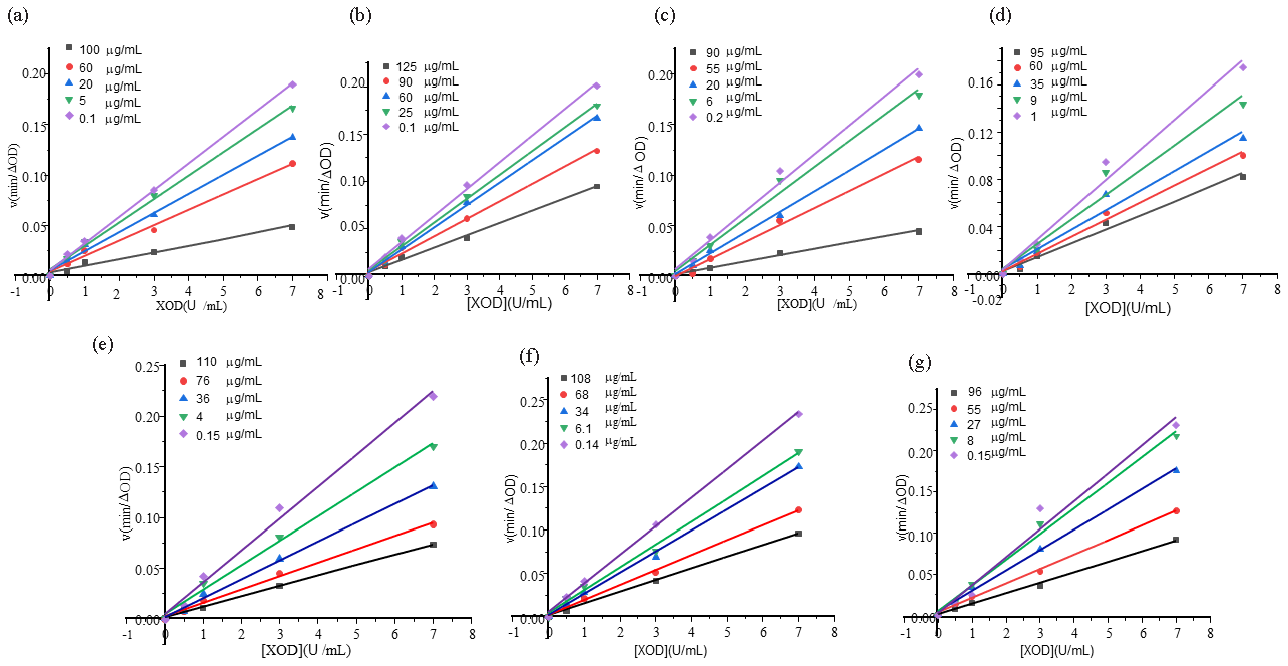
- Inhibition types of XOD with different monomer concentration. (a) Ganoderic acid A, (b) Ganoderic acid D, (c) Ganodermanontriol, (d) Ganoderiol F, (e) Ganoderiol B, (f) Ganoderiol A, (g) Ganoderal A. XOD: Xanthine oxidase.
3.5.3. Determination of enzyme inhibition constants by different monomer inhibitors and study of inhibition mechanism
From the perspective of enzyme reaction kinetics, enzyme inhibition can be mainly divided into four types: competitive inhibition (C.), non-competitive inhibition (NC.), uncompetitive inhibition (UC.) and mixed inhibition (MT.). The type of inhibition can be determined through Eqs. (5-8) [43]:
The value of Ki can be calculated using Eqs. (9)-(11):
Where V, Vmax, Ki, Km and Kis are the reaction rate, maximum reaction rate, free enzyme inhibition constant, binding constant and binding enzyme inhibition constant, respectively. [S] is the concentration of xanthine (substrate), and [I] represents the concentration of inhibitor.
The inhibition types of 7 XOD inhibitors in G. leucocontextum were determined by kinetic analysis. The concentration of XOD was maintained at 3.0 U/mL while varying the substrate concentration, with reaction rates for the monomer compounds measured at substrate concentrations of 75, 100, 125, 150, and 175 mg/L. The Lineweaver-Burk double reciprocal mapping method was used to draw a linear fitting graph with 1/[S] as the horizontal coordinate and 1/V as the vertical coordinate under the conditions of different concentrations of inhibitors. As shown in Figure 10(a), the enzyme kinetic fitting line of Ganoderic acid A intersects with the negative half-axis of the X-axis. Combined with the data in Table 7, it can be observed that the Km values remain essentially stable under the effect of this compound, while Vm exhibits a concentration-dependent decreasing trend. This phenomenon aligns with the characteristic features of non-competitive inhibition (NC.). The kinetic equation shown in Eq. (6) indicates that such inhibitors bind to active sites on enzyme molecules independent of substrate-binding sites, inducing conformational changes that reduce catalytic activity. In contrast, the kinetic fitting lines of the compounds in Figure 10(b-g) all intersect with the Y-axis. As demonstrated by the kinetic parameters in Table 7, these compounds exhibit a pattern where Km values increase with concentration while Vm remains relatively constant, fully consistent with the kinetic characteristics of competitive inhibition (C.) (Eq. 5). This mechanism suggests that such monomeric compounds compete with the substrate for binding to the same active center of XOD, creating steric hindrance effects that ultimately impede the formation of enzyme-substrate complexes and reduce catalytic efficiency. The inhibition constant (Ki) of the inhibitor under different concentration conditions was determined using Eq. (9) and (10), and the results obtained were 53.83, 33.69, 50.05, 141.4, 72.45, and 109.6 μg/mL for the respective monomer compounds (Table 7). Additionally, during the experiments, it was noted that increasing inhibitor concentrations and changes in pH influenced the stability and inhibitory efficacy of XOD. It was inferred that the inhibitory effect of XOD inhibitors is contingent not only upon their structural characteristics but also on concentration and environmental factors. Consequently, the influence of the drug environment should be considered in practical application.
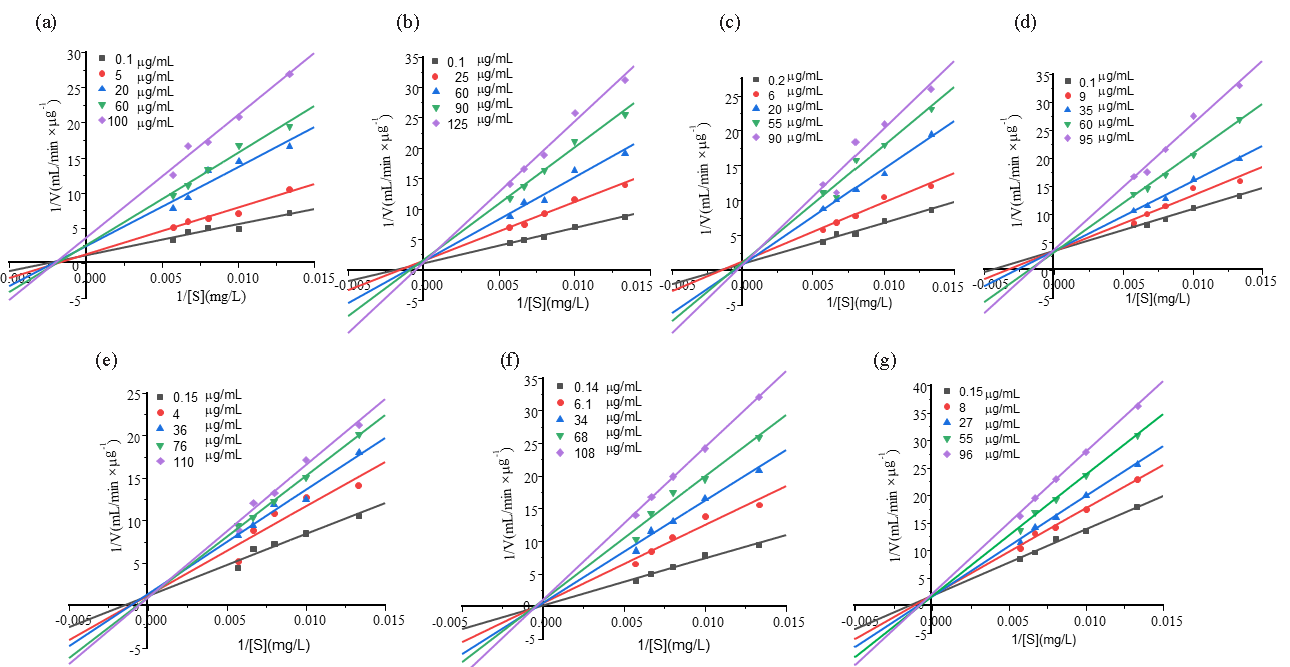
- Lineweaver–Burk curves of XOD with different monomer concentrations. (a) Ganoderic acid A, (b) Ganoderic acid D, (c) Ganodermanontriol, (d) Ganoderiol F, (e) Ganoderiol B, (f) Ganoderiol A, (g) Ganoderal A.
| Sample concentration (μg/mL) | Michaelis-menten equation | R2 | Km/Kapp m | Vm/Vapp m | Ki | |
|---|---|---|---|---|---|---|
| 0.1 | 1/V=444.02/[S]+1.10 | 0.8930 | 403.66 | 0.914 | ||
| Ganoderic acid A | 5 | 1/V=670.64/[S]+1.18 | 0.9429 | 568.34 | 0.853 | |
| 20 | 1/V=1129.73/[S]+2.43 | 0.8863 | 464.91 | 0.411 | 53.83 | |
| 60 | l/V=1321.52/[S]+2.54 | 0.9714 | 520.28 | 0.394 | ||
| 100 | 1/V= 1759.45/[S]+3.53 | 0.9721 | 498.42 | 0.282 | ||
| 0.1 | 1/V=579.58/[S]+1.06 | 0.9924 | 546.77 | 0.941 | ||
| Ganoderic acid D | 25 | 1/V=964.01/[S]+1.43 | 0.9856 | 674.13 | 0.700 | |
| 60 | 1/V=1369.74/[S]+1.41 | 0.9567 | 971.45 | 0.710 | 33.69 | |
| 90 | 1/V=1850.67/[S]+1.55 | 0.9856 | 1193.98 | 0.650 | ||
| 125 | 1/V=2308.68/[S]+1.17 | 0.9809 | 1973.23 | 0.860 | ||
| 0.2 | 1/V=589.51/[S]+0.94 | 0.9667 | 6627.14 | 1.064 | ||
| Ganoderma nontriol |
6 20 |
1/V=847.96/[S]+1,25 1/V= 1373.86/[S]+0.79 |
0.9632 0.9899 |
678.37 1739.06 |
0.800 1.266 |
50.05 |
| 55 | 1/V=1672.01/[S]+1.13 | 0.9516 | 1479.65 | 0.885 | ||
| 90 | 1/V=1951.17/[S]+0.75 | 0.9187 | 2601.56 | 1.330 | ||
| 0.1 | 1/V=743.45/[S]+3,3 8 | 0.9805 | 219.96 | 0.296 | ||
| Ganoderiol F | 9 | 1/V=996.60l/[S]+3.36 | 0.9337 | 296.61 | 0.298 | |
| 35 | 1/V=1249.44/[S]+3.27 | 0.9910 | 382.09 | 0.306 | 141.4 | |
| 60 | 1/V=1772.03/[S]+3.04 | 0.9964 | 582.91 | 0.329 | ||
| 95 | 1/V=2250.53/[S]+3.57 | 0.9810 | 630.40 | 0.280 | ||
| 0.15 | 1/V=727.40/[S]+1.12 | 0.9309 | 649.23 | 0.893 | ||
| Ganoderiol B | 4 | 1/V=1050.80/[S]+1.15 | 0.8331 | 914.85 | 0.871 | |
| 36 | 1/V=1227.31/[S]+1.30 | 0.9640 | 941.61 | 0.767 | 72.45 | |
| 76 | 1/V=1432.74/[S]+0.93 | 0.9975 | 1547.86 | 1.080 | ||
| 110 | 1/V=1558.22/[S]+0.91 | 0.9783 | 1712.68 | 1.099 | ||
| 0.14 | 1/V=719.43/[S]+0.15 | 0.9732 | 4930.98 | 6.854 | ||
| Ganoderiol A | 6.1 | 1/V=1195.3 l/[S]+0.54 | 0.9355 | 2202.91 | 1.843 | |
| 34 | 1/V=1559.82/[S]+0.50 | 0.9810 | 33109.65 | 1.994 | 109.6 | |
| 68 | l/V=1895.60/[S]+0.96 | 0.9660 | 1984.30 | 1.047 | ||
| 108 | 1/V=2335.01/[S]+1.02 | 0.9989 | 2297.32 | 0.984 | ||
| 0.15 | 1/V=l 208.43/[S]+1.72 | 0.9891 | 700.93 | 0.580 | ||
| Ganoderal A | 8 | 1/V=1577.02/[S]+1.80 | 0.9902 | 874.17 | 0.550 | |
| 27 | 1/V=1825.34/[S]+1.52 | 0.9950 | 1199.28 | 0.657 | 109.6 | |
| 55 | 1/V=2204.13/[S]+1.61 | 0.9960 | 1365.61 | 0.620 | ||
| 96 | 1/V=2518.02/[S]+2.04 | 0.9973 | 1236.13 | 0.491 |
4. Conclusions
The results confirmed that G. leucocontextum has a significant anti-gout ability. Through receptor-ligand affinity ultrafiltration mass spectrometry, molecular docking and molecular dynamics simulation experiments, the three screening methods mutually verified and identified seven compounds that have an affinity inhibitory effect on XOD. The results of molecular dynamics simulation showed that these active components not only spontaneously attach to XOD but also form a complex system with good stability, indicating their strong inhibitory ability.
Statistical analysis showed that there was a significant difference between variable factors A (material-liquid ratio) and B (number of extractions) (p < 0.05), while the quadratic terms of each factor all reach an extremely significant level (p < 0.01). Additionally, the predicted values of the BP neural network are basically consistent with the actual values, which also provides a basis for optimizing the extraction process.
By using UNIFAC mathematical simulation, it is possible to separately prepare the two-phase solvent system, which solves the problem of excessive waste of organic reagents when separating many natural products. Moreover, high-purity target compounds such as Ganoderic acid A, Ganoderic acid D, Ganodermanontriol, Ganoderiol F, Ganoderiol B, Ganoderiol A, and Ganoderal A have been efficiently obtained. Enzyme catalytic reaction kinetics studies showed that the inhibitory effect of these compounds on XOD was reversible inhibition. Compared with the positive control allopurinol, these compounds at medium and low doses showed lower activity, thus warranting further research and development.
In addition, the discovery of G. leucocontextum may provide new opportunities for the development of the medicinal fungi industry and show significant utilization and development potential. Systematic research not only improves the utilization rate of G. leucocontextum resources but also lays a solid foundation for in-depth exploration of its pharmacological effects, and at the same time provides important theoretical support for the development of G. leucocontextum-related health products.
Acknowledgment
The study was funded by Natural Science Foundation of Jilin Province (NO.20240602028RC).
CRediT authorship contribution statement
Yuyu Nong: Conceptualization, Data curation, Formal analysis, Writing – original draft. Qiang Liu: Software. Sainan Li: Funding acquisition, Project administration, Supervision, Writing-review & editing. Jiaqi Liang: Methodology, Software. Yuton Zhang: Methodology, Software. Yuchi Zhang: Supervision, Writing-review & editing. Wanchao Hou: Methodology, Software, Supervision.
Declaration of competing interest
The authors declare that they have no known competing financial interests or personal relationships that could have appeared to influence the work reported in this paper.
Declaration of Generative AI and AI-assisted technologies in the writing process
The authors confirm that there was no use of artificial intelligence (AI)-assisted technology for assisting in the writing or editing of the manuscript and no images were manipulated using AI.
Supplementary data
Supplementary material to this article can be found online at https://dx.doi.org/10.25259/AJC_13_2024.
References
- Differences in soil microbiota of continuous cultivation of ganoderma leucocontextum. Agronomy. 2023;13:888. https://doi.org/10.3390/agronomy13030888
- [CrossRef] [Google Scholar]
- Ganoderma leucocontextum, a new record from Pakistan. Mycotaxon. 2021;136:529-539. https://doi.org/10.5248/136.529
- [Google Scholar]
- Ganoderma leucocontextum, a new addition to indian mycoflora from kashmir himalaya. Biology Bulletin. 2024;51:540-5. https://doi.org/10.1134/s1062359023605980
- [CrossRef] [Google Scholar]
- Immunoregulatory activity of a low-molecular-weight heteropolysaccharide from ganoderma leucocontextum fruiting bodies in vitro and in vivo. Food Chemistry: X. 2022;14:100321. https://doi.org/10.1016/j.fochx.2022.100321
- [CrossRef] [PubMed] [PubMed Central] [Google Scholar]
- Ganoderiol F purified from ganoderma leucocontextum retards cell cycle progression by inhibiting CDK4/CDK6. Cell Cycle (Georgetown, Tex.). 2019;18:3030-3043. https://doi.org/10.1080/15384101.2019.1667705
- [CrossRef] [PubMed] [PubMed Central] [Google Scholar]
- Long-term exposure to ambient air pollution and incident gout: A prospective cohort study in the UK biobank. Environmental Pollution (Barking, Essex: 1987). 2024;345:123540. https://doi.org/10.1016/j.envpol.2024.123540
- [CrossRef] [PubMed] [Google Scholar]
- Risk of cardiovascular comorbidities before and after the onset of rheumatic diseases. Seminars in Arthritis and Rheumatism. 2024;65:152382. https://doi.org/10.1016/j.semarthrit.2024.152382
- [CrossRef] [PubMed] [Google Scholar]
- Data mining-guided alleviation of hyperuricemia by paeonia veitchii lynch through inhibition of xanthine oxidase and regulation of renal urate transporters. Phytomedicine: International Journal of Phytotherapy and Phytopharmacology. 2024;124:155305. https://doi.org/10.1016/j.phymed.2023.155305
- [CrossRef] [PubMed] [Google Scholar]
- Effect of the xanthine oxidase inhibitor, febuxostat, on WBC count in asymptomatic hyperuricemia: Subanalysis of the randomized PRIZE study. Journal of Atherosclerosis and Thrombosis. 2024;31:864-875. https://doi.org/10.5551/jat.64574
- [CrossRef] [PubMed] [PubMed Central] [Google Scholar]
- Comparison of the therapeutic effects of febuxostat combined with a low-purine diet and allopurinol combined with a low-purine diet on the improvement of gout patients. International Journal of Rheumatic Diseases. 2024;27:e15165. https://doi.org/10.1111/1756-185X.15165
- [CrossRef] [PubMed] [Google Scholar]
- Exploring asphodelus microcarpus as a source of xanthine oxidase inhibitors: Insights from in silico and in vitro studies. Chemico-biological Interactions. 2024;397:111087. https://doi.org/10.1016/j.cbi.2024.111087
- [CrossRef] [PubMed] [Google Scholar]
- Discovery of cyclooxygenase-2 inhibitors from kadsura coccinea by affinity ultrafiltration mass spectrometry and the anti-inflammatory activity. Fitoterapia. 2021;151:104872. https://doi.org/10.1016/j.fitote.2021.104872
- [CrossRef] [PubMed] [Google Scholar]
- Current advances in screening for bioactive components from medicinal plants by affinity ultrafiltration mass spectrometry. Phytochemical Analysis: PCA. 2018;29:375-386. https://doi.org/10.1002/pca.2769
- [CrossRef] [PubMed] [Google Scholar]
- Pharmaceutical applications of affinity-ultrafiltration mass spectrometry: Recent advances and future prospects. Journal of Pharmaceutical and Biomedical Analysis. 2016;131:444-453. https://doi.org/10.1016/j.jpba.2016.09.021
- [CrossRef] [PubMed] [Google Scholar]
- Rapid screening of the novel bioactive peptides with notable α-glucosidase inhibitory activity by UF-LC-MS/MS combined with three-AI-tool from black beans. International Journal of Biological Macromolecules. 2024;266:130982. https://doi.org/10.1016/j.ijbiomac.2024.130982
- [CrossRef] [PubMed] [Google Scholar]
- Potential antioxidative and anti-hyperuricemic components in rodgersia podophylla A Gray revealed by bio-affinity ultrafiltration with SOD and XOD. Frontiers in Pharmacology. 2023;14:1298049. https://doi.org/10.3389/fphar.2023.1298049
- [CrossRef] [PubMed] [PubMed Central] [Google Scholar]
- Sulfamide-substituted-BODIPY based fluorescence drugs: Synthesis, spectral characteristics, molecular docking, and bioactivity. Arabian Journal of Chemistry. 2021;14:103395. https://doi.org/10.1016/j.arabjc.2021.103395
- [CrossRef] [Google Scholar]
- Mechanism of cnidii fructus in the treatment of infertility based on network pharmacology and molecular docking analysis technology. Biochemical Genetics 2024 2024 May 28. https://doi.org/10.1007/s10528-024-10827-0
- [CrossRef] [Google Scholar]
- Evaluation of antihypertensive activity and molecular docking analysis of padina boergesenii extract. Bioorganic Chemistry. 2024;143:107099. https://doi.org/10.1016/j.bioorg.2024.107099
- [CrossRef] [PubMed] [Google Scholar]
- Phenolic compounds of Phlomis tuberosa by LC–MS/MS‐Determination of antioxidant activity, molecular docking, and enzyme inhibition profiles. Chemistry Select. 2023;8 https://doi.org/10.1002/slct.202303101
- [Google Scholar]
- Revealing anti-fungal potential of plant-derived bioactive therapeutics in targeting secreted aspartyl proteinase (SAP) of Candida albicans: A molecular dynamics approach. Journal of Biomolecular Structure and Dynamics. 2024;42:710-724. https://doi.org/10.1080/07391102.2023.2196703
- [CrossRef] [PubMed] [Google Scholar]
- Evaluation of binding and antagonism/downregulation of brilanestrant molecule in estrogen receptor-α via quantum mechanics/molecular mechanics, molecular dynamics and binding free energy calculations. Journal of Biomolecular Structure & Dynamics. 2020;38:219-235. https://doi.org/10.1080/07391102.2019.1574605
- [PubMed] [Google Scholar]
- Molecular description of pyrimidine-based inhibitors with activity against FAK combining 3D-QSAR analysis, molecular docking and molecular dynamics. Arabian Journal of Chemistry. 2021;14:103144. https://doi.org/10.1016/j.arabjc.2021.103144
- [CrossRef] [Google Scholar]
- Identifying 124 new anti-HIV drug candidates in a 37 billion-compound database: An integrated approach of machine learning (QSAR), molecular docking, and molecular dynamics simulation. Chemometrics and Intelligent Laboratory Systems. 2024;250:105145. https://doi.org/10.1016/j.chemolab.2024.105145
- [Google Scholar]
- An in silico approach to identify novel and potential Akt1 (protein kinase b-alpha) inhibitors as anticancer drugs. Molecular Diversity 2024 2024 May 26. https://doi.org/10.1007/s11030-024-10887-9
- [Google Scholar]
- Response surface methodology and artificial neural network modelling for optimization of solid-liquid extraction and rapid HPTLC analysis of glycyrrhizin in glycyrrhiza glabra root. South African Journal of Botany. 2022;148:11-20. https://doi.org/10.1016/j.sajb.2022.03.045
- [CrossRef] [Google Scholar]
- Comparison of response surface methodology (RSM) and artificial neural network (ANN) modelling for supercritical fluid extraction of phytochemicals from terminalia chebula pulp and optimization using RSM coupled with desirability function (DF) and genetic algorithm (GA) and ANN with GA. Industrial Crops and Products. 2021;170:113769. https://doi.org/10.1016/j.indcrop.2021.113769
- [CrossRef] [Google Scholar]
- Material procedure quality forecast based on genetic BP neural network. Modern Physics Letters B. 2017;31:1740080. https://doi.org/10.1142/s0217984917400802
- [CrossRef] [Google Scholar]
- Solving engineering optimization problems based on multi-strategy particle swarm optimization hybrid dandelion optimization algorithm. Biomimetics (Basel, Switzerland). 2024;9:298. https://doi.org/10.3390/biomimetics9050298
- [CrossRef] [PubMed] [PubMed Central] [Google Scholar]
- Isolation of two new phenolic glycosides from castanopsis chinensis hance by combined multistep CC and HSCCC separation and evaluation of their antioxidant activity. Molecules (Basel, Switzerland). 2023;28:3331. https://doi.org/10.3390/molecules28083331
- [CrossRef] [PubMed] [PubMed Central] [Google Scholar]
- Rapid separation of asiatic acid, quercetin, and kaempferol from traditional chinese medicine centella asiatica (L.) urban using HSCCC-semi-prep-HPLC and the assessment of their potential as fatty acid synthase inhibitors. International Journal of Analytical Chemistry. 2023;2023:7769368. https://doi.org/10.1155/2023/7769368
- [CrossRef] [PubMed] [PubMed Central] [Google Scholar]
- An efficient two-step approach for the preparative separation and purification of eight polyphenols from hibiscus manihot l. flower with high-speed countercurrent chromatography. Arabian Journal of Chemistry. 2023;16:104791. https://doi.org/10.1016/j.arabjc.2023.104791
- [CrossRef] [Google Scholar]
- Molecular design of solvents for extractive distillation. Advanced Materials Research. 2011;233-5:2938-2944. https://doi.org/10.4028/www.scientific.net/amr.233-235.2938
- [CrossRef] [Google Scholar]
- Solubility prediction of active pharmaceutical compounds with the UNIFAC model. International Journal of Thermophysics. 2016;37 https://doi.org/10.1007/s10765-015-2033-x
- [CrossRef] [Google Scholar]
- UNIFAC model for ionic liquids. Industrial & Engineering Chemistry Research. 2009;48:2697-2704. https://doi.org/10.1021/ie801496e
- [CrossRef] [PubMed] [Google Scholar]
- Comparison of excess molar enthalpies predicted by UNIFAC model and COSMO-SAC theory with experimental data for some binary mixtures. Journal of Molecular Structure. 2023;1289:135821. https://doi.org/10.1016/j.molstruc.2023.135821
- [CrossRef] [Google Scholar]
- Solvent screening and liquid-liquid measurement for extraction of phenols from aromatic hydrocarbon mixtures. The Journal of Chemical Thermodynamics. 2019;129:12-21. https://doi.org/10.1016/j.jct.2018.09.006
- [CrossRef] [Google Scholar]
- Experimental data of fluid phase equilibria- correlation and prediction models: A review. Processes. 2019;7:277. https://doi.org/10.3390/pr7050277
- [Google Scholar]
- Solvent screening for separation of lignin-derived molecules using the NIST-UNIFAC model. ACS Sustainable Chemistry & Engineering. 2023;11:7863-7873. https://doi.org/10.1021/acssuschemeng.3c00906
- [CrossRef] [PubMed] [Google Scholar]
- Plumbagin can potently enhance the activity of xanthine oxidase: In vitro, in vivo and in silico studies. BMC Pharmacology & Toxicology. 2021;22:45. https://doi.org/10.1186/s40360-021-00511-z
- [CrossRef] [PubMed] [Google Scholar]
- Inhibition mechanism of berberine on α‐Amylase and α‐Glucosidase in vitro. Starch - Stärke. 2022;74 https://doi.org/10.1002/star.202100231
- [PubMed] [Google Scholar]
- Inversion of 2D magnetotelluric (MT) data with axial anisotropy using adaptive particle swarm optimization (PSO) Journal of Applied Geophysics. 2024;226:105401. https://doi.org/10.1016/j.jappgeo.2024.105401
- [CrossRef] [Google Scholar]
- In-depth analysis of the acetylcholinesterase inhibitors of ganoderma amboinense based receptor-ligand affinity coupled with complex chromatography. Journal of Food Composition and Analysis. 2024;125:105776. https://doi.org/10.1016/j.jfca.2023.105776
- [CrossRef] [Google Scholar]
- Impact of thermosonication treatment on parsley juice: Particle swarm algorithm (PSO), multiple linear regression (MLR), and response surface methodology (RSM) ACS Omega. 2024;9:29585-29597. https://doi.org/10.1021/acsomega.4c02749
- [CrossRef] [PubMed] [PubMed Central] [Google Scholar]
- Virtual screening and molecular dynamics simulations of phytochemicals targeting cofactor-independent phosphoglycerate mutase in antimicrobial-resistant mycoplasma genitalium. 3 Biotech. 2024;14:231. https://doi.org/10.1007/s13205-024-04082-8
- [CrossRef] [PubMed] [PubMed Central] [Google Scholar]
- Comprehensive structural and functional analysis of patuletin as a potent inhibitor of SARS-coV-2 targeting the RNA-dependent RNA polymerases. Journal of Molecular Structure. 2024;1311:138424. https://doi.org/10.1016/j.molstruc.2024.138424
- [CrossRef] [Google Scholar]
- Continuous-flow separation and preconcentration of microplastics from natural waters using countercurrent chromatography. Talanta. 2024;278:126504. https://doi.org/10.1016/j.talanta.2024.126504
- [CrossRef] [PubMed] [Google Scholar]
- Ganoderiol A and b, new triterpenoids from the fungus ganoderma lucidum (Reishi). Agricultural and Biological Chemistry. 1986;50:2887-2890. https://doi.org/10.1271/bbb1961.50.2887
- [CrossRef] [Google Scholar]
- Ganoderiol a-enriched extract suppresses migration and adhesion of MDA-MB-231 cells by inhibiting FAK-SRC-paxillin cascade pathway. PloS One. 2013;8:e76620. https://doi.org/10.1371/journal.pone.0076620
- [CrossRef] [PubMed] [PubMed Central] [Google Scholar]
- Screening and analysis of the marker components in ganoderma lucidum by HPLC and HPLC-MSn with the aid of chemometrics. Molecules (Basel, Switzerland). 2017;22:584. https://doi.org/10.3390/molecules22040584
- [CrossRef] [PubMed] [PubMed Central] [Google Scholar]
- Identification and quantification of triterpenoids in lingzhi or reishi medicinal mushroom, ganoderma lucidum (Agaricomycetes), with HPLC-MS/MS methods. International Journal of Medicinal Mushrooms. 2018;20:919-934. https://doi.org/10.1615/IntJMedMushrooms.2018027398
- [CrossRef] [PubMed] [Google Scholar]
- Quality evaluation of ganoderma through simultaneous determination of nine triterpenes and sterols using pressurized liquid extraction and high performance liquid chromatography. Journal of Separation Science. 2006;29:2609-2615. https://doi.org/10.1002/jssc.200600178
- [CrossRef] [PubMed] [Google Scholar]
- Effect of 26-oxygenosterols from ganoderma lucidum and their activity as cholesterol synthesis inhibitors. Applied and Environmental Microbiology. 2005;71:3653-8. https://doi.org/10.1128/AEM.71.7.3653-3658.2005
- [CrossRef] [PubMed] [Google Scholar]
- Preparative isolation of ganoderic acid s, ganoderic acid T and ganoderol B from ganoderma lucidum mycelia by high-speed counter-current chromatography. Biomedical Chromatography: BMC. 2018;32:e4283. https://doi.org/10.1002/bmc.4283
- [CrossRef] [PubMed] [Google Scholar]


