Translate this page into:
Construction of macromolecular model and analysis of oxygen absorption characteristics of Hongyang No. 2 coal mine
⁎Correspondence author at: Address: College of Safety Science & Engineering, Liaoning Technical University, Fuxin, Liaoning 123000, China. Dingdc123@163.com (Cong Ding)
-
Received: ,
Accepted: ,
This article was originally published by Elsevier and was migrated to Scientific Scholar after the change of Publisher.
Peer review under responsibility of King Saud University.
Abstract
Understanding the molecular structure characteristics of coal from the molecular level is of great significance for realizing rational utilization and efficient transformation of coal. The molecular structure of coal samples from 1304 working face in No.13 coal seam of Hongyang No.2 Mine (HY) was studied by industrial analysis, elemental analysis, Nuclear magnetic resonance carbon spectroscopy (13C NMR) and Fourier transform infrared spectroscopy (FTIR). The results show that the aromatic compounds in coal samples of HY are mainly naphthalene ring structures. The aliphatic structure mainly consists of methyl, ethyl side chains and cycloalkanes. The ratio of aromatic bridge carbon to weekly carbon in molecular structure is 0.17. Oxygen atoms exist in the form of carbonyl, hydroxyl, and ether bonds, nitrogen atoms exist in the form of pyridine and pyrrole respectively, and sulfur atoms exist in the form of thiophene. Based on this, the planar structure model of coal macromolecule in HY is constructed, and its molecular formula is C129H88O29N2S, and its molecular weight is 2160. The structure optimization and annealing kinetics simulation of a single macromolecule model were carried out, and a stable three-dimensional coal model of HY was obtained. In addition, the oxygen absorption characteristics of coal samples in HY were studied by molecular dynamics and quantum chemistry. The results show that the adsorption capacity of the Wiser model is less than that of HY coal model. This is because, compared with the Wiser model, the content of oxygenated aliphatic hydrocarbons in the molecular structure of HY coal is higher, and the condensation degree of polycyclic aromatic hydrocarbons is lower. Due to the stronger physical adsorption capacity of hydroxyl, ether bond, and carbonyl on O2, HY Mine has stronger physical adsorption capacity on O2.
Keywords
Oxygen absorption characteristics
Molecular structure model
13C NMR
FTIR
Molecular dynamics
1 Introduction
The pollution problem caused by spontaneous combustion of coal is becoming more and more serious, and how to use coal resources cleanly and efficiently has become a widespread concern of scholars (Xu, 2012; Qiao et al., 2022; Zhang and Zhang, 2014). It is of great significance to correctly understand the molecular structure characteristics of coal for realizing rational utilization and efficient conversion of coal (Jiang et al., 2019; Bhoi et al., 2014; Zeng et al., 2018).
In recent years, scholars have studied the molecular structure of coal by using chemical experiments and modern testing techniques and proposed more than 130 macromolecular structure models of coal (Mathews et al., 2011), such as the famous Wiser model (Wiser, 1984), Given model (Given, 1959), Shinn model (Shinn, 1996) and so on. He et al. (He et al., 2021) explored the distribution characteristics of oxygen-containing functional groups in macerals of low-rank coal; Hong et al. (Hong et al., 2021) constructed the coal char model, and simulated the combustion and gasification characteristics of coal char by reactive molecular dynamics method; Zhang et al. (Zhang et al., 2017) constructed Xishan bituminous coal macromolecular model to simulate coal molecular structure density, and its density value fitted well with the experimental data, which confirmed the rationality of the model. Meng et al. (Meng et al., 2018) constructed the structure model of Zhaozhuang coal by elemental analysis, X-ray photoelectron spectroscopy, and 13C NMR, and simulated the adsorption of methane gas molecules by single molecular structure by Giant Canonical Monte Carlo (GCMC) method, providing theoretical basis for the utilization of Zhaozhuang coal resources.
At present, many scholars have used molecular simulation method to study the oxygen absorption characteristics by coal. Wu (Wu et al., 2019) used the GCMC method to analyze the ability and competitive difference of coal to adsorb CO2, O2, and N2 gases according to the actual situation of fire prevention and storage of the power plant flue gas injected into goaf. Lou et al. (Lou and Jia, 2020) established a macromolecule-scale model to simulate the surface adsorption of different gases, including O2, CO2, and N2 by the coal surface. Then the effect of the gas competition difference of mixed gas molecules on the surface adsorption was analyzed. Cheng et al. (Cheng et al., 2021) used density functional theory (DFT) and GCMC simulation methods to study the adsorption characteristics of CO2, N2, O2, and H2O molecules with lignite. There are few dedicated studies on the adsorption mechanism of O2 on coal and the adsorption affinity of each functional group to O2 molecules.
To deeply understand the molecular structure and reactivity of coal in HY Mine, the molecular structure of coal samples in No. 13 coal seam of HY Mine was studied by means of industrial analysis, elemental analysis, 13C NMR and FTIR, and the molecular planar structure model was constructed. Materials studio (MS) was used to optimize the structure and annealing kinetics of the optimized model was simulated. Oxygen absorption characteristics of coal samples in HY Mine were studied by molecular dynamics and quantum chemistry. This research will provide some theoretical guidance for the anti-spontaneous combustion technology of HY Mine at the molecular level.
2 Sample preparation and experimental methods
2.1 Preparation and treatment of coal samples
The test coal was taken from 1304 working face of No.13 coal seam in the West No.3 lower mining area of Hongyang No.2 Mine of Shenyang Coking Coal Co., ltd. The coal type is lean coal. After coal samples were collected from the site, they were sealed and stored with plastic wrap immediately, and sent to the laboratory for testing and research in time.
2.2 Industrial and elemental analysis
The collected raw coal was crushed and screened to make coal samples with a particle size of 200 mesh. According to the national standard (GB/T212-2008) for industrial analysis of coal samples, according to the national standard (GB/T476-2008) for elemental analysis of coal samples, the results of industrial analysis and elemental analysis of coal samples are shown in Table 1. The calculated atomic ratios are shown in Table 2.
Industrial analysis
Element analysis
Mad/%
Vdaf/%
Ad/%
FCad/%
Cdaf/%
Hdaf/%
Odaf/%
Ndaf/%
Sdaf/%
2.46
14.91
13.43
69.20
72.19
3.68
21.12
1.20
1.81
Coal sample
H/C
O/C
N/C
S/C
HY
0.6117
0.2194
0.0141
0.0094
2.3 FTIR test
FTIR was tested by TENSOR27 FTIR spectrometer produced by Brooke Company of Germany (see Fig. 1) to study the occurrence and change of functional groups in coal samples. The resolution of FTIR spectrometer was 0.5–1 cm−1, the scanning wave number ranges from 4000 to 400 cm-1, and the scanning times were 32 times. KBr laminating was used, and coal and KBr were mixed at 1:200 and then fully ground.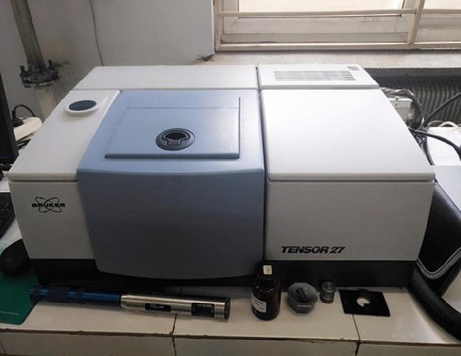
FTIR Spectrometer TENSOR27.
2.4 13C NMR test
13C NMR was measured by Swiss Bruker 400 MHz nuclear magnetic resonance spectrometer (see Fig. 2) according to SY/T 5777–1995. Experimental conditions: high resolution 4.0 mm, double resonance MAS probe, rotor speed 10 kHz, pulse width 4 μs, pulse delay time 1 s, contact time 2 ms, 10,000 scans, in order to obtain the information of carbon atoms in coal samples.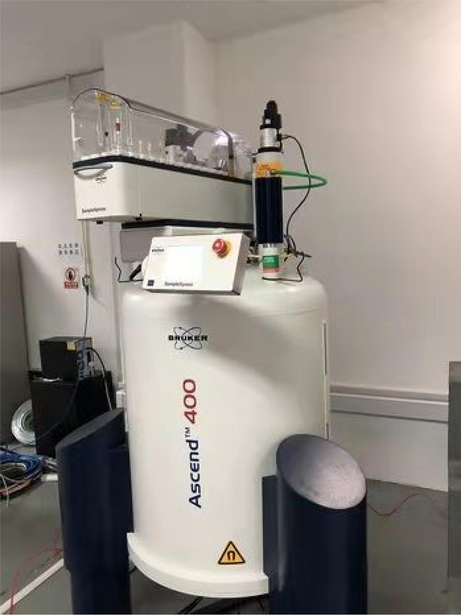
Brooke 400 M solid-state nuclear magnetic resonance instrument.
2.5 Data processing methods
According to the experimental data of industrial analysis, elemental analysis, FTIR and 13C NMR, Peakfit, Origin, and other tools were used to fit the spectra, and ChemDraw was used to build and modify the coal molecular model. Based on the molecular dynamics (MD) calculation method, geometric optimization and annealing kinetics simulation were carried out. Then the lowest energy optimization model of molecular structure of coal samples in HY was obtained.
2.6 Molecular model simulation calculation
Based on the experimental data, the structural parameters of coal samples were calculated, and the coal molecular structure model of HY was constructed. The geometrical optimization and annealing dynamics of the model were simulated by MS software: the maximum iteration steps of geometrical optimization were 50000, and the energy convergence was 0.001 kcal/mol; The annealing kinetics simulation initial temperature was 300 K, the cycle steps were 10000, and five cycles were carried out. The nose temperature control method was selected to obtain the lowest energy optimization model of coal molecular structure in HY (Wu et al., 2019; Lou and Jia, 2020; Cheng et al., 2021).
3 Results and discussion
3.1 FTIR analysis
The infrared spectrum of HY coal sample is shown in Fig. 3. The absorption peaks in the infrared spectrum of coal are mainly divided into four types (Xia et al., 2019; Jiang et al., 2006; Zhang et al., 2021): The first absorption peak is located between 3600 and 3000 cm−1, which is the hydroxyl absorption peak. The second is the absorption peak of fat structure between 3000 and 2800 cm−1. The third absorption peak is between 1800 and 1000 cm−1, which is the absorption peak of oxygen-containing functional groups. The fourth absorption peak is located between 900 and 700 cm−1, which is the absorption peak of aromatic structure.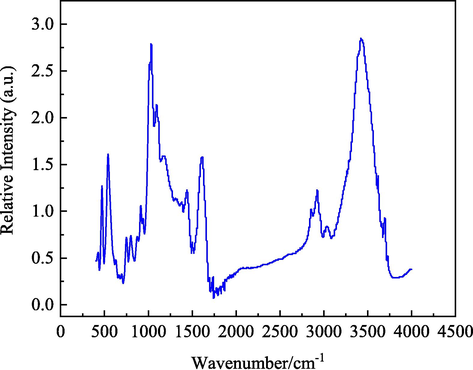
FTIR test results of HY coal sample.
In order to analyze the types of functional groups in coal in detail, the infrared spectra are fitted by peak splitting, and the peak splitting fitting is carried out by Peakfit software, and the fitting results are shown in Fig. 4. Combined with Table 3, the main substitution modes can be determined.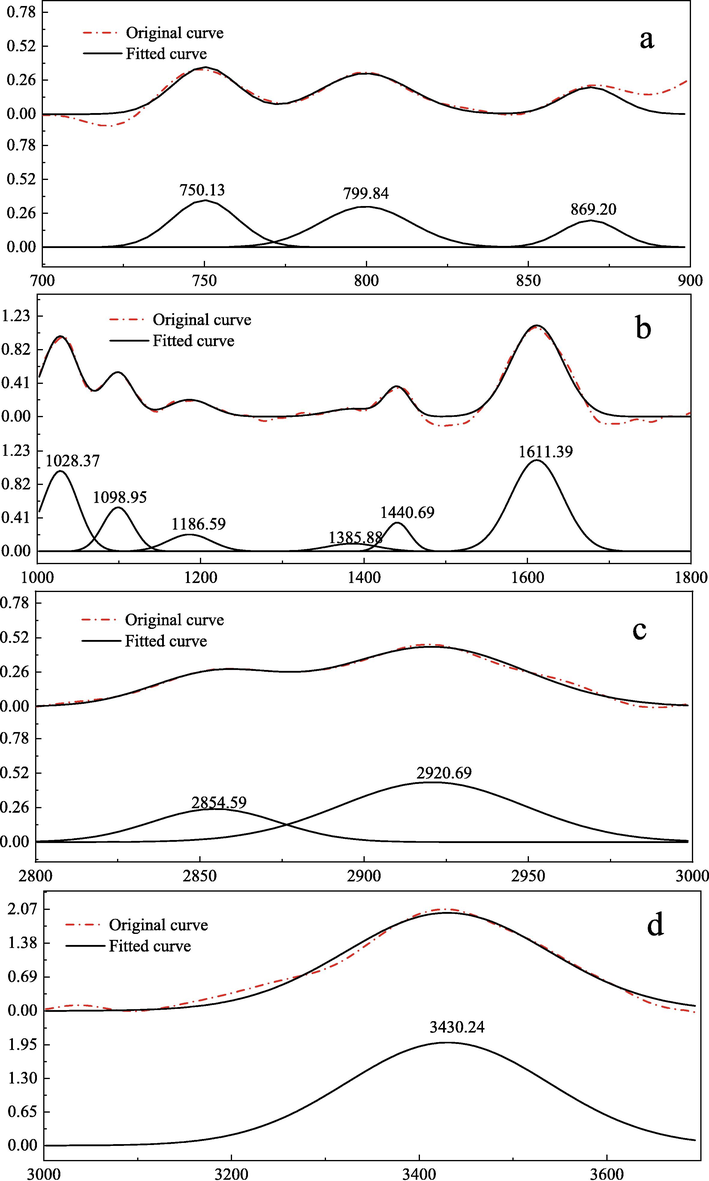
Infrared spectral peak fitting of HY coal sample.
Figure
Number
Peak position /cm−1
Peak width /cm−1
Peak type
Area
Relative area /%
Attribution
a
1
750.13
23.72
Gaussian
91.08
37.03
1, 2-substituted aromatic hydrocarbons
2
799.84
32.86
Gaussian
109.11
44.36
1, 2, 4-substituted aromatic hydrocarbon CH
3
869.20
20.84
Gaussian
45.78
18.61
1, 2, 4-substituted aromatic hydrocarbon CH
b
1
1028.37
51.16
Gaussian
537.41
26.48
Ash content
2
1098.95
43.36
Gaussian
249.31
12.28
C—O of phenols, alcohols, ethers and esters
3
1186.60
62.95
Gaussian
138.78
6.84
C—O of phenols, alcohols, ethers and esters
4
1385.88
72.47
Gaussian
73.52
3.62
–CH3 symmetric deformation vibration
5
1440.69
36.18
Gaussian
136.06
6.70
–CH2 and-CH3, inorganic carbonates
6
1611.39
75.16
Gaussian
894.46
44.07
Carbonyl; -O-substituted aromatic hydrocarbons C⚌C
c
1
2854.59
45.34
Gaussian
120.61
27.49
Cycloalkane or aliphatic hydrocarbon CH3
2
2920.69
66.19
Gaussian
318.16
72.51
Cycloalkane or aliphatic hydrocarbon CH3
d
1
3430.24
254.85
Gaussian
5414.69
100
Hydroxyl
By analyzing Fig. 4 and Table 3, we can know the chemical functional groups contained in coal samples and their substitution modes. After peak fitting, there are three obvious peaks at 700 ∼ 900 cm−1 in Fig. 4 (a), which are 1, 2 and 1, 2, 4 substituted aromatic hydrocarbons respectively. In Fig. 4 (b), six absorption peaks are obtained by fitting the 1000 ∼ 1800 cm-1 peaks, which indicate that coal contains ash, –CH2 and –CH3, hydrogen-bonded carbonyl groups; Aromatic hydrocarbons with -O- substitution C⚌C. In Fig. 4 (c), there are two obvious peaks after peak fitting treatment, which represent cycloalkane or aliphatic hydrocarbon CH3. In Fig. 4 (d), there is a strong absorption peak at about 3430.24 cm−1, which is mainly due to the chemical structure of coal containing –OH. To sum up, the infrared peak fitting effect of this coal sample is ideal, and the type of functional groups and the number of functional groups in its coal molecular structure can be basically determined.
By fitting the infrared spectrum of 1800 ∼ 1000 cm−1, it can be concluded that the main forms of oxygen in the molecular structure of raw coal of Hongyang No. 2 Mine are ether, phenol and carbonyl. By fitting the infrared spectrum of 3000–2800 cm−1, it can be concluded that the fatty chain in the molecular structure of the raw coal of Hongyang No. 2 Mine is mainly methylene and methylene.
3.2 13C NMR analysis
13C NMR spectra can be divided into four peaks according to the chemical functional groups of coal, and different chemical shift intervals correspond to different peaks, which are the first peak 0 ∼ 60 ppm and lipid carbon peak respectively; The second peak is 60 ∼ 90 ppm, and the ether oxygen peak; The third peak is 90 ∼ 165 ppm, aromatic carbon peak; The fourth peak is about 200 ppm, and the carbonyl peak (Ge et al., 2017; Fan et al., 2017).
Choose the appropriate peak points, and the 13C NMR spectra for peak fitting processing (using Peakfit software). According to chemical attribution, 12 structural parameters of coal samples are calculated, including (Castro-Marcano et al., 2012; Painter et al., 1987; Li et al., 2013):
- protonated aromatic carbon + bridged aromatic carbon + side-supported aromatic carbon + oxygen substituted aromatic carbon + carbonyl carbon;.
- all sp3 hybrid carbon;.
- carboxyl or carbonyl carbon, δ greater than 165;.
- aromatic carbon, δ is 100 ∼ 165;.
- protonated aromatic carbon, δ is 100 ∼ 129;.
– Aprotonated aromatic carbon, δ is 129 ∼ 165;.
- oxygen hydroxyl group or other oxygen substituted carbon to form aromatic ring, δ is 148 ∼ 165(150 ∼ 165);.
- side aromatic carbon, δ is 137 ∼ 148 or 135 ∼ 150;.
- bridged aromatic carbon, δ is 129 ∼ 137;.
- arylmethyl + aliphatic methyl;.
- methylene, methylene, quaternary carbon;.
- oxygen grafted carbon, δ为50 ∼ 90;.
Combined with formula (1), the average XBP of aromatic ring polycondensation degree is calculated.
The 13C NMR spectra of coal samples obtained from experiments and their peak fitting results are shown in Fig. 5. There are five obvious peaks in the 13C NMR spectra of coal samples, the first peak is about 20 ppm, the second peak is about 33 ppm, the third peak is between 60 ∼ 90 ppm, the fourth peak is between 160 ∼ 190 ppm, and the fifth peak is between 210 ∼ 220 ppm. Combined with Table 4, it can be seen from the analysis that the coal samples contain intracyclic oxygrease carbon, methylene, protonated aromatic carbon, carboxyl carbon and carbonyl carbon, etc. From the intensity of the peak, aromatic carbon is the main one, and the content of other types of carbon is relatively small.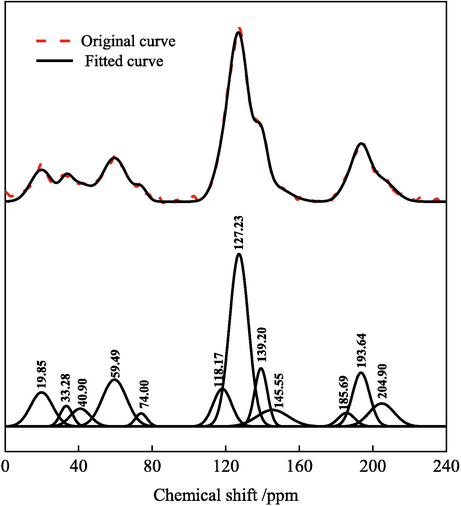
13C NMR of coal samples and peak fitting.
Number
Chemical shift /ppm
Peak type
Peak width
Area
Relative area /%
Attribution
1
19.85
Gaussian
14.05
9.514e + 08
7.81
Aromatic methyl
2
33.28
Gaussian
7.81
3.201e + 08
2.63
Methylene
3
40.90
Gaussian
12.66
4.478e + 08
3.68
Quaternary carbon, methylene carbon
4
59.49
Gaussian
15.51
1.443e + 09
11.85
Oxygen-grafted methyl and oxygen-grafted methylene carbon
5
74.00
Gaussian
7.54
1.96e + 08
1.61
Intracyclic oxygen grafted carbon
6
119.91
Gaussian
12.51
1.39e + 09
11.41
Protonated aromatic carbon
7
127.76
Gaussian
11.32
3.619e + 09
29.71
Aprotonated aromatic carbon
8
138.81
Gaussian
8.08
9.857e + 08
8.09
Bridged aromatic carbon
9
144.27
Gaussian
12.79
4.458e + 08
3.66
Side-supported aromatic carbon
10
154.93
Gaussian
16.15
1.833e + 08
1.50
Oxygen substituted aromatic carbon
11
188.02
Gaussian
9.46
4.057e + 08
3.33
Carboxyl carbon
12
194.35
Gaussian
7.35
4.732e + 08
3.88
Carbonyl carbon
13
200.01
Gaussian
21.53
1.321e + 09
10.84
Carbonyl carbon
By analyzing the functional group attribution of the above coal samples and synthesizing the data such as half peak width and peak area obtained by peak fitting, the structural parameters of coal samples can be obtained, and the detailed parameters are shown in Table 5.
69.09
27.58
14.72
54.37
41.12
13.25
1.50
3.66
8.09
7.81
6.31
13.46
According to formula (1), the XBP value of coal sample is 0.17. The number of benzene rings and polycondensation degree of coal sample can be judged by this value, and the size of aromatic rings can be calculated.
3.3 Construction of coal molecules
According to the atomic ratio of coal sample, assuming that the number of carbon atoms in coal molecular structure is ×, the molecular formula of coal sample can be given as CxH0. 6117xO0. 2194xN0.0141xS0.0094x. Scholars have studied the structure and molecular weight of coal molecules, which shows that the molecular weight of coal is 2000 ∼ 3000, and the number of atoms is an integer. The molecular weight of coal sample is calculated by formula (2) as follows:
The molecular formula of coal sample is C128H78O18N2S, M = 2122.
3.3.1 Determination of aromatic structure type
Aromatic structure accounts for most of the whole coal molecular structure. The better the coal quality, the greater the proportion of aromatic structure and naphthene in coal, and the higher the degree of polycondensation. The carbon-hydrogen ratio and the calculated XBP in elemental analysis are important indexes reflecting the degree of polycondensation of aromatic structure in coal molecules, and the XBP of HY coal molecule is 0.17. For aromatic structures, XBP of benzene is 0, XBP of naphthalene is 0.25, or XBP of phenanthrene is 0.4, XBP of tetraphenyl is 0.5, and XBP of pentaphenol is 0.57 (Qiao et al., 2019; Kawashima and Takahashi, 2001). When establishing the molecular structure of coal, the appropriate aromatic structure should be selected. The appropriate type and quantity should be matched to make the average XBP as close as possible to the XBP of coal molecule. According to the XBP of coal to determine the types and numbers of various aromatic structures in the coal molecules, but also comprehensive consideration of nitrogen and sulfur aromatic structures, pyrrole, pyridine and thiophene.
Through the consideration of XBP, the amount of various aromatic structures in the construction of coal molecules in coal was determined. As shown in Table 6, pyrrole, pyridine, and thiophene structures with aromatic properties are listed separately, and most of them bridge to other aromatic structures in coal molecules.
Structure type
XBP
Number
Structure type
XBP
Number

0
1

0
1

0
1

0.25
6

0
1
3.3.2 Determination of fat structure type
The aliphatic carbon in coal is mainly in the form of branch chain or linked aromatic ring, which exists in the form of aliphatic ring, side chain or bridging carbon. The lower the metamorphic degree of coal, the longer the length of alkane side chain in molecular structure (Qiao et al., 2018; Trewhella et al., 1986; Qin et al., 1998). The aromatic ratio of coal sample is 54.37 %. The total number of aromatic carbon is 70, the total number of carbon atoms is 129, and the number of aliphatic carbon atoms is 68. The proportion of , , and is 6.31 %, 13.46 % and 7.81 % respectively. It can be seen that methyl, methylene, methylene and quaternary carbon are more in the molecular configuration of coal.
3.3.3 Determination of the remaining heteroatom types
The content of N in coal is 1 % ∼ 2 %, and the content of N in the form of pyridine ring or pyrrole ring accounts for about 50 % ∼ 75 % of the total N content (Niekerk and Mathews, 2010). Thiophene, sulfoxide sulfur, sulfone sulfur, and mercaptan thiophenol are the main forms of organic sulfur in coal samples (Gao et al., 2018). According to the atomic ratio in elemental analysis and the total number of C atoms calculated by 13C NMR, the number of N and S atoms can be calculated. The calculation shows that the number of N atoms is 2 and the number of S atoms is 1. There is one pyridine, one pyrrole, and one thiophene in the molecular configuration.
3.3.4 Molecular structure model of coal
Based on the results of aromaticity, structural unit, and elemental analysis, the macromolecular structure model of coal can be constructed. The molecular structure of coal is preliminarily plotted by MS software, and the results are shown in Fig. 6. The 13C NMR spectrum of the macromolecular structure model was calculated by MestReNova software, and compared with the experimental spectrum shown in Fig. 6, it was consistent with the experimental 13C NMR spectrum. The macromolecular two-dimensional structure model of HY coal is obtained, which is shown in Fig. 7. Three-dimensional macromolecular structure model of HY coal is shown in Fig. 8.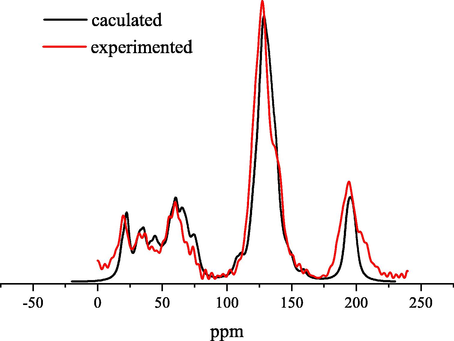
Comparison of 13C NMR of HY coal model.
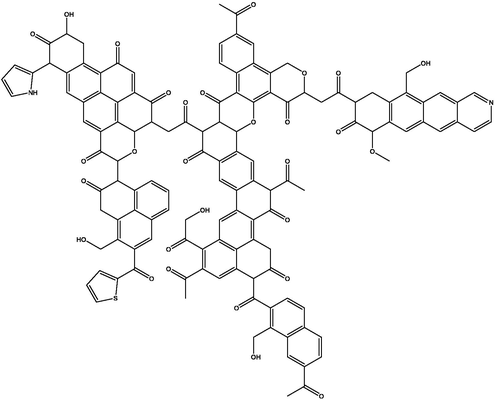
Macromolecular two-dimensional structure model of HY coal.
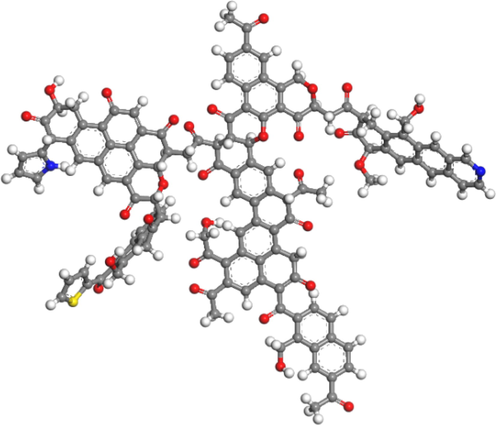
Macromolecular three-dimensional structure model of HY coal.
Forcite module of MS software was used to optimize the structure and energy of the modified molecular model, so that the molecular structure can reach a stable conformation. The final molecular structure model of coal samples is shown in Fig. 9. The parameter settings in the process of molecular structure optimization are shown in Table 7. The molecular weight and element contents of coal samples are shown in Table 8.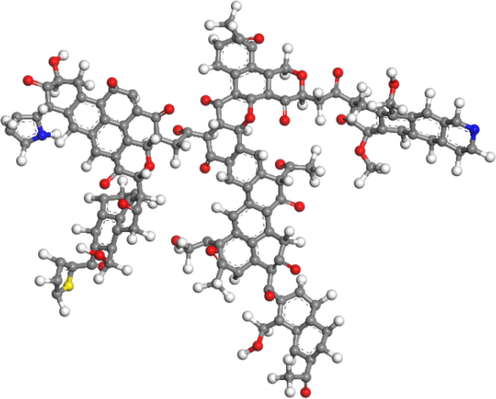
Optimized molecular structure of coal.
Precision
Fine
Force field
COMPASSⅡ
Electric field
Use current
Electrostatic convergence
Atom based
Van der Waals convergence
Atom based
Coal sample
Molecular formula
Molecular weight
Element content /%
C
H
O
N
S
HY
C129H88 O29N2S
2160
71.66
4.07
21.12
1.20
1.48
Table 9 shows the error analysis between the coal molecular model and elemental analysis in HY Mine. It can be seen that each element corresponds well.
Element
C
H
O
N
S
Experimented
72.19
3.68
21.12
1.20
1.81
Calculated
71.66
4.07
21.12
1.20
1.48
Deviation
0.007
0.106
0.017
0.083
0.182
3.4 Analysis of oxygen absorption characteristics of coal molecular structure in Hongyang No.2 mine
3.4.1 GCMC simulation
The Amorphous Cell module was used to construct the periodic structure, as shown in Fig. 10(a). In this manuscript, the Wiser bituminous coal model was selected as a comparison, as shown in Fig. 10 (b). The structural parameters of the Wiser model are shown in Table 10.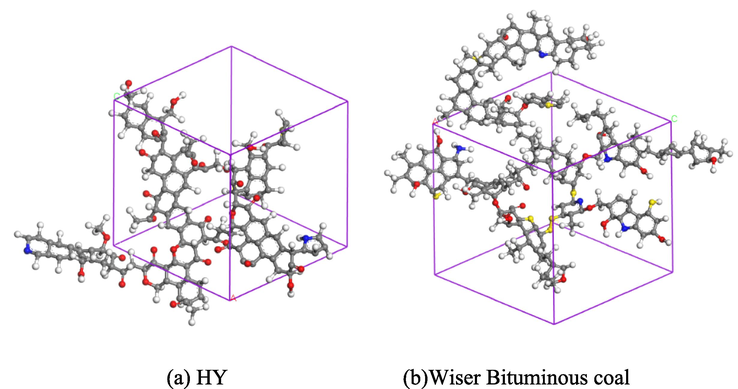
Molecular structure model of coal.
Molecular formula
Molecular weight
Element content
C
H
O
N
S
C192H165O20N5S8
3115
73.96
10.27
5.30
2.25
8.22
The coal molecular model was optimized geometrically and energetically. Finally, the coal molecular structure with the lowest energy was obtained. The COMPASSII force field was used to optimize the structure geometry, anneal, and then carried out molecular dynamics.
The density change diagram of HY coal model is shown in Fig. 11. The average density of bituminous coal is 1.27 g/cm3 after 50 ps calculation (the actual density of bituminous coal is between 1.2 and 1.4 g/cm3), which shows that the molecular structure of the constructed coal is reasonable.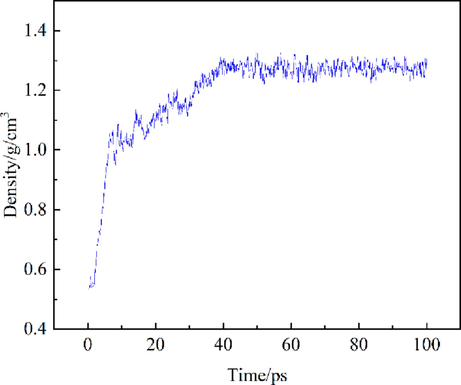
Density change of HY coal model.
3.4.2 Adsorption isotherm and heat of adsorption
Based on the coal molecular structure model constructed in Fig. 10, Sorption module was used to calculate adsorption isotherms (temperature 293 ∼ 333 K, pressure 0 ∼ 10 MPa).
The adsorption isotherms of O2 at different temperatures (293 ∼ 333 K) are shown in Fig. 12, and both HY model and Wiser model show the same trend. When the pressure is less than 8Mpa, the average adsorption capacity gradually increases with the increase of pressure. However, when the pressure approaches 10Mpa, the increase rate becomes flat. It is found that as the temperature increases, the corresponding adsorption of O2 decreases, which indicates that the adsorption of O2 is an exothermic process. When the pressure is the same, the adsorption capacity of Wiser model is less than that of HY coal model. Compared with Wiser model, HY coal has higher content of oxygenated aliphatic hydrocarbons and lower condensation degree of polycyclic aromatic hydrocarbons. Therefore, it has stronger physical adsorption capacity of O2. The analysis of physical adsorption parameters in section 3.4.4 shows that hydroxyl, ether bond and carbonyl group have stronger physical adsorption capacity of O2.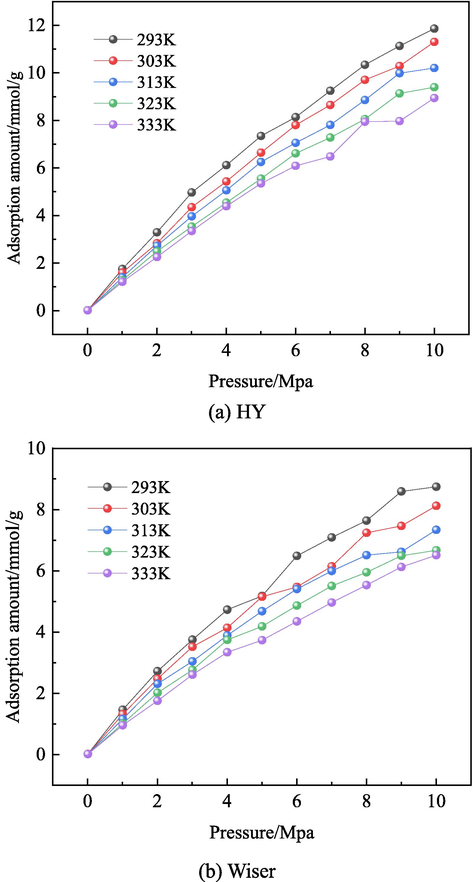
Adsorption isotherms of O2 at different temperatures.
The heat of physical adsorption is generated by the Vanderbilt energy of the interaction between coal and O2. The relationship between adsorption heat of O2 and adsorption capacity is shown in Fig. 13. The adsorption heat of O2 is between 7.5 and 9.5 kJ/mol (less than 42 kJ/mol), indicating that physical adsorption is dominant. The adsorption heat of O2 increases with the decrease of adsorption amount and the increase of temperature, indicating that the van der Waals force between O2 and coal molecules decreases with the increase of temperature. The accumulation of isothermal adsorption heat provides the initial energy of the oxidation reaction, and the increase of coal temperature caused by physical adsorption will further accelerate the oxidation reaction. When the amount of O2 adsorbed is the same, the adsorption heat of Wiser model is less than that of HY coal model, which indicates that the oxygen absorption capacity of HY coal model is greater than that of Wiser model.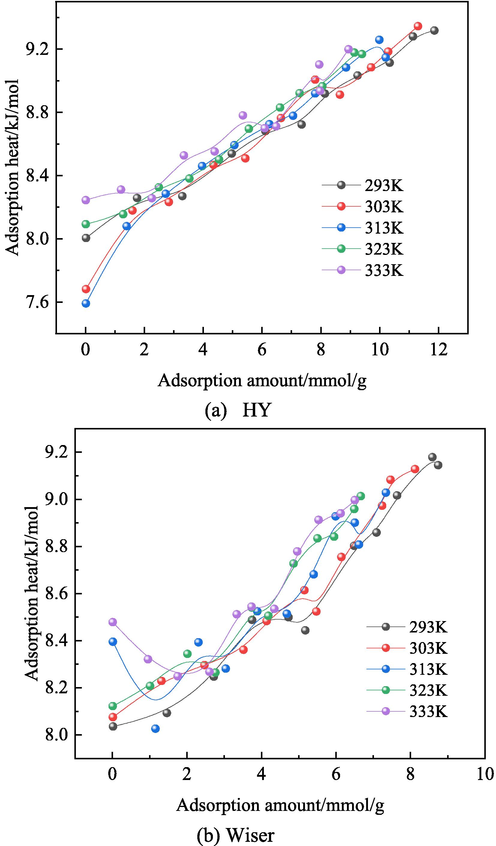
Relationship between adsorption heat of O2 and adsorption capacity.
3.4.3 Giant potential
To further study the properties of the physical adsorption heat of O2, the change of interaction energy during physical adsorption was analyzed, as shown in Fig. 14.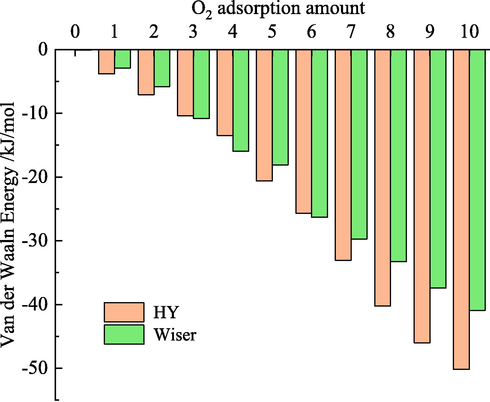
Relationship between van der Waals energy and O2 quantity.
Molecular simulation shows that only van der Waal energy is involved in the interaction between coal molecules and O2 during physical adsorption. This indicates that O2 is physically adsorbed in coal by the van der Waals force. As more O2 is adsorbed, the van der Waals energy decreases, which indicates that the physisorption process is exothermic. When the amount of O2 adsorbed is the same, the van der Waals energy of Wiser model is less than that of HY coal model, which further proves that the oxygen absorption capacity of HY coal model is greater than that of Wiser model.
3.4.4 Quantum chemical computation
To further study the physical adsorption capacity of O2 by different functional groups of coal molecules, the physical adsorption parameters of O2 adsorption by various functional structural units on coal surface were calculated based on quantum chemistry, including adsorption energy, adsorption equilibrium distance and Milliken charge transfer.
The Dmol3 module in MS software was used for quantum chemistry calculation, and the task item was set as Geometry Optimization with fine precision. In the calculation of electronic structure, the PWC functional form of LDA or PWE/PW91 functional form of GGA was used for electron exchange interaction. In order to reduce the disadvantage that GGA functional can not accurately describe non-covalent forces (hydrogen bond and van der Waals force), Grimme method of PWE functional and OBS method of PW91 functional were used for dispersion correction of DFT respectively (Jia et al., 2011). All Electron and DNP base groups were used to describe the nuclear and valence electrons, respectively. The Basis file was 3.5, the orbit cutoff accuracy was set to fine, the integration accuracy and SCF tolerance were set to 1 × 10⁻⁶, and the maximum SCF period was 1000.
In order to simplify the calculation, small molecular fragments at each adsorption site were constructed, and their adsorption parameters were analyzed.
The stable adsorption configuration of O2 at different adsorption sites is shown in Fig. 15, and the physical adsorption parameters of O2 molecules are listed in Table 11. It can be seen that hydroxyl group (2.992 kcal/mol) and ether bond (2.979 kcal/mol) have lower physical adsorption energy values, and they have higher physical adsorption capacity on O2. The physical adsorption equilibrium distance between hydroxyl (2.338) and methyl (2.914) and O2 is relatively small, while the physical adsorption distance between other adsorption sites and O2 is greater than 3 Å. Milliken charge transfer represents the polarization degree of O2 in physical adsorption. Hydroxyl group (0.043 e) has higher charge, followed by carbonyl group (0.025 e), methyl group (0.027 e) and ether bond (0.018 e), which indicates that O2 is adsorbed more stably near these adsorption sites. The smaller the physisorption energy and charge transfer value of O2 in parallel adsorption configuration, the easier it is for O2 to physisorption around adsorption sites in parallel adsorption configuration. Therefore, hydroxyl group, ether bond and carbonyl group are active groups for physisorption of O2.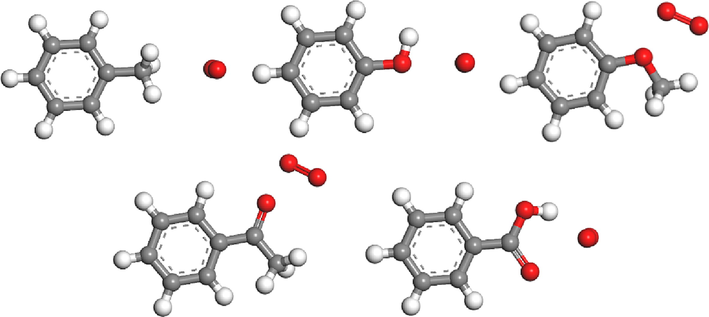
Stable adsorption configuration of molecular O2 at different adsorption sites.
Adsorption site
Direction
Adsorption energy /kcal/mol
Balance distance /Å
Charge transfer /e
–CH3
Parallel
−1.722
2.914
−0.022
–OH
Parallel
−2.992
2.338
−0.043
-C—O—C
Parallel
−2.979
3.218
−0.018
-C⚌O
Parallel
−2.475
3.095
−0.027
–COOH
Parallel
−2.187
3.046
−0.013
The adsorption affinity of different functional groups of O2 is obviously different, which provides energy for the gradual self-activation reaction of coal spontaneous combustion. The simulation results show that the heat released by physical adsorption can trigger the spontaneous combustion of coal. Therefore, it is possible to design inhibitors closer to the reactive groups in coal to reduce the physical adsorption heat and fundamentally prevent coal from spontaneous combustion.
4 Conclusion
(1) According to the 13C NMR parameters, the ratio of aromatic bridge carbon to weekly carbon in coal molecular structure is calculated to be 0.17. The aromatic compounds in HY coal samples are mainly naphthalene ring structures. Oxygen atoms exist in the form of carbonyl, hydroxyl, and ether bonds, nitrogen atoms exist in the form of pyridine and pyrrole respectively, and sulfur atoms exist in the form of thiophene.
(2) Using ChemDraw, Chem3D and MestReNova, the structure model which fits well with the 13C NMR spectra of HY coal was constructed; The molecular formula of HY coal is C129H88O29N2S and the molecular weight is 2160.
(3) The adsorption capacity of the Wiser model is less than that of HY coal model. Compared with Wiser model, HY coal has higher content of oxygenated aliphatic hydrocarbons and lower condensation degree of polycyclic aromatic hydrocarbons. Due to the stronger physical adsorption capacity of hydroxyl, ether bond, and carbonyl on O2, HY Mine has stronger physical adsorption capacity on O2.
(4) The adsorption ability of different functional groups to O2 is obviously different, which provides energy for the gradual self-activation reaction of coal spontaneous combustion. It is possible to design inhibitors closer to the reactive groups in coal to reduce the physical adsorption heat and fundamentally prevent coal from spontaneous combustion.
CRediT authorship contribution statement
Cong Ding: Supervision, Funding acquisition. Zongxiang Li: Data curation. Dongjie Hu: Data curation, Supervision. Chuntong Miao: . Bing Lu: Supervision. Dameng Gao: .
Acknowledgments
The authors acknowledge the financial support from the National Natural Science Foundation of China (51774170).
Declaration of Competing Interest
The authors declare that they have no known competing financial interests or personal relationships that could have appeared to influence the work reported in this paper.
References
- Molecular dynamic simulation of spontaneous combustion and pyrolysis of brown coal using Reax FF. Fuel. 2014;136:326-333.
- [Google Scholar]
- Castro-Marcano, Vladislav V. Lobodin, Ryan P. Rodgers, et al. A molecular model for Illinois No. 6 Argonne Premium coal: Moving toward capturing the continuum structure. Fuel 2012; 95:35-49
- Simulation of the adsorption behavior of CO2/N2/O2 and H2O molecules in lignite. J. China Coal Soc.. 2021;46(S2):960-969.
- [Google Scholar]
- A new insight into the structure of Huolinhe lignite based on the yields of benzene carboxylic acids. Fuel. 2017;189:408-418.
- [Google Scholar]
- Pyrolysis simulations of Fugu coal by large-scale ReaxFF molecular dynamics. Fuel Process. Technol.. 2018;178:197-205.
- [Google Scholar]
- XPS and FTIR spectroscopy characterization about the structure of coking coal in Xinyang. Spectrosc. Spectr. Anal.. 2017;37(8):2406-2411.
- [Google Scholar]
- Structure of bituminous coals: evidence from distribution of hydrogen. Nature. 1959;184:980-981.
- [Google Scholar]
- Distribution characteristics and differences of oxygen-containing functional groups in macerals of low-rank coal. J. China Coal Soc.. 2021;46(9):2804-2812.
- [Google Scholar]
- Construction of a coal char model and its combustion and gasification characteristics: molecular dynamic simulations based on ReaxFF. Fuel. 2021;300
- [Google Scholar]
- Construction and modification of 13C-NMR spectra of macromolecular structure model of Shandong 2–2 coal mirror group. J. Fuel Chem. Technol.. 2011;39(9):652-657.
- [Google Scholar]
- The quantum chemical study on the coal surface interacting with CH4 and CO2. J. China Coal Soc.. 2006;31(2):237-240.
- [Google Scholar]
- Pyrolysis behaviors and product distribution of Shenmu coal at high heating rate: A study using TG-FTIR and Py-GC/MS. Energ. Conver. Manage.. 2019;179:72-80.
- [Google Scholar]
- Modification of model structures of Upper Freeport coal extracts using 13C-NMR chemical shift calculations. Energy Fuel. 2001;15(3):591-598.
- [Google Scholar]
- Research on the structural characteristics of vitrinite in different coal ranks. Fuel. 2013;107(9):647-652.
- [Google Scholar]
- Competitive adsorption differences during coal spontaneous combustion process in noble gas atmosphere. China Saf. Sci. J.. 2020;30(4):60-67.
- [Google Scholar]
- Molecular model construction and study of gas adsorption of Zhaozhuang coal. Energy Fuel. 2018;32(9):9727-9737.
- [Google Scholar]
- Molecular representations of Permian-aged vitrinite-rich and inertinite-rich south African coals. Fue. 2010;89(1):73-82.
- [Google Scholar]
- Effect of soaking on the oxidation activation energy and thermal effect of coal. J. China Coal Soc.. 2018;43(9):2518-2524.
- [Google Scholar]
- Experimental study on a metal-chelating agent inhibiting spontaneous combustion of coal. Energy Fuel. 2019;33(9):9232-9240.
- [Google Scholar]
- Characteristics and mechanism on the 13C-NMR evolution of the carbon structure in the high-rank coals. J. China Coal Soc.. 1998;23(6):634-638.
- [Google Scholar]
- Shinn JH. Visualization of complex hydrocarbon reaction systems. Preprints of Papers American Chemical Society Division of Fuel Chemistry 1996; 41(6): 418
- Structure of green river oil shale kerogen: determination using solid state 13C-NMR spectroscopy. Fuel. 1986;65(4):541-546.
- [Google Scholar]
- Conversion of bituminous coal to liquids and gases: chemistry and representative processes. Magnetic Resonance. Netherlands: Springer; 1984.
- Molecular simulation of coal-fired plant flue gas competitive adsorption and diffusion on coal. Fuel. 2019;239:87-96.
- [Google Scholar]
- Enhancement of the surface hydrophobicity of low-rank coal by adsorbing DTAB: An experimental and molecular dynamics simulation study. Fuel. 2019;239:145-152.
- [Google Scholar]
- World coal resource supply and demand analysis. Coal Geol. China. 2012;24(6):74-76.
- [Google Scholar]
- Kinetics of oxidation and spontaneous combustion of major super-thick coal seam in Eastern Junggar Coalfield, Xinjiang, China. J. Loss Prev. Process Ind.. 2018;56:128-136.
- [Google Scholar]
- Large-scale molecular model construction of xishan bituminous coal. Energy Fuel. 2017;31:1310-1317.
- [Google Scholar]
- Molecular simulation of C2H4 /CO2 /N2 /O2 adsorption characteristics in lignite and anthracite. AIP Adv.. 2021;11:085205
- [Google Scholar]
- Characteristics of XRD parameter for different ranks of coals under fractional extraction and its evolution mechanism. J. China Coal Soc.. 2014;39(5):941-946.
- [Google Scholar]


