

Translate this page into:
Construction of macromolecular structure in KunNing coal and analysis of Macro-Micro oxidation characteristics
⁎Corresponding author at: College of Safety Science and Engineering, Liaoning Technical University, Liaoning 123000, China. djhu0418@gmail.com (Dongjie Hu),
-
Received: ,
Accepted: ,
This article was originally published by Elsevier and was migrated to Scientific Scholar after the change of Publisher.
Peer review under responsibility of King Saud University. Production and hosting by Elsevier.
Abstract
To explore the macro–micro coal oxidation characteristics for the purpose of preventing coal spontaneous combustion and achieving efficient coal conversion and utilization, the enclosed coal oxidation characteristics of KunNing coal sample (KN) under 25–70 °C were investigated. KN coal molecular models were constructed based on analysis and testing results of X-ray Photoelectron Spectroscopy (XPS), Carbon-13 Nuclear Magnetic Resonance Spectroscopy (13C NMR), Fourier Transform Infrared Spectroscopy (FTIR) and other techniques. The pyrolysis processes of coal-oxygen reaction systems with different oxygen contents were simulated using ReaxFF force field. The results show that the oxygen consumption rate, CO release rate, CO2 release rate and oxidation heat release intensity of coal increase exponentially with rising temperature. The ratio of aromatic bridge carbon to peripheral carbon in KN coal molecular structure is 0.08, and the molecular formula is C149H76O15N2S2. In the later stage of the experimental and molecular dynamics simulation processes, the CO content decreased while the growth rate of CO2 increased. Different indicator gases exhibit varied responses to oxygen content. The C-atom labeling and traceback results for the four indicator gas molecules demonstrate that CO2 mainly comes from aldehyde, hydroxyl, carboxyl and methoxy groups in coal molecules, CO is primarily generated from esters, phenols, carbonyls, C2H2 is predominantly derived from ring-opening and cracking of cycloalkanes, and the source of C2H4 is related to cycloalkanes and alcohols.
Keywords
Enclosed coal oxidation test
Oxidation heat release intensity
Reaction kinetics
Indicator gas molecule traceback
Active groups

1 Introduction
Coal spontaneous combustion can lead to fires and explosions, endangering life safety, causing resource waste, and producing large amounts of hazardous gases that contaminate the environment (Liang et al., 2016; Zhang et al., 2015; Onifade and Genc, 2020). Accurately depicting coal molecular composition and structure, thoroughly revealing the reaction mechanisms of different structural units under low-temperature oxidation conditions, and exploring the generation and conversion laws of indicator gases, are the keys to improving cognition on coal spontaneous combustion mechanisms and guiding efficient coal utilization and conversion (Jiang et al., 2019; Bhoi et al., 2014; Zeng et al., 2018).
Utilizing modern testing techniques, such as X-ray Photoelectron Spectroscopy (XPS), Carbon-13 Nuclear Magnetic Resonance Spectroscopy (13C NMR), Fourier Transform Infrared Spectroscopy (FTIR), etc., to study coal molecular structure is a common approach adopted by scholars, and over a hundred coal molecular models have been constructed (Shinn, 1996; Wiser, 1984; Given, 1959). Studying the characteristics and laws of chemical reactions, intermolecular interactions, structural evolutions, product formations, etc. of coal during low-temperature oxidation and combustion from a molecular perspective has become an important way to enrich the mechanisms of coal spontaneous combustion (Mathews et al., 2011; Sen and Dash, 2020). Zhan (Zhan et al., 2014) obtained the initial generation pathways of CO, CO2 and CH4 in the initial pyrolysis mechanisms of bituminous coal, and proposed that C9H9O radical is an important structure during pyrolysis. Zhang (Zhang et al., 2014) quantitatively derived the effects of humidity and temperature on coal methane adsorption and coal swelling mechanisms from a microscopic perspective through Monte Carlo (MC) and molecular dynamics (MD) simulations. Zheng (Zheng et al., 2013) simulated the pyrolysis process of bituminous coal using ReaxFF molecular dynamics simulation, and obtained the generation sequence of indicator gases which is consistent with the experimentally determined laws. Long (Long et al., 2021) studied the microscopic mechanisms of loading, adsorption and diffusion of CH4, CO2 and N2 gases in coal and the quantitative relationship between coal pore size distribution using Monte Carlo and molecular dynamics simulations. Gao (Gao et al., 2018) employed ReaxFF simulation and found that the main reaction pathways for generating CO2, H2O, CH4 and H2 during Fugu coal pyrolysis are closely related to carboxyl and methoxy groups. The above studies investigated the interactions and chemical reactions between coal and gas molecules from a microscopic perspective, and the conclusions are of great significance for enriching the mechanisms of coal spontaneous combustion and improving coal conversion and utilization efficiency. However, different types of coal exhibit variations in their physicochemical properties, which inevitably leads to differences in their molecular structures. Therefore, based on the research conducted by the aforementioned scholars, it is necessary to establish a molecular model for Kunming mine coal and investigate its chemical reaction characteristics.
The KunNing coal type belongs to bituminous coal, which contains a carbon content of 75 % to 90 %, an oxygen content of 10 % to 15 %, and relatively low levels of ash and moisture content. In order to explore the oxidation characteristics of KunNing coal (KN), self-developed enclosed coal oxidation experiments were used to investigate the oxygen consumption, variation laws of generated CO and CO2 gas concentrations, oxidation heat release intensity and other macroscopic oxidation characteristics of KN coal at 25, 30, 35, 40, 45, 50, 55, 60, 65, 70 °C, respectively. The molecular structure was studied using industrial analysis, elemental analysis, XPS, 13C NMR and FTIR from a microscopic perspective, based on which the molecular plane structure model was constructed (Ding et al., 2023; Gao, 2021; Meng et al., 2018). ReaxFF pyrolysis simulation was utilized to analyze the pyrolysis processes of coal-oxygen reaction systems with different oxygen contents, obtaining the molecular structure of KN coal and the initial positions of carbon atoms in CO, CO2, C2H4, C2H2 and other indicator gas molecules in the coal molecules (initial structures) as well as the generation pathways of indicator gases. This study will contribute to understanding the oxidation characteristics of KN coal from both macroscopic and microscopic perspectives, and provide theoretical guidance for its coal spontaneous combustion prevention and control techniques.
2 Experimental and analytical methods
2.1 Coal sample preparation and proximate/ultimate analyses
The raw bituminous coal collected from KunNing Mine in JinZhong City, Shanxi Province was sealed and transported to the laboratory. It was then crushed and sieved below 200 mesh under nitrogen atmosphere to obtain the coal sample (named KN) for subsequent experiments. The KN coal sample was analyzed for proximate and ultimate analyses following Chinese National Standards GB/T 212–2008 and GB/T 31391–2015, using 5E-MAG6600B industrial analyzer manufactured by Jiaozuo Hua coal Mining Equipment Co., Ltd. in China and Vario EL elemental analyzer produced by Elementar Group in Germany, respectively. The results are shown in Table 1. Based on the elemental analysis results in Table 1, the atomic ratios referenced to carbon were calculated as shown in Table 2.
Proximate analysis (%)
Elemental analysis (%)
Moisture
Ash
Volatile
Fixed carbon
C
H
O
N
S
0.99
8.31
9.16
81.54
81.97
3.49
10.94
1.22
2.38
Coal sample
H/C
O/C
N/C
S/C
KN
0.5109
0.1001
0.0128
0.0109
2.2 XPS analysis
X-ray photoelectron spectroscopy (XPS) was performed on a Thermo Fisher Scientific ESCALAB Xi + spectrometer with Al Ka radiation (hv = 1486.6 eV) as the excitation source under ultra-high vacuum around 8 × 10⁻¹⁰ Pa. The signal was accumulated for 10 cycles. The passing energy was 100 eV for survey scan and 30 eV for narrow scan with a step size of 0.05 eV and dwell time of 40–50 ms. All binding energies were referenced to C 1 s at 284.80 eV.
2.3 13C NMR analysis
A 400 MHz Bruker nuclear magnetic resonance spectrometer with a resolution of 4.0 mm was used for 13C NMR measurements, equipped with a double resonance MAS probe with a rotor spinning speed of 10 kHz. The pulse width was 4 μs with a pulse delay time of 1 s and contact time of 2 ms. The number of scans was 10000. Carbon atomic information was probed following SY/T 5777–1995.
2.4 FTIR analysis
Fourier transform infrared spectra were collected on a Thermo Fisher Scientific Nicolet iS10 spectrometer with a resolution of 0.5–1 cm−1 over a scanning range of 4000–400 cm−1 and 32 scans. The coal sample was mixed and ground thoroughly with KBr at 1:100 prior to measurement.
2.5 Enclosed coal oxidation experiments
The enclosed coal oxidation experimental setup was independently developed and designed by Professor Li Zongxiang from Liaoning Technical University (Li et al., 2017; Hu and Li, 2022). The schematic diagram of the experimental assembly is illustrated in Fig. 1, which includes: 1) computer, 2) gas pump, 3) gas concentration sensor, 4) data collector, 5) flow meter, 6) condensing tube, 7) collecting bottle, 8) drying tube, 9) preheating pipeline, 10) coal container, and 11) thermostatic oven.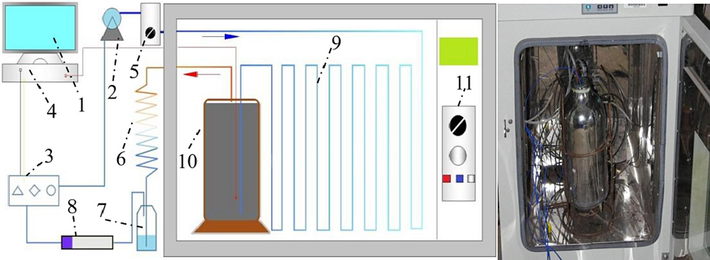
Schematic of sealed oxygen consumption experimental device.
The experimental procedure is as follows: 2.0 kg of crushed coal with a particle size of 0.4–2.4 mm was loaded into the coal container. Gas lines were disconnected 10 mins prior to the test for flushing to eliminate interferences. After reconnecting the setup and ensuring no gas leaks, the thermostatic oven was run to set temperatures of 25, 30, 35, 40, 45, 50, 55, 60, 65, 70 °C for 10 tests. O2, CO and CO2 concentration data were recorded by data acquisition software until the O2 curve flattened.
2.6 Coal molecular modeling and ReaxFF pyrolysis simulation
Coal macromolecule construction. Based on elemental analysis, FTIR, XPS and 13C NMR results, the coal molecular structure was built in Material Studio and geometry optimized in the Dreiding force field using the Forcite module with Fine quality.
Construction of coal-oxygen mixed systems. The mixed systems containing coal molecules and O2 were constructed in Amorphous Cell module under 0.5 g/m3 density (Feng et al., 2019; Zhang, 2022). NPT (constant pressure/temperature) ensemble was employed for density optimization with 30 frames. The lowest energy frame was taken and annealed 30 cycles from 300 to 1000 K under NVE (microcanonical ensemble) using the Anneal module in Forcite to get the optimized lowest energy model.
ReaxFF pyrolysis simulation. The constructed mixed systems were simulated using ReaxFF reactive force field in LAMMPS package. The dynamics calculations were performed under 3D periodic boundary conditions using force field parameters containing C/H/O/N/S/Na elements. The simulation was carried out in the NVE ensemble using the REAX/C computational module, with a time step of 0.2 fs and heating rate of 5 K/ps from 300 to 5000 K (Liu et al.,).
3 Results and discussion
3.1 XPS analysis
X-ray photoelectron spectroscopy (XPS) can accurately determine the characteristics of organic functional groups in the 2–5 nm surface molecular layer of coal by measuring the binding energies of photoelectrons from different elements and valence states. The survey spectrum along with C 1 s, N 1 s, O 1 s, S 2p deconvoluted peaks of the KN coal sample are displayed in Fig. 2. The attribution summary of binding energies for quantitative analysis of functional group types and quantities is listed in Table 3.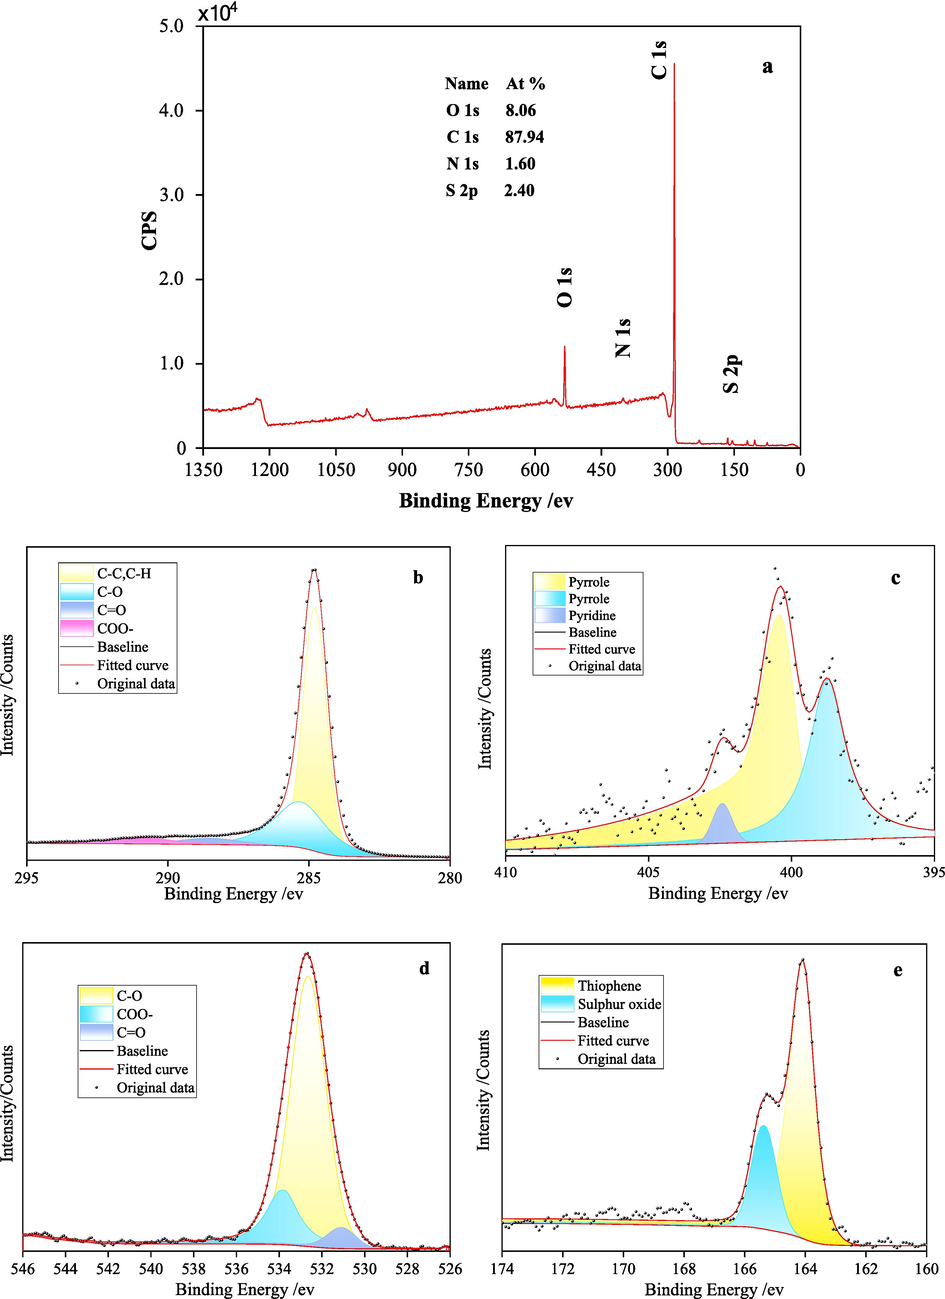
XPS spectra of the KN coal sample (a - survey; b - C 1 s; c - N 1 s; d - O 1 s; e - S 2p).
Figure
Number
Peak
position /eVFWHM
/eVArea
Relative
area /%Attribution
a/C 1 s
1
284.80
1.12
186763.28
64.50
C–C/C–H
2
285.29
2.19
77120.75
26.64
C-O
3
288.53
2.50
10901.80
3.77
COO–
4
290.95
2.49
14669.95
5.08
C = O
b/N 1 s
1
398.74
1.56
3189.38
36.61
Pyrrole
2
400.43
1.52
5226.01
60.04
Pyrrole
3
402.42
0.79
291.46
3.35
Pyridine
c/O 1 s
1
531.09
1.59
4983.18
7.14
COO–
2
532.64
1.96
52206.05
74.90
C-O
3
533.79
1.81
12503.81
17.95
C = O
d/S 2p
1
164.11
0.95
3736.89
61.48
Thiophene
2
165.32
1.02
2339.87
38.52
Suiphur oxide
As shown in Fig. 2 and Table 1, the main components of the coal sample are C and O-containing functional groups and structures, while N and S-containing groups are relatively less. In the C 1 s binding energy region (Fig. 2b), there are 4 fitted peaks attributed to C–H/C–C, C-O, C = O and COO–, among which C–H/C–C and C-O are predominant with area percentages of 64.50 % and 26.64 %, respectively. C = O and COO– contents are lower, consistent with the O 1 s deconvolution results in Fig. 2d, where O atoms mainly exist as C-O, C = O and COO–, with C-O accounting for 74.90 %. As displayed in Fig. 2c, the N 1 s region contains 3 peaks, attributed to Pyrrole and Pyridine, with Pyrrole as the major form. Fig. 2e shows 2 peaks for S 2p, with peak 1 (61.48 %) belonging to thiophene organic sulfur structure and the other peak assigned to inorganic sulfates.
3.2 13C NMR analysis
13C NMR spectroscopy can sensitively determine the carbon existence forms in coal molecules, thereby reflecting the approximate structure of coal molecular backbone. The 13C NMR spectrum is divided into four chemical shift regions based on the types of chemical functionalities: 0–60 ppm - aliphatic carbon, 60–90 ppm - ether oxygen, 90–165 ppm - aromatic carbon, and ∼ 200 ppm - carbonyl peak. Fitting of the processed data yielded 13 peaks in the 13C NMR spectrum of the KN coal sample, as displayed in Fig. 3, with detailed parameters listed in Table 4.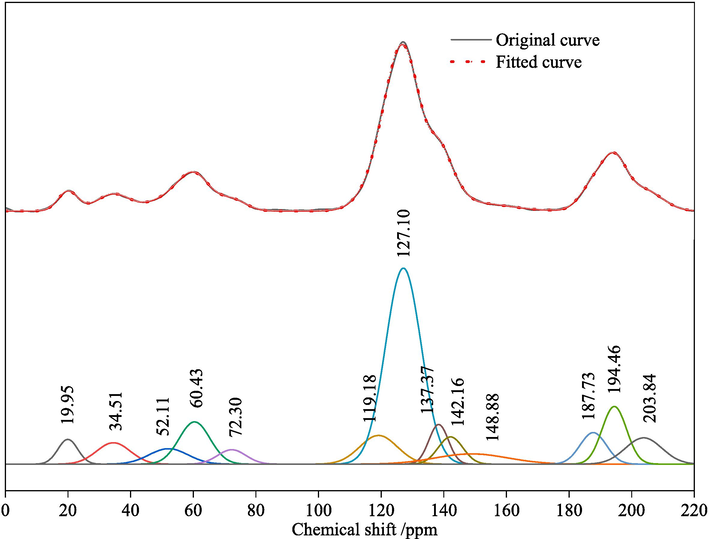
Experimental and fitted 13C NMR spectra of the coal sample.
Number
Chemical shift /ppm
Peak type
Peak width
Area
Relative area /%
Attribution
1
19.95
Gaussian
7.42
3.71 × 10⁸
2.88
Benzylic carbon
2
34.51
Gaussian
12.72
5.50 × 10⁸
4.26
Methylenic carbon
3
52.11
Gaussian
14.52
4.54 × 10⁸
3.52
Quaternary and secondary methyl carbon
4
60.43
Gaussian
11.63
9.92 × 10⁸
7.69
Methoxy/oxygen-substituted methylene carbon
5
72.30
Gaussian
10.64
3.10 × 10⁸
2.40
Oxygen-substituted aliphatic carbon in rings
6
119.18
Gaussian
14.11
8.18 × 10⁸
6.34
Protonated aromatic carbon
7
127.10
Gaussian
13.44
5.32 × 10⁹
41.23
8
137.37
Gaussian
7.31
5.85 × 10⁸
4.54
Bridging aromatic carbon
9
142.16
Gaussian
9.23
5.08 × 10⁸
3.94
Aliphatic carbon attached to aromatic ring
10
148.88
Gaussian
27.36
5.67 × 10⁸
4.39
Oxygen-substituted aromatic carbon
11
187.73
Gaussian
9.83
6.26 × 10⁸
4.85
Carboxyl carbon
12
194.46
Gaussian
9.20
1.07 × 10⁹
8.30
Carbonyl carbon
13
203.84
Gaussian
13.77
7.31 × 10⁸
5.67
Protonated aromatic carbons account for 47.57 % of the total peak area, indicating the predominant basic structure of protonated aromatic carbons in KN coal molecular skeleton, while other carbon types (like bridgehead aromatic, branched aromatic, aromatic methyl, oxygen-substituted aromatic carbons, etc.) are present in smaller quantities.
According to chemical shift regions and analysis of Table 4, the structural parameters involving 12 carbon species in the molecular backbone were obtained as shown in Table 5 (Yao et al., 2003; Solum et al., 1989).
Coal
Sample
KN
2.88
15.47
2.40
20.75
13.97
60.44
74.41
47.57
12.87
3.94
4.54
4.39
€The mean aromatic condensation degree XBP was calculated using Eq. (1).
The obtained XBP value for KN coal sample is 0.08, which can be used to estimate the number and condensation degree of benzene rings as well as the aromatic ring size.
3.3 FTIR analysis
FTIR spectroscopy is an important technique to determine the connectivity modes of aliphatic structures, oxygen-containing functionalities, aromatic structures and other cycloalkane structures in coal. Fig. 4 illustrates the fitted FTIR spectrum of the KN coal sample, which can be primarily categorized into 4 regions (Gao et al., 2018; Gao, 2021; Zhang, 2022): 900–700 cm−1; 1800–1000 cm−1, 3000–2800 cm−1 and 3600–3000 cm−1. The peaks from 900 − 700 cm−1 and 1800–1000 cm−1 correspond to various aromatic hydrocarbon structures, including 1,2-disubstituted, 1,2,4/1,2,3,4-trisubstituted aromatics and C–C vibrations in aromatics.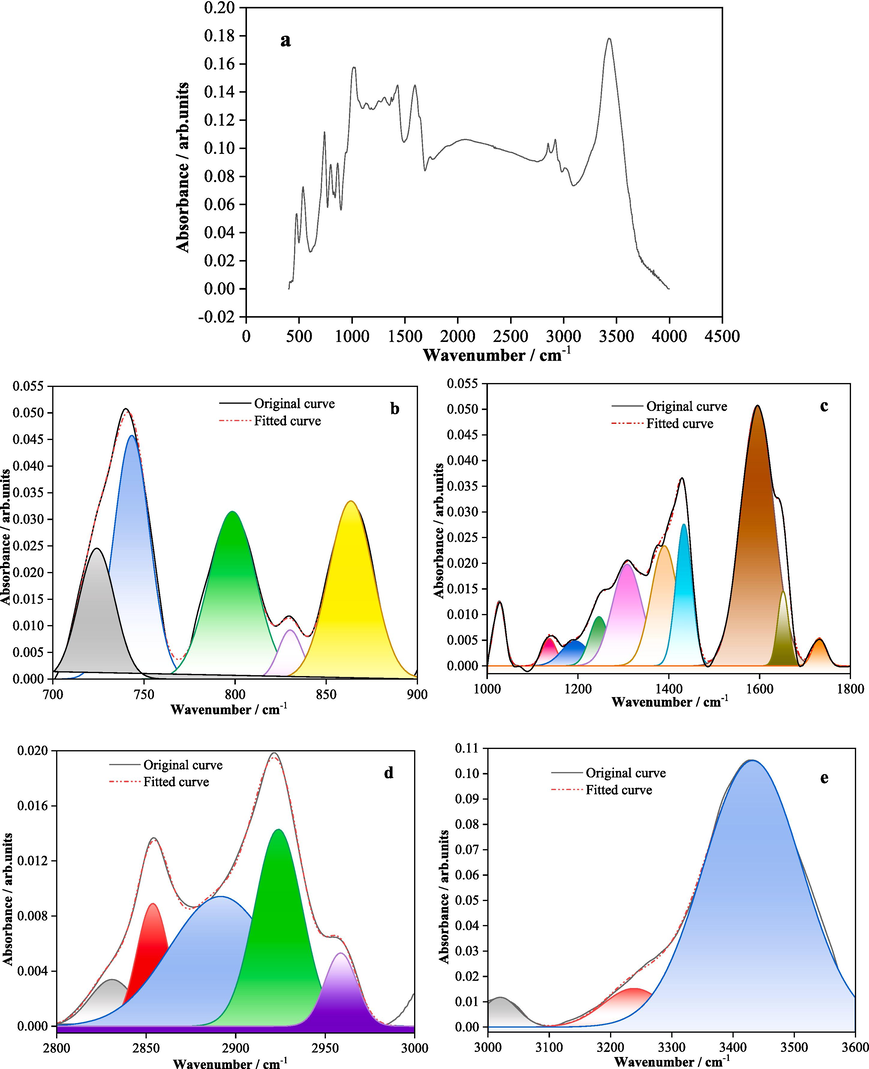
Fitted FTIR spectrum of the coal sample (a is the full spectrum curve).
The vibration of carbonyl groups (C = O) in the 1800–1000 cm−1 range likely indicates the presence of some carbonyl-containing compounds. The 3000–2800 cm−1 region represents aliphatic CH and CH2 vibrations, suggesting aliphatic compounds in coal. C-O vibrations in 1800–1000 cm−1 imply coal may contain phenols, alcohols, ethers, esters and other functionalities. Further FTIR analysis parameters of the KN coal sample are listed in Table 6.
Figure
Number
Peak position /cm−1
Peak width /cm−1
Peak type
Area
Area
/%Attribution
a
1
724.14
23.26
Gaussian
0.60
15.49
1,3-disubstituted aromatic CH
2
743.35
22.97
Gaussian
1.12
28.74
1,2-disubstituted aromatic CH
3
798.54
30.20
Gaussian
1.01
25.99
1,2,4/1,2,3,4-tetrasubstituted aromatic CH
4
830.25
15.16
Gaussian
0.15
3.82
1,4-disubstituted aromatic CH
5
863.55
28.41
Gaussian
1.01
25.96
1,2,4/1,2,3,4,5-pentasubstituted
aromatic CH
b
1
1026.58
28.98
Gaussian
0.38
3.41
Ash
2
1136.78
36.03
Gaussian
0.20
1.82
C-O in phenols, alcohols, ethers, esters
3
1193.54
69.52
Gaussian
0.36
3.19
4
1246.28
48.88
Gaussian
0.50
4.43
5
1308.27
77.01
Gaussian
1.62
14.42
6
1390.18
69.17
Gaussian
1.72
15.32
–CH3 symmetric deformation vibration
7
1433.21
41.40
Gaussian
1.22
10.82
–CH2 and –CH3, inorganic carbonates
8
1594.96
85.18
Gaussian
4.60
40.88
Aromatic C–C
9
1651.66
28.51
Gaussian
0.44
3.92
Carbonyl; -O-substituted aromatic C = C
10
1731.19
34.59
Gaussian
0.20
1.78
Aliphatic C = O
c
1
2830.92
29.32
Gaussian
0.11
6.73
Aliphatic CH2 symmetric stretching
2
2853.71
21.12
Gaussian
0.20
12.73
Aliphatic CH3 symmetric stretching
3
2891.56
67.25
Gaussian
0.67
42.85
Aliphatic CH asymmetric stretching
4
2923.84
31.17
Gaussian
0.47
30.13
Aliphatic CH2 asymmetric stretching
5
2958.61
21.01
Gaussian
0.12
7.56
Aliphatic CH3 asymmetric stretching
d
1
3019.96
67.99
Gaussian
0.85
3.57
Aromatic CH stretching
2
3238.39
117.63
Gaussian
1.91
8.01
Hydrogen-bonded –OH, –NH; phenols
3
3431.95
188.10
Gaussian
21.06
88.42
Hydroxyl
3.4 Construction of coal macromolecular models
Elucidating coal macromolecular structures is crucial for investigating the physicochemical properties of coal at the microscopic level, providing access to transition states, free radicals, bond energies and many other results hard to obtain from macroscopic experiments via quantum mechanical molecular simulations.
According to the elemental ratios in Table 2, assuming the number of C atoms in the coal molecule is x, the molecular formula of KN coal sample can be written as CxH0.5109xO0.1001xN0.0128xS0.0109x. Relevant research shows the molecular weight of coal is around 2000–3000, and the atomic numbers should be integers. Hence, the molecular formula of KN coal was determined using Eq. (2) by taking x = 149, giving C149H76O15N2S2 and M = 2204.
The types and numbers of carbon atoms were calculated based on the 13C NMR results (Gao, 2021), including protonated aromatic (FaH), bridgehead aromatic (FaB), branched aromatic (FaS), oxygen-substituted aromatic (FaP), total aromatic (Fa’), carbonyl (FaC) and aliphatic (FAl) carbons, as listed in Table 7.
Parameter
Number
71
7
6
6
90
21
31
3.4.1 Aromatic structures
The C content in KN coal is 81.97 %, and the XBP ratio between aromatic bridge and peripheral carbons is 0.08. This is close to 0 for benzene but lower than 0.25 for naphthalene. The XBP values for anthracene/phenanthrene, tetracene and pentacene are 0.4, 0.5 and 0.57, respectively (Trewhella et al., 1986; Zhou, 2008). Therefore, the molecular structure of KN coal is primarily composed of benzene and naphthalene units, with negligible anthracene/phenanthrene contents. The XPS results also indicate small amounts of pyrrole and thiophene structures present in the macromolecules.
3.4.2 Aliphatic carbon structures
For aliphatic carbons, the carbon atoms mainly exist in the form of aliphatic side chains, cycloalkanes and hydrogenated aromatic rings. Combined with the FTIR results of KN coal sample, its aliphatic structures are present primarily as alkyl side chains and cycloalkanes. The 13C NMR data also show the presence of oxygen-substituted aliphatic carbons in the molecular structure (Ding et al., 2023; Gao, 2021; Zhang, 2022). The calculated aromaticity Ha, average number of carbons per methylene chain Cn, degree of alkyl chain branching Cm, aromatic substitution degree ε, and CH2:CH3 ratio based on 13C NMR results are listed in Table 8.
Coal sample
Ha / %
Cn
Cm / %
ε / %
CH2:CH3
KN
11.17
0.50
19.18
17.30
1.48
3.4.3 Other heteroatom types
Elemental analysis indicates small amounts of N and S in the KN coal sample. According to the XPS results, N in the form of pyrrole rings accounts for over 90 % of the total N content. Without considering inorganic sulfur, S elements in coal mainly exist as thiophene, thiol, sulfide, disulfide and thioxanthone (Liu, 2019). The calculated N and S atomic numbers in the KN coal molecule are both 2. Combined with the XPS data, the molecular structure of KN coal is determined to contain 2 pyrrole and 2 thiophene units.
3.4.4 Coal macromolecular model
Based on the above analysis and Table 7, the molecular structure of KN coal is primarily composed of benzene and naphthalene units, with negligible anthracene/phenanthrene contents, as well as small amounts of pyrrole and thiophene structures. The aromatic unit types and numbers are listed in Table 9.
Structure type
XBP
Number
Structure type
XBP
Number

0
0

0
4

0
2
0.25
5

0
2
The coal molecular structure was constructed using MS software. The 13C NMR spectrum of this macromolecular model was calculated using MestReNova and compared with the experimental spectrum in Fig. 2. The molecular structure was adjusted to match the experimental NMR results as much as possible, as shown in Fig. 5. Geometry optimization was then performed in the Dreiding force field using the Forcite module in MS. The final optimized macromolecular structure model of KN coal is displayed in Fig. 6.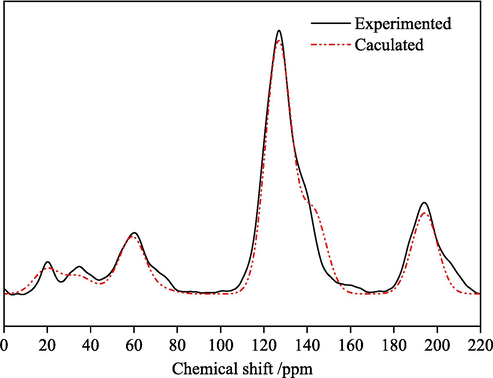
Comparison of experimental and model 13C NMR spectra.
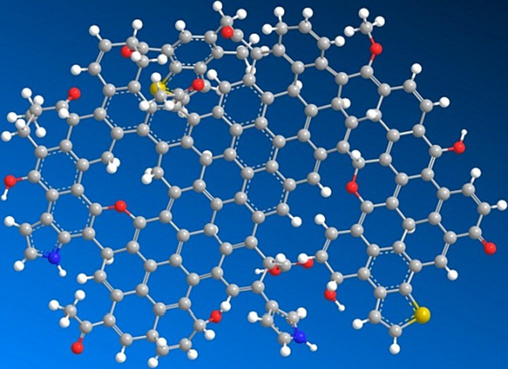
Molecular structure model of KN coal.
3.5 Coal oxidation characteristics analysis
3.5.1 Enclosed coal oxidation test results
The air leakage rate in the loose coal bed inside the enclosed coal oxidation test setup can be regarded as a constant. Thus, according to mass transfer principles, the oxygen consumption rate λ1, and CO and CO2 generation rates λ2 and λ3 at the same temperature under different oxygen volume fractions can be expressed as:
The maximum temperature in the enclosed oxidation experiments is 70 °C. Hence, it can be assumed that oxygen is only converted to CO and CO2 during the coal oxidation reactions inside the test setup, without considering other intermediates. The oxidation heat release intensity of coal can then be estimated using the bond energy balance method (Li et al., 2023; Chen et al., 2005; Chu et al., 2008):
Where Q is the oxidation heat release intensity, J·(cm3·s)-1; Δh1 is the chemical adsorption heat of coal oxidation, 58.80 KJ·mol−1; Δh2 is the heat for CO formation, 110.54 KJ·mol−1; Δh3 is the heat for CO2 formation, 393.51 KJ·mol−1.
Combining Equations 3–6, the oxygen consumption rate, CO and CO2 generation rates, and oxidation heat release intensity of the coal samples under 20 % oxygen volume fraction at different temperatures were calculated and plotted in Fig. 7.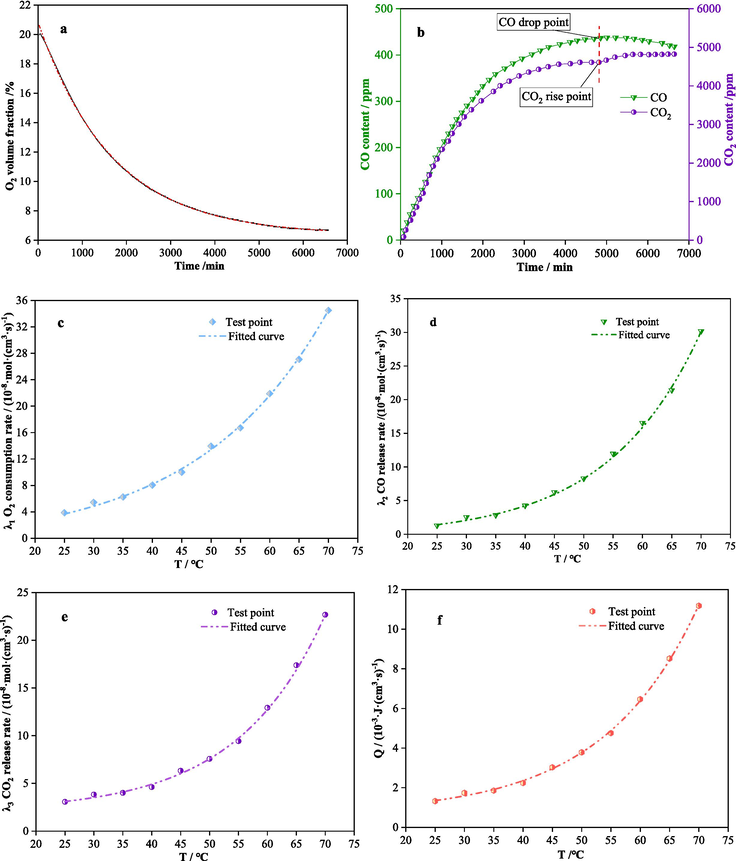
Enclosed coal oxidation test results.
Fig. 7a and 7b show the variation of the three gases with time during the enclosed oxidation test at 25 °C. Fig. 7c-f illustrate that the oxygen consumption rate, CO and CO2 generation rates, and oxidation heat release intensity of the coal sample all increase exponentially with rising temperature. Compared to 25 °C, the oxygen consumption rate, oxidation heat release intensity at 70 °C are enhanced by about 800 % and 700 %, respectively.
3.5.2 ReaxFF pyrolysis simulation of coal macromolecules
The enclosed coal oxidation experiments in this study focused on investigating the oxidation characteristics below 70 °C. ReaxFF simulation of coal has significant advantages in studying the chemical reactions, intermolecular interactions, structural evolution and product formation during coal high temperature reactions and combustion from the atomic level. The constructed mixed systems containing coal molecules and O2 with different oxygen amounts are shown in Fig. 8. Assuming that all atoms in the coal molecule react completely to form stable structures (CO2, H2O, N2, SO2) through pyrolysis (Zhang, 2022). In this case, the number of oxygen molecules that need to be added to the reaction system is approximately 900, and the oxygen content of this reaction system is defined as 100 %. Therefore, the oxygen contents in Fig. 8 are sequentially: 0 %, 25 %, 50 %, 75 %, 100 %, and 125 %.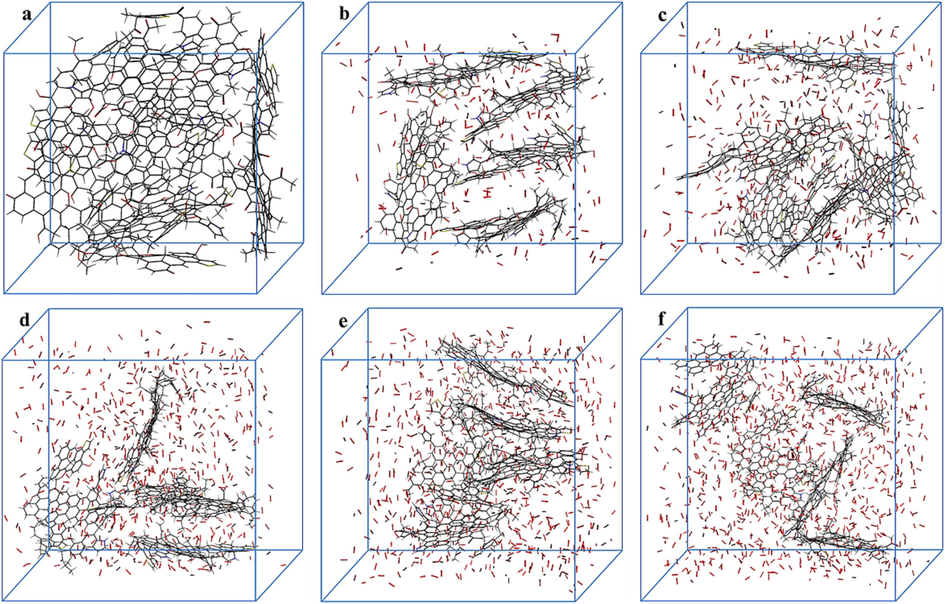
KN coal reaction systems with different oxygen content.
Fig. 9 illustrates the generation behaviors of indicator gases during the ReaxFF pyrolysis kinetics simulation of the KN coal sample, where Fig. 9a and 9b present the CO2 and CO content changes along the reaction process. With increasing oxygen content in the reaction systems, the CO2 and CO amounts also gradually rise. However, in the later reaction stage (250000 simulation steps), the CO content starts to decline while CO2 increases, consistent with the trend exhibited in Fig. 7b. As displayed in Fig. 9c and 9d, the existence durations of C2H2 and C2H4 increase with higher oxygen content, and their content variation trends are similar.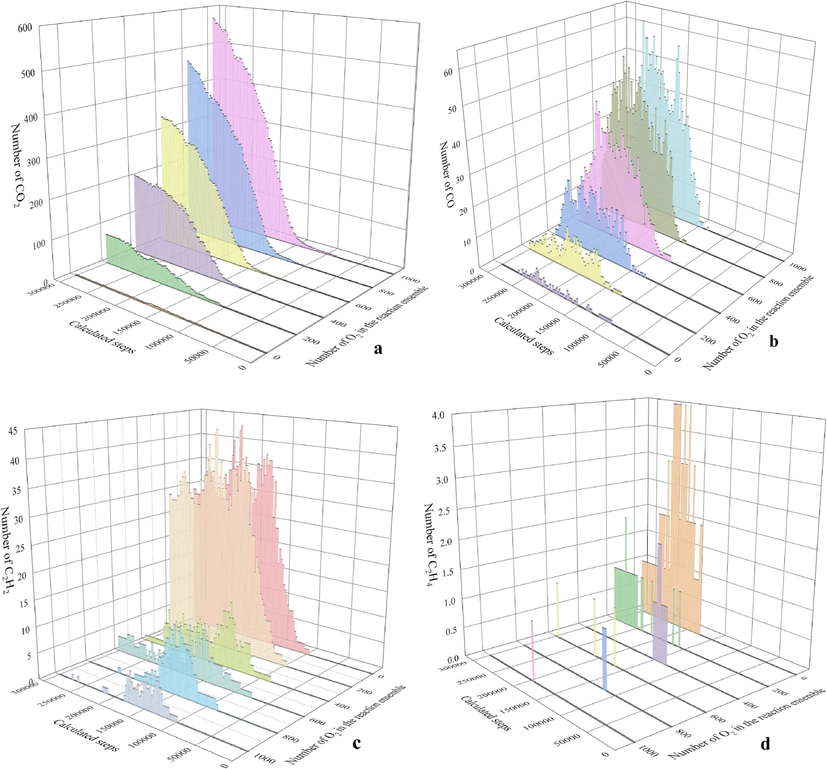
Simulated generation patterns of indicator gases for KN coal sample.
In the reaction system with 1000 oxygen molecules, the CO2, CO, C2H2 and C2H4 gas molecules were labeled and traced back to determine the initial positions of atoms in coal macromolecules that generate these four indicator gases. This allows identification of structural units in the KN coal molecule responsible for the oxidative formation of CO2, CO, C2H2 and C2H4, thereby inferring their potential major reaction pathways, as depicted in Fig. 10.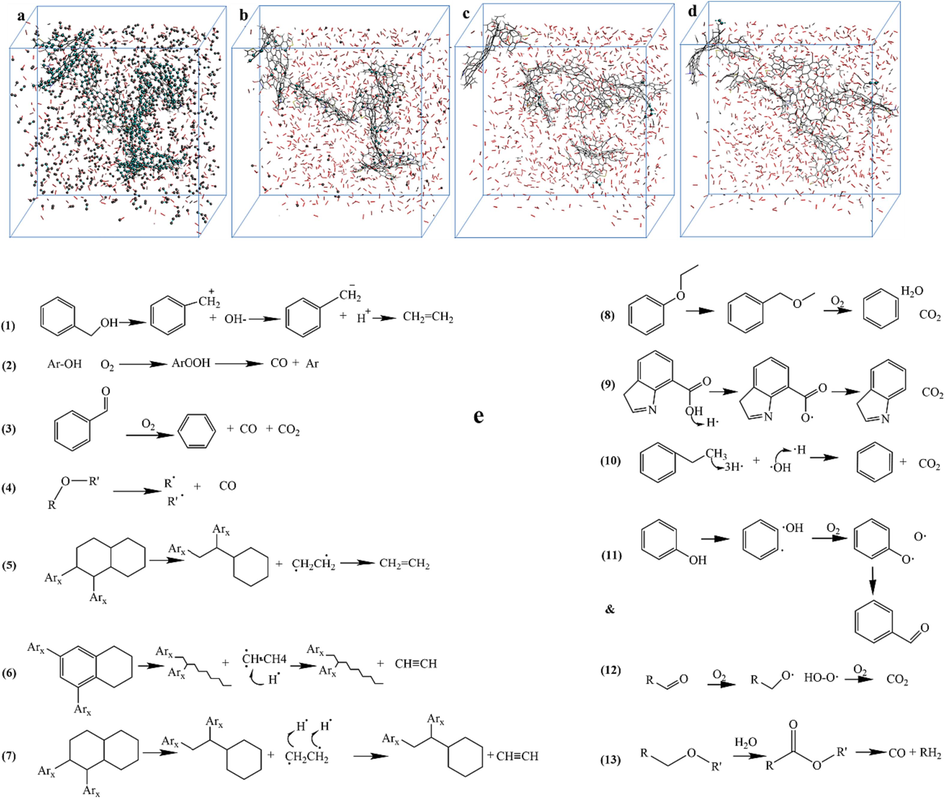
Positions and reaction pathways of indicator gas molecules generated from KN coal.
The main generation pathways of CO2 include:
(1) The C–H bond in the aldehyde is first broken to generate an aldehyde free radical, which then reacts with the oxygen molecule in the air to form an oxidized intermediate product, and finally CO2 is generated through a series of reaction steps (including generation of ketone intermediates). (2) The carbon-hydrogen bond (C–H bond) in the phenol is broken to form a phenol free radical or ion. The phenol free radical reacts with the oxygen molecule in the air to generate an aldehyde and water. The generated aldehyde continues to oxidize and eventually forms carbon dioxide. (3) Carboxyl generation of CO2 reaction process: the carboxyl group connected to the aromatic structure removes a hydrogen radical, and then detaches from the aromatic structure to form CO2. (4) Methoxy (CH3O•) reacts with oxygen to produce formaldehyde (CH2O) and a hydrogen peroxide free radical (HO2•). Formaldehyde (CH2O) is further oxidized to CO2 and H2O.
The main generation pathways of CO include:
(1) The hydrolysis reaction of esters generates carboxyl groups, followed by decarboxylation of carboxylic acids to generate CO. (2) Phenols undergo oxidative decarboxylation reactions to generate CO. (3) Carbonyl compounds generate CO by breaking the carbon–oxygen double bond in the carbonyl. (4) Ethers directly thermally decompose to generate carbon-centered free radicals and CO.
The main generation pathways of C2H4 include:
(1) In structures connected to other structures, the cyclic alkane structure opens the ring and loses two connected carbon-containing structures that are not connected to other structures, which directly form a double bond to form a C2H4 molecule. (2) Alcohols undergo dehydration to generate carbocations. The carbocations are deprotonated to generate carbanions. Two carbanions are coupled to generate ethylene.
The main generation pathways of C2H2 include:
(1) In cyclic alkane structures connected to other structures, two connected carbon-containing structures that are not connected to other structures are released after ring opening, and then each carbon atom loses a hydrogen radical to form a carbon–carbon triple bond and form C2H2. (2) In the structure where the benzene ring and cyclic alkane are connected, the cyclic alkane is broken, and the carbon atom on the cyclic alkane connecting the ethyl group is released along with the ethyl group. After the released part loses a methyl group as a whole, the remaining part forms a carbon–carbon triple bond to form a C2H2 molecule.
4 Conclusions
This study used experimental and computational simulation methods to characterize the oxidation characteristics and generation laws of indicator gases of Kunning coal from macroscopic and microscopic perspectives, and obtained the following main conclusions:
The ratio of bridging carbon to peripheral carbon XBP in the coal molecular structure is 0.08. The aromatic compounds in the KN coal sample consist mainly of benzene and naphthalene ring structures. Oxygen atoms exist in the form of carbonyl, hydroxyl and ether bonds, and nitrogen and sulfur atoms exist in the form of pyrrole and thiophene, respectively. The finally constructed single molecular structure formula of KN coal is C149H76O15N2S2.
The curve of oxygen volume fraction change over time obtained from the closed coal oxidation test follows an exponential decay distribution. The final steady-state value of oxygen volume fraction of KunNing coal sample is around 6 % at room temperature. As the test temperature increases, the oxygen consumption rate, CO release rate, CO2 release rate and oxidation heat release intensity of coal increase exponentially.
Molecular reaction dynamics simulations using the ReaxFF force field show that the yields of CO and CO2 are positively correlated with the number of oxygen molecules in the reaction system, while C2H2 and C2H4 are negatively correlated. CO2 mainly comes from aldehydes, phenols, carboxyls and methoxys in coal molecules, CO is mainly generated from esters, phenols, carbonyls, etc., C2H2 is mainly derived from the ring opening and breaking of cyclic alkanes, and C2H4 generation is mainly related to cyclic alkanes and alcohols.
CRediT authorship contribution statement
Dongjie Hu: Supervision, Funding acquisition. Zongxiang Li: Data curation. Yu Liu: Supervision. Lin Li: Data curation, Supervision.
Acknowledgments
The authors acknowledge the financial support from the National Natural Science Foundation of China (51774170).
References
- Molecular dynamic simulation of spontaneous combustion and pyrolysis of brown coal using Reax FF. Fuel. 2014;136:326-333.
- [Google Scholar]
- Experiment study of characteristic self-heating intensity of coal [J] Journal of China CoalSociety. 2005;30(5):81-84.
- [Google Scholar]
- Experimental study on low temperature oxidization of coal and its infrared spectrum analysis [J] China Safety Science Journal. 2008;18(1):171-177.
- [Google Scholar]
- Construction of macromolecular model and analysis of oxygen absorption characteristics of Hongyang No. 2 coal mine[J] Arab. J. Chem.. 2023;16(5):104662
- [Google Scholar]
- ReaxFF Molecular Dynamics Simulations of the Combustion Reactions of Pyrroleand Pyridine [J] Acta Petrolei Sinica (petroleum Processing Section). 2019;35(6):1130-1137.
- [Google Scholar]
- Research on Gas Chemical Generating Mechanismin the Process of Coal and Gas Outburst [D]. Liaoning Technical University; 2021.
- Pyrolysis simulations of Fugu coal by large-scale ReaxFF molecular dynamics[J] Fuel Process. Technol.. 2018;178:197-205.
- [Google Scholar]
- Structure of bituminous coals: evidence from distribution of hydrogen. Nature. 1959;184:980-981.
- [Google Scholar]
- Dynamic distribution and prevention of spontaneous combustion of coal in gob-side entry retaining goaf[J] PLoS One. 2022;17(5):e0267631
- [Google Scholar]
- Pyrolysis behaviors and product distribution of Shenmu coal at high heating rate: A study using TG-FTIR and Py-GC/MS. Energ. Conver. Manage.. 2019;179:72-80.
- [Google Scholar]
- Critical oxygen volume fraction of smothering quenched zone based on closed oxygen consumption experiment [J] J. China Coal Soc.. 2017;42(7):1776-1781.
- [Google Scholar]
- Effect of fault structure on the structure and oxidative spontaneous combustion characteristics of coal [J] J. China Coal Soc.. 2023;48(3):1246-1254.
- [Google Scholar]
- Development countermeasures and current situation of coal mine fire prevention & extinquishing in China. Coal Science and Technology.. 2016;44–6 1–6+13
- [Google Scholar]
- Study of the occurrence of sulfur in coal from Huainan-Huaibei areas and its migration characteristics in pyrolysis [D]. Anhui University of Technology; 2019.
- Y. Liu, F. S. Wang, X. M. Dong, D. Gao. Study on the Characteristics and Microscopic Mechanism of Coal Spontaneous Combustion Based on Programmed Heating Experiment [J/OL]. Coal Science and Technology:1-13.
- Adsorption and diffusion characteristics of CH4, CO2, and N2 in micropores and mesopores of bituminous coal: Molecular dynamics[J] Fuel. 2021;292:120268
- [Google Scholar]
- J. Q. Meng, R. Q. Zhong, S. C. Li, F. F. Yin, B, S, Nie. Molecular model construction and study of gas adsorption of Zhaozhuang coal. Energy & Fuels, 2018, 32(9): 9727-9737.
- A review of research on spontaneous combustion of coal. Int. J. Min. Sci. Technol.. 2020;30–3:303-311.
- [Google Scholar]
- Quantum chemical perspective of coal molecular modeling: A review [J] Fuel. 2020;279:118539
- [Google Scholar]
- Visualization of complex hydrocarbon reaction systems. Preprints of Papers American Chemical Society Division of Fuel Chemistry. 1996;41(6):418.
- [Google Scholar]
- Carbon-13 solid-state NMR of Argonne-premium coals [J] Energy Fuel. 1989;3(2):187-193.
- [Google Scholar]
- Structure of green river oil shale kerogen: Determination using solid state 13C NMR Spectroscopy. Fuel. 1986;65(4):541-546.
- [Google Scholar]
- Conversion of bituminous coal to liquids and gases: chemistry and representative processes. Magnetic Resonance. Netherlands: Springer; 1984.
- Investigation of nitrogen functionality in Yibin coal and its change laws. Journal of xi’an Jiaotong University. 2003;37(7):759-763.
- [Google Scholar]
- Kinetics of oxidation and spontaneous combustion of major super-thick coal seam in Eastern Junggar Coalfield, Xinjiang, China. J. Loss Prev. Process Ind.. 2018;56:128-136.
- [Google Scholar]
- Preliminary understanding of initial reaction process for subbituminous coal pyrolysis with molecular dynamics simulation [J] Fuel. 2014;134:283-292.
- [Google Scholar]
- Generation and Adsorption Mechanism of Coal Spontaneous Combustion Index Gases and Goaf Dangerous Zones Classification Division [D]. Liaoning Technical University; 2022.
- Combined Monte Carlo and molecular dynamics simulation of methane adsorption on dry and moist coal[J] Fuel. 2014;122:186-197.
- [Google Scholar]
- Study on catastrophe characteristics of coal spontaneous combustion. China Safety Science Journal.. 2015;25–1:78-84.
- [Google Scholar]
- Initial chemical reaction simulation of coal pyrolysis via ReaxFF molecular dynamics[J] Energy Fuel. 2013;27(6):2942-2951.
- [Google Scholar]
- Study on occurrence mode of sulfur and nitrogen in coal in China [J] Clean Coal Technology. 2008;53(1):73-77.
- [Google Scholar]


