

Translate this page into:
Contrasting the validation parameters and greenness of normal-phase and reverse-phase stability-indicating HPTLC methods for lemborexant analysis
⁎Corresponding authors. sshehri@um.edu.sa (Sultan Alshehri), prawez_pharma@yahoo.com (Prawez Alam)
-
Received: ,
Accepted: ,
This article was originally published by Elsevier and was migrated to Scientific Scholar after the change of Publisher.
Abstract
There are very limited analytical procedures to determine lemborexant (LMB) in dosage forms and biological materials. However, the literature does not provide any “high-performance thin-layer chromatographic (HPTLC)” assays to determine LMB. In an effort to analyze LMB in commercial pharmaceutical tablets more precisely, accurately, and sustainably than with the normal-phase-HPTLC (NP-HPTLC) approach, a sensitive and greener reverse-phase-HPTLC (RP-HPTLC) method was developed and validated. For NP-HPTLC, an acetone-petroleum ether (40:60 v/v) developing system was used. However, ethanol–water (85:15 v/v) was the developing system for RP-HPTLC. Four different techniques, including the National Environmental Method Index (NEMI), Analytical Eco-Scale (AES), ChlorTox, and Analytical GREENness (AGREE), were used to evaluate the greenness of both procedures. LMB measurement was linear in the 50–500 and 20–1000 ng/band ranges, respectively for NP and RP procedures. RP procedure was more robust (uncertainties = 0.90–0.95 %), accurate (recoveries = 98.24–101.57 %), precise (uncertainties = 0.87–1.00 %), linear (20–1000 ng/band), sensitive (LOD = 0.92 ng/band and LOQ = 2.76 ng/band), and greener over NP procedure. The results of greenness assessment using NEMI (all four circles green), AES (93), ChlorTox (0.88 g), and AGREE (0.89) demonstrated that the RP strategy was greener than NP strategy and all other reported HPLC methods. The fact that both techniques can assess LMB when its degradation products are present implies that they both have characteristics that point to stability-indicating features. 89.24 % and 98.79 %, respectively, were the assay results for LMB in pharmaceutical tablets when utilizing the NP and RP procedures. Based on all validation and greenness metrics, it was found that RP procedure was better than the NP procedure. As a result, it is possible to assess LMB in pharmaceutical products using RP procedure.
Keywords
Greener HPTLC
Greenness tools
Lemborexant
Validation

1 Introduction
The most prevalent sleep-wake disturbance, insomnia affects 30–50 % of adults worldwide (Chung et al., 2015). The most often prescribed drugs for treating insomnia are sedatives and hypnotics (Asnis et al., 2015). However, because of their well-known adverse effects, their use is currently restricted (Asnis et al., 2015; Sateia et al., 2017). It has recently been suggested that orexin-1 (OX1) and orexin-2 (OX2) receptors be used as a novel target to treat insomnia (Kumar et al., 2016). Lemborexant (LMB) is the second dual OX receptor antagonist that has been approved recently for the treatment of insomnia in adults (Scott, 2020). Compared to previous dual OX receptor antagonists, it exhibits fast association and dissociation from OX1 and OX2 receptors, allowing for quick and persistent sleep during the night without the risk of lingering effects or tiredness the next morning (Beuckmann et al., 2017). Because of its sedative and hypnotic properties, it is significant medicine from a forensic standpoint (Keks and Hope, 2022). It has been reported as a weak basic drug with pKa value of 3.5 (Ueno et al., 2021). In Fig. S1, the molecular structure of LMB is displayed. Due to its comparable abuse potential profile to that of zolpidem and suvorexant, LMB is classified as a Schedule IV controlled substance (Landry et al., 2022). The LMB evaluation, both qualitative and quantitative, is crucial for its commercial pharmaceutical products.
Literature showed very limited analytical procedures for the measurement of LMB in pharmaceutical products and biological materials. Tablet dosage forms and pure forms of LMB have been determined using few “high-performance liquid chromatographic (HPLC)” methods (Muralikrishna et al., 2020; Kamble et al., 2022). It has been discovered in the literature that a single LC-mass spectrometry (MS)/MS (LC-MS/MS) can be used to measure LMB in human plasma samples. This method was applied in an ex vivo protein binding research (Mano et al., 2020). A single ultra-performance LC-MS/MS (UPLC-MS/MS) method has also been found in the literature to determine LMB in human plasma samples, which was applied to pharmacokinetic studies in rats (Iqbal et al., 2023). Recently, we reported a “high-performance thin-layer chromatographic (HPTLC)” method for the determination of a similar class of drug, suvorexant in human urine samples (Alqarni et al., 2023). Till date, no reports of the of LMB measurement as a single analyte in pharmaceutical products and biological materials been made using HPTLC methods. In addition, the proposed reverse-phase HPTLC (RP-HPTLC) method is greener compared to reported analytical methods, which is an advantage of this method from the separation science viewpoint.
One of the 12 criteria of “green analytical chemistry (GAC)” is the use of ecologically acceptable solvent replacements to lessen the harmful effects of toxic or hazardous eluents on the ecosystem (Galuszka et al., 2013). A literature search revealed that the use of greener solvents has grown dramatically during the last few decades (Abdelrahman et al., 2020; Alam et al., 2020; Mohamed et al., 2023; Tantawy et al., 2023; Ahmed et al., 2024; Suthar and Desai, 2024). Numerous qualitative and quantitative techniques for assessing the greenness profiles of analytical processes are described in the literature, which includes the “National Environmental Method Index (NEMI) (Keith et al., 2005), the Environmental Assessment Tool (EAT) (Gaber et al., 2011), the Analytical Method Volume Intensity (AMVI) (Hartman et al., 2011), the Analytical Eco-Scale (AES) (Galuszka et al., 2012), the Green Analytical Procedure Index (GAPI) (Plotka-Wasylka, 2018), the Analytical Method GREEnness Score (AMGS) (Hicks et al., 2019), the Red, Green, and Blue (RGB) (Nowak and Koscielnaik, 2019), the Analytical GREEnness (AGREE) (Pena-Pereira et al., 2020), and ChlorTox (Nowak et al., 2023)”. The present investigation employed four discrete tools, specifically NEMI (Keith et al., 2005), AES (Galuszka et al., 2012), ChlorTox (Nowak et al., 2023), and AGREE (Pena-Pereira et al., 2020), to assess the greener profile of the current approaches. In order to determine LMB in marketed pharmaceutical tablets, the current strategy aimed to develop, validate, and compare a stability-indicating RP-HPTLC method that would be more robust, accurate, sensitive, and environmentally friendly than the stability-indicating normal-phase-HPTLC (NP-HPTLC) procedure. Following “The International Council for Harmonization (ICH)” Q2-R2 procedures, both procedures for LMB analysis were validated (ICH, 2023).
2 Materials and methods
2.1 Materials
“Beijing Mesochem Technology (Beijing, China)” provided pure LMB (purity: 99 % by HPLC). “E-Merck (Darmstadt, Germany)” provided the HPLC grades ethanol (EtOH) and acetone (Ace). The ACS grade of petroleum ether (PE) was obtained from “Sigma Aldrich (St. Louis, MO, USA)”. The “Milli-Q device (Lyon, France)” was used to obtain the water (H2O) of HPLC-grade. Commercial pharmaceutical tablets of LMB, each containing 10 mg of LMB, were purchased at a Mumbai, Indian pharmacy. The glass-coated 60 NP-18F254S and 60 RP-18F254S plates (plate size: 10 × 20 cm) pre-coated with silica gel (particle size: 5 μm) were obtained from “E-Merck (Darmstadt, Germany)”. The remaining materials were of AR grade.
2.2 Instrumentation and analytical settings
The “HPTLC system (Muttenz, Switzerland)” was used to analyze LMB in marketed pharmaceutical tablets. The solutions were applied in the form of 6 mm bands utilizing an “Automatic TLC Sampler 4 (ATS4) Sample Applicator (CAMAG, Geneva, Switzerland)”. The sample applicator was loaded to the “Microliter Syringe (Hamilton, Bonaduz, Switzerland)”. 150 nL/s was used as the application rate for LMB measurement. The glass-coated plates were developed using a linear ascending mode at a distance of 8 cm in an “automated developing chamber 2 (ADC2) (CAMAG, Muttenz, Switzerland)”. The development chamber was filled with the vapors of the corresponding developing system for 30 min at 22 °C. Under densitometry mode, LMB was detected at a wavelength of 199 nm using a UV detector. The slit size and scan speed were set to 4 × 0.45 mm2 and 20 mm/s, respectively. For every measurement, there were three or six replicates used. The software that was utilized was “WinCAT's (version 1.4.3.6336, CAMAG, Muttenz, Switzerland)”.
Both procedures employed same equipment and analytical conditions. The developing systems and stationary phases were the primary differences between the NP and RP procedures. In the NP procedure, the optimal developing system was Ace/PE (40:60 v/v), while in the RP procedure, the optimal developing system was EtOH/H2O (85:15 v/v). The stationary phase was “glass-coated plates (plate size: 10 x 20 cm) pre-coated with silica gel (particle size: 5 μm) 60 NP-18F254S plates” in NP procedure. The stationary phase was “glass-coated plates (plate size: 10 x 20 cm) pre-coated with silica gel (particle size: 5 μm) 60 RP-18F254S plates” in RP procedure.
2.3 LMB calibration curves
The precisely measured 10 mg of LMB was dissolved into 100 mL volumes of Ace/PE (40:60 v/v) for NP procedure and EtOH/H2O (85:15 v/v) for RP procedure to form a stock solution with a concentration of 100 μg/mL of LMB (working standards for NP and RP procedures). For the NP procedure, LMB concentrations in the range of 50–500 ng/band were further produced by diluting the variable amount of LMB stock solution with Ace/PE (40:60 v/v). Conversely, the RP procedure was used to produce LMB concentrations in the 20–1000 ng/band range. This involved dilution of the different LMB stock solution volumes using EtOH/H2O (85:15 v/v) (ICH, 2023). 10 μL of each LMB concentration were added to NP- and RP-TLC plates, respectively, for the NP and RP processes. For each LMB concentration, the peak response was determined using both techniques. LMB calibration curves were created by plotting the measured spot area vs. the LMB concentrations using six replicates (n = 6).
2.4 Sample preparation for the measurement of LMB in commercial tablets
Twenty-five tablets containing 10 mg of LMB each were randomly ingested in order to measure the amount of LMB in commercial tablets. Next, the average weight was calculated. The fine powder was obtained by crushing and triturating the tablets. The fine powder, containing a total of 10 mg of LMB, was dispersed using 10 mL of the corresponding developing system. The resultant mixes were sonicated for 15 min and filtered via 0.45 μm membrane filter (Foudah et al., 2021). The obtained solution was diluted using the respective developing system to obtain the solution in the LMB concentration of 300 ng/band for both procedures. The 10 μL samples from both solutions were injected for the determination of LMB in commercial tablets using both procedures.
2.5 Validation assessment
Both LMB measurement techniques were validated for multiple validation criteria in accordance with ICH-Q2-R2 guidelines (ICH, 2023). By plotting the recorded peak response against the LMB concentrations, LMB linearity was evaluated. Six repetitions (n = 6) were run separately to evaluate the linearity of the NP procedure of LMB analysis in the 50–500 ng/band range. Six replicates (n = 6) of the RP procedure were run separately to evaluate the LMB linearity over the 20–1000 ng/band range.
The “retardation factor (Rf), asymmetry factor (As), and number of theoretical plates per meter (N/m)” were computed to determine the parameters for the system appropriateness for both LMB measurement methods. Using their published formulae (Bele and Khale, 2011; Malinowska et al., 2013), the “Rf, As, and N/m” for both LMB measurement procedures were computed.
The accuracy of the two LMB measuring techniques was calculated utilizing spiking technology/standard addition strategy, expressed as % recoveries (ICH, 2023). For the NP procedure, additional 50, 100, and 150 % LMB solution was spiked into the pre-analyzed LMB solution (100 ng/band) to achieve low-quality control (LQC) levels of 150 ng/band, middle-quality control (MQC) levels of 200 ng/band, and high-quality control (HQC) levels of 250 ng/band of LMB. To attain LQC, MQC, and HQC levels of 300 ng/band, 400 ng/band, and 500 ng/band of LMB by the RP procedure, additional 50, 100, and 150 % LMB solution was mixed with the 200 ng/band pre-analyzed LMB solution. The pre-analyzed solution of LMB (100 ng/band) was first prepared freshly. Then, spiking was performed. The total volume after spiking was 1.0 mL for each QC sample. An investigation was conducted on three distinct LMB QC solutions in order to evaluate the accuracy of both approaches. For both approaches, six replications (n = 6) were run separately to calculate the % recovery at every level of QC.
The intra- and inter-assay precision for LMB of the NP- and RP-HPTLC techniques was evaluated. Using six replicates of freshly made LMB solutions at LQC, MQC, and HQC on the same day for both procedures (n = 6), the intra-assay precision for LMB was assessed. Using six replicates (n = 6) of newly generated LMB solutions at the same QC samples spaced out over three days, LMB inter-day precision was evaluated for each strategy.
A number of deliberate modifications can be made to the relevant developing system's content in order to evaluate the robustness of LMB for both approaches. The standard Ace/PE (40:60 v/v) developing system for LMB was changed to Ace/PE (42:58 v/v) and Ace/PE (38:62 v/v) for the NP-HPTLC experiment. Six replications (n = 6) were run separately to record the variations in peak response and Rf. The developing system EtOH/H2O (85:15 v/v) for the RP-HPTLC method was changed to EtOH/H2O (87:13 v/v) and EtOH/H2O (83:17 v/v), and six replications (n = 6) were used to record the uncertainties in spot area and Rf (ICH, 2023).
Using a standard deviation methodology, the sensitivity of both techniques for LMB was assessed in terms of “limit of detection (LOD) and limit of quantification (LOQ)”. A blank sample (one devoid of LMB) was injected six times for each of the two methods, and the sample's standard deviation was computed. The published equations for both approaches were utilized to calculate LMB “LOD and LOQ” through six replications (n = 6) (ICH, 2023).
The Rf values, UV-absorption spectra, and 3D spectrum of LMB in commercially available pharmaceutical tablets were compared to that of pure LMB in order to assess the specificity and peak purity of both procedures for LMB (ICH, 2023).
2.6 Forced-degradation investigations
Under acidic, alkaline, oxidative, and thermal stress conditions, the forced-degradation investigations were carried out for both approaches (Alam et al., 2021b; Foudah et al., 2021). LMB is not a photosensitive drug and hence photostability study was not performed in this work. The LMB in the concentration of 400 ng/band for both techniques was subjected to 24 h of thermal stress conditions in a hot air oven at 55 °C, 1 M HCl (acid), 1 M NaOH (alkaline), and 30 % v/v H2O2 (oxidative). The acid and base stress solutions were not neutralized before chromatographic developments. The solutions were diluted with corresponding developing systems. For these investigations, the comprehensive protocols as described in our most recent article (Foudah et al., 2021) were adhered to. Under the previously stated stress conditions, LMB chromatograms were acquired for both approaches and examined for degradation products.
2.7 Application of NP- and RP-HPTLC methods in the measurement of LMB in commercial tablets
NP and RP techniques were used to capture the peak responses for LMB in three replicates (n = 3) using commercial tablet solutions on NP- and RP-TLC plates, respectively. The LMB calibration plot for both procedures was used to calculate the LMB content of the commercial tablet.
2.8 Greenness assessment
Four different methodologies were used to analyze the greenness profile of both LMB determination techniques: NEMI (Keith et al., 2005), AES (Galuszka et al., 2012), ChlorTox (Nowak et al., 2023), and AGREE (Pena-Pereira et al., 2020). To obtain the initial evaluation based on persistent, bioaccumulative, and toxic (PBT), hazardous, corrosive, and waste materials, NEMI is employed (Keith et al., 2005). AES is a semi-quantitative method that takes into account all of the analytical steps, waste, and tools. A perfect analysis with 100 points is anticipated for the solvents/reagents that need little to no reagent use, low energy, and no waste. If any of these requirements are not fulfilled, penalty points are given and subtracted from the final score of 100 (Galuszka et al., 2012). The ChlorTox scale is determined using equation (1) (Nowak et al., 2023) in accordance with the ChlorTox scale technique.
where CHCHCl3 is the chemical hazard of standard CHCl3, CHsub is the chemical risks of the substance of interest, and msub is the mass of the substance of interest required for a single analysis. The safety data sheet from “Sigma Aldrich (St. Louis, MO, USA)” was utilized to help with the weighted hazards number (WHN) model computation of the values of CHsub and CHCHCl3 (Nowak et al., 2023). The AGREE-metric technique was used to create the AGREE scale for both approaches to the LMB analysis (Pena-Pereira et al., 2020). The “AGREE: The Analytical Greenness Calculator (version 0.5, Gdansk University of Technology, Gdansk, Poland, 2020)” was used to calculate the AGREE scales for both approaches. The values, which were determined by 12 distinct GAC principles, varied from 0.0 to 1.0.
3 Results and discussion
3.1 Method development and optimization
Table 1 shows a summary of the different developing systems and measured chromatographi responses for each technique. Chamber saturation conditions were utilized in the development of the TLC plates for both procedures and representative TLC images are presented in Fig. 1.
NP-HPTLC
Developing system
As
N/m
Rf
Ace/PE (40:60 v/v)
1.10 ± 0.04
4517 ± 4.41
0.44 ± 0.01
Ace/PE (50:50 v/v)
1.17 ± 0.06
3452 ± 4.11
0.46 ± 0.02
Ace/PE (60:40 v/v)
1.23 ± 0.07
2313 ± 3.52
0.49 ± 0.03
Ace/PE (70:30 v/v)
1.31 ± 0.09
1831 ± 2.13
0.52 ± 0.04
Ace/PE (80:20 v/v)
1.36 ± 0.10
1415 ± 1.92
0.53 ± 0.05
Ace/PE (90:10 v/v)
1.42 ± 0.12
1283 ± 1.84
0.56 ± 0.06
RP-HPTLC
EtOH/H2O (35:65 v/v)
1.33 ± 0.06
1718 ± 1.82
0.81 ± 0.06
EtOH/H2O (45:55 v/v)
1.30 ± 0.05
1912 ± 1.93
0.79 ± 0.05
EtOH/H2O (55:45 v/v)
1.26 ± 0.04
2264 ± 2.11
0.77 ± 0.04
EtOH/H2O (65:35 v/v)
1.23 ± 0.03
2514 ± 2.81
0.75 ± 0.04
EtOH/H2O (75:25 v/v)
1.20 ± 0.02
3242 ± 3.52
0.73 ± 0.03
EtOH/H2O (85:15 v/v)
1.04 ± 0.02
5164 ± 4.21
0.69 ± 0.02
EtOH/H2O (95:5 v/v)
1.12 ± 0.06
4145 ± 3.84
0.71 ± 0.03
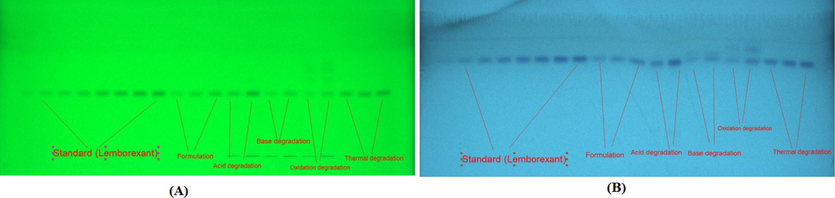
The representative TLC images for standard lemborexant (LMB), marketed tablets, and forced-degradation samples derived using (A) NP- and (B) RP-HPTLC techniques.
As the developing systems for the LMB analysis by the NP procedure, a variety of Ace/PE combinations between 40 and 90 % Ace were investigated. Table 1 shows the combinations of various developing systems and measured chromatographic responses. The developing system Ace/PE (40:60 v/v) produced a well-eluted and sharp chromatographic signal for LMB at Rf = 0.44 ± 0.01 (Fig. 2A), according to the results. However, there was some fronting in LMB peak, which could be possible due to the poor sample solubility. Furthermore, it was observed that the As value of 1.10 ± 0.04 for LMB is suitable for LMB assessment. As a result, Ace/PE (40:60 v/v) was selected as the optimal developing system for the NP-HPTLC method's LMB assessment.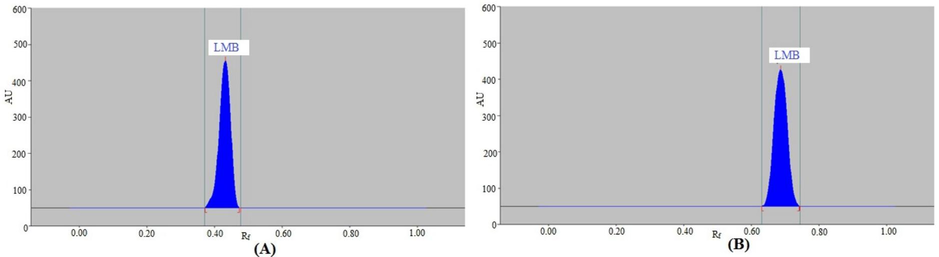
Representative spectrodensitograms of standard LMB obtained by (A) NP- and (B) RP-HPTLC methods.
As the developing systems for the LMB analysis by the RP procedure, a variety of EtOH/H2O combinations between 35 and 95 % EtOH were investigated. Table 1 summarizes the combinations of the RP-HPTLC method's several chromatographic parameters and developing systems. The results showed that an intact and well-resolved LMB chromatographic signal at Rf = 0.69 ± 0.02 was obtained with the EtOH/H2O (85:15 v/v) mixture (Fig. 2B). Additionally, there was no fronting in LMB peak, which could be possible due to the excellent sample solubility. Furthermore, a projection of 1.04 ± 0.02 for LMB's As value was made, which was reliable for LMB assessment. Because of this, the EtOH/H2O (85:15 v/v) was selected as the optimal greener developing system for the LMB assessment using the RP-HPTLC method. When spectrodensitometry mode was used to evaluate the LMB spectral bands in the range of 190–400 nm, the maximum TLC response was observed at 199 nm. Thus, the whole LMB analysis was performed at 199 nm.
3.2 Validation studies
The ICH-Q2-R2 procedures were utilized to calculate the different LMB validation parameters (ICH, 2023). Table 2 displays the statistical data for the linear regression analysis of LMB calibration plots performed with both techniques. Between 50 and 500 ng/band, the LMB calibration curve for the NP method was linear. The linearity for NP procedure was not maintained beyond the 500 ng/band concentration. However, between 20 and 1000 ng/band, the LMB calibration curve for the RP process was linear. Therefore, different calibration ranges for NP and RP procedures were based on the linearity results. The correlation coefficient (R) and coefficient of determination (R2) for LMB were 0.9987 and 0.9976 for the NP-HPTLC procedure, respectively. For the RP-HPTLC procedure, LMB's R2 and R were, respectively, 0.9979 and 0.9989. In addition, the standard deviations and standard error values of slope and calibration curves were also too low compared to their mean values for both methods. These findings showed a robust correlation between the LMB concentrations and the measured peak areas. These results all showed that the two LMB measurement techniques were linear. However, the RP procedure was more linear than the NP procedure.
Parameters
NP-HPTLC
RP-HPTLC
Linear range (ng/band)
50–500
20–1000
Regression equation
y = 16.638x + 487.14
y = 16.766x + 934.90
R2
0.9976
0.9979
R
0.9987
0.9989
Intercept ± SD
487.14 ± 8.93
934.90 ± 4.68
Slope ± SD
16.638 ± 2.59
16.766 ± 1.05
Standard error of slope
1.05
0.42
Standard error of intercept
3.64
1.91
95 % confidence interval of slope
15.08–24.18
14.92–18.61
95 % confidence interval of intercept
471.44–502.83
926.67–943.12
LOD ± SD (ng/band)
1.50 ± 0.12
0.92 ± 0.03
LOQ ± SD (ng/band)
4.50 ± 0.36
2.76 ± 0.09
Table 1 shows a results of the system suitability parameters for each technique. For the NP procedure, the “Rf, As, and N/m” for LMB analysis were found to be 0.44 ± 0.01, 1.10 ± 0.04, and 4517 ± 4.41, respectively. However, for the RP procedure, the “Rf, As, and N/m” for LMB analysis were measured to be 0.69 ± 0.02, 1.04 ± 0.02, and 5164 ± 4.21, respectively. The recorded system suitability parameters for both methods were reliable and acceptable for LMB analysis.
Both LMB measurement procedures were evaluated for accuracy in terms of % recovery. Table S1 indicates the accuracy measurement results for both procedures. For the NP-HPTLC procedure, the recoveries of LMB at three distinct QC samples were found to be 96.34–103.72 %. Using the RP-HPTLC procedure, the recoveries of LMB at three distinct QC samples were examined and found to be 98.24–101.57 %. These outcomes demonstrated the accuracy of both methods for assessing LMB. On the other hand, when it came to quantifying LMB, the RP-HPTLC method outperformed the NP-HPTLC method.
The data are given as a percentage of the coefficient of variation (%CV), and the LMB was determined by evaluating the intra- and inter-assay precision of both procedures. Table S2 displays the intra-assay and inter-assay precisions for the two LMB measurement methods. The intra-assay CVs of LMB for NP procedure varied from 2.53 to 3.05 %. The NP procedure's LMB inter-assay CVs varied from 2.64 to 3.17 %. The intra-assay CVs of LMB for RP procedure varied from 0.90 to 0.95 %. The range of the LMB CVs for inter-assay in RP procedure was 0.87 to 1.00 %. These measurements demonstrated the precision of both LMB measurement procedures. For measuring LMB, however, the RP procedure proved more precise than NP procedure.
In order to evaluate the robustness of both LMB measurement procedures, intentional planned modifications were made to the developing systems. Table S3 displays the results of the robustness evaluation for both procedures. The CVs for LMB using the NP-HPTLC technique were 2.98–3.24 %. The LMB Rf values for the NP-HPTLC technique were found to be 0.42–0.46. The LMB CVs for the RP-HPTLC procedure varied from 0.90 to 0.95 %. The RP-procedure's LMB Rf values were found to range from 0.68 to 0.70. These measurements demonstrated the robustness of both procedures for LMB measurement. In terms of LMB measurements, however, the RP-HPTLC procedure fared better than the NP-HPTLC procedure.
Both LMB measurement methods' sensitivity was assessed in terms of “LOD and LOQ”. Table 2 lists the calculated values of “LOD and LOQ” for LMB for both procedures. The “LOD and LOQ” for LMB for NP procedure were calculated to be 1.50 ± 0.12 and 4.50 ± 0.36 ng/band, respectively. The “LOD and LOQ” for LMB for RP procedure were computed to be 0.92 ± 0.03 and 2.76 ± 0.09 ng/band, respectively. These results demonstrated that both procedures were highly-sensitive for LMB assessment. However, compared to NP procedure, the RP procedure was more sensitive in measuring LMB.
By contrasting the Rf values, superimposed UV spectrum, and 3D spectrum of LMB in marketed pharmaceutical tablets with those of pure LMB, we were able to evaluate the specificity and peak purity of the proposed method for LMB assessment. The superimposed UV spectrum of marketed pharmaceutical tablets' LMB and pure LMB are shown in Fig. 3. Fig. S2 indicates the 3D spectrum of marketed pharmaceutical tablets and pure LMB. By contrasting the spectrum at the peak start (S), peak apex (M), and peak end (E) positions of the spot, the peak purities of standard LMB and LMB in marketed pharmaceutical tablets were evaluated (El-Kimary et al., 2014; El-Kimary and Ragab, 2015). Standard LMB and marketed pharmaceutical tablets' computed values of r (S,M) and r (M,E) were found to be more than 0.99, demonstrating the homogeneity of the peaks (El-Kimary et al., 2018; Shakeel et al., 2024). The maximum chromatographic response was observed for LMB in standard and commercial tablets at a wavelength of 199 nm. The usage of the same UV spectrum, 3D spectrum, Rf data, and wavelengths found in standard and marketed pharmaceutical tablets demonstrated the specificity of the current methods for LMB measurement. Based on these results, a simple spectrophotometric technique can also be used for the measurement of LMB with no overlap from any matrix components. However, simple spectrophotometric techniques are not enough sensitive compared to separations techniques such as HPTLC and HPLC. Therefore, the separation technique, HPTLC was used for LMB analysis in this study.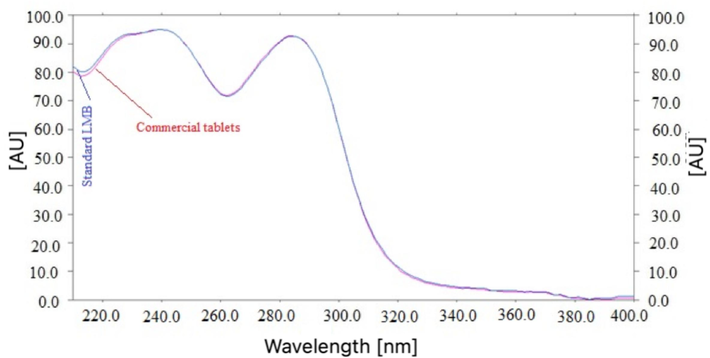
UV spectrum of standard LMB and marketed tablets, superimposed.
3.3 Comparison of current HPTLC method’s validation parameters with reported HPLC techniques
Various validation parameters, including linear range, accuracy, precision, LOD, and LOQ, were compared between the present HPTLC methods and reported HPLC techniques for the analysis of LMB. Table 3 includes the comparison evaluation results. Two reported HPLC techniques have been shown to have linear ranges of 2–12 µg/mL (Muralikrishna et al., 2020) and 10–70 µg/mL (Kamble et al., 2022), respectively. The linear ranges of present NP- and RP-HPTLC approaches were determined to be 50–500 and 20–1000 ng/band, respectively. It has been determined that the present RP-HPTLC approach of LMB analysis is superior to both reported HPLC techniques and present NP-HPTLC method (Muralikrishna et al., 2020; Kamble et al., 2022). Both reported HPLC techniques from the literature were found to have accuracy (100 ± 2 %) and precision (<2 %) levels within the ICH-Q2-R2 guidelines' suggested range, indicating a similarity to the current RP-HPTLC approach (Muralikrishna et al., 2020; Kamble et al., 2022). However, the accuracy and precision of present NP-HPTLC approach was deviated from the prescribed limit of ICH-Q2-R2 guidelines, and hence found to be inferior to the present RP-HPTLC and reported HPLC techniques of LMB analysis (Muralikrishna et al., 2020; Kamble et al., 2022). According to reports, the LOD for two reported HPLC techniques is 0.27 µg/mL (Muralikrishna et al., 2020) and 0.54 µg/mL (Kamble et al., 2022), respectively. Nonetheless, it has been discovered that the LOQ for two reported HPLC techniques is 0.67 µg/mL (Muralikrishna et al., 2020) and 1.60 µg/mL (Kamble et al., 2022), respectively. The present RP-HPTLC method's LOD (0.92 ng/band) and LOQ (2.76 ng/band) of LMB were much lower than reported HPLC techniques and present NP-HPTLC method (Muralikrishna et al., 2020; Kamble et al., 2022). Therefore, it is found that the current RP-HPLC method is significantly more sensitive than reported HPLC techniques. All things considered, it has been found that the present RP-HPTLC analytical strategy is more linear and highly-sensitive than reported HPLC techniques and present NP-HPTLC method (Muralikrishna et al., 2020; Kamble et al., 2022).
Method
Linear range
Accuracy (% recovery)
Precision (% CV)
LOD
LOQ
Ref.
HPLC
2–12 µg/mL
99.55
0.36
0.27 µg/mL
0.67 µg/mL
(Muralikrishna et al., 2020)
HPLC
10–70
100.71
1.38
0.54 (µg/mL)
1.60 µg/mL
(Kamble et al., 2022)
HPTLC
50–500 ng/band
96.34–103.72
2.53–3.17
1.50 ng/band
4.50 ng/band
Present NP-HPTLC
HPTLC
20–1000 ng/band
98.24–101.57
0.90–1.00
0.92 ng/band
2.76 ng/band
Present RP-HPTLC
3.4 Forced-degradation evaluation
Under varied stress conditions, the forced-degradation of the NP and RP procedures was evaluated. Fig. 4 and Table 4 present the results obtained from the NP-HPTLC procedure. At different stress settings, the LMB peak was clearly separated (Fig. 4). Under the conditions of acid degradation (Fig. 4A), base degradation (Fig. 4B), and thermal degradation (Fig. 4D), LMB was maintained at 100.00 %, and no signs of LMB degradation were found. Consequently, in conditions of acid, base, and thermal breakdown, LMB was highly stable. Under the conditions of oxidative degradation (Fig. 4C), 62.53 % of LMB was degraded and 37.47 % was remained intact. Consequently, in conditions of oxidative degradation, LMB was highly unstable. The compounds detected under oxidative degradation (peaks 2, 3, and 4 in Fig. 4C) showed separation at Rf = 0.54, 0.60, and 0.73, in that order. During acid, base, oxidative, and thermal-degradation settings, the LMB Rf value was remained constant (Rf = 0.44).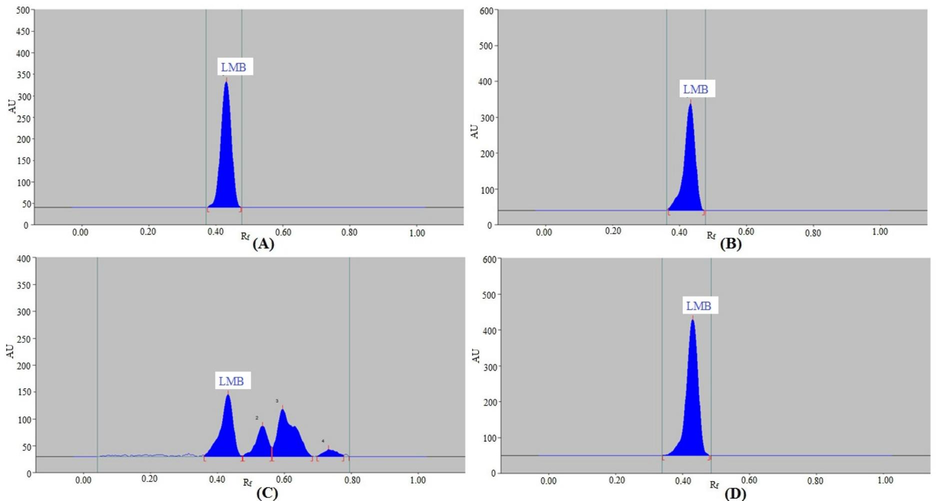
Chromatograms of LMB recorded under (A) acid, (B) base, (C) oxidative, and (D) thermal degradations of LMB by NP-HPTLC method.
Degradation setting
Degradation products (Rf)
LMB Rf
LMB remained (ng/band)
LMB recovered (%)
1 M HCl
0
0.44
400.00
100.00 ± 0.00
1 M NaOH
0
0.44
400.00
100.00 ± 0.00
30 % H2O2
3 (0.54, 0.60, 0.73)
0.44
149.88
37.47 ± 1.34
Thermal
0
0.44
400.00
100.00 ± 0.00
Table 5 and Fig. 5 indicate the results of the RP-HPTLC procedure. At various stress levels, the LMB peak exhibited good separation as well (Fig. 5). Under the conditions of acid degradation (Fig. 5A), base degradation (Fig. 5B), and thermal degradation (Fig. 5D), LMB was maintained at 100.00 %, and no signs of LMB degradation were found. Consequently, in conditions of acid, base, and thermal breakdown, LMB was highly stable. During acid, base, and thermal-degradation settings, the LMB Rf value was remained constant (Rf = 0.69). 50.39 % of the LMB had degraded after the application of oxidative stress, leaving 49.61 % of it intact (Table 5 and Fig. 5C). The LMB Rf value was slightly shifted (Rf = 0.68) during the oxidative-degradation settings. At Rf = 0.76 and 0.82, respectively, the oxidative-degradation compounds (peaks 2 and 3 in Fig. 5C) were separated. Consequently, in conditions of oxidative breakdown, LMB was extremely unstable. Both procedures were used to record the highest decomposition of LMB during oxidative-degradation settings. The purpose of present method development was to established stability-indicating HPTLC methods for the determination of LMB. Stability-indicating methods are those methods which are able to detect the target drug in the presence of its degradation products and hence can be applicable to stability evaluation of the target drug. The identification of degradation products was beyond the scope of the present work. Therefore, the identification of degradation products was not performed in this work. These findings showed that in the presence of its breakdown products, LMB might be detected by both NP- and RP-HPTLC techniques. The stability-indicating characteristics of both processes were indicated by these results. Both approaches were stability-indicating for LMB detection.
Degradation setting
Degradation products (Rf)
LMB Rf
LMB remained (ng/band)
LMB recovered (%)
1 M HCl
0
0.69
400.00
100.00 ± 0.00
1 M NaOH
0
0.69
400.00
100.00 ± 0.00
30 % H2O2
2 (0.76, 0.82)
0.68
198.44
49.61 ± 2.18
Thermal
0
0.69
400.00
100.00 ± 0.00
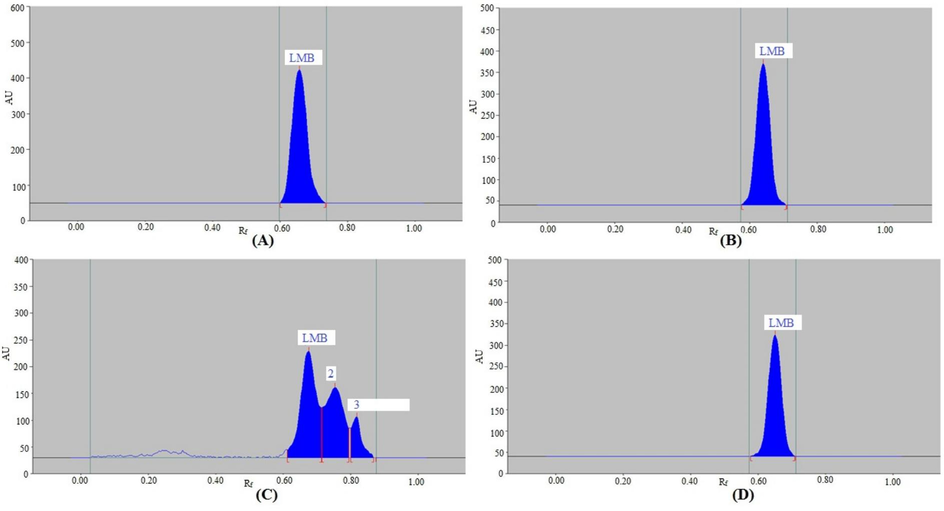
Chromatograms of LMB recorded under (A) acid, (B) base, (C) oxidative, and (D) thermal degradations of LMB by RP-HPTLC method.
3.5 Application of NP- and RP-HPTLC methods in LMB estimation in commercial tablets
The green HPTLC method has several advantages over traditional LC procedures: it uses less solvent, takes less time to analyze samples, is nondestructive, requires little preparation, easy to use, can analyze multiple samples at once, non-toxic, and environmentally friendly (Alam et al., 2020; Alam et al., 2021b; Foudah et al., 2021; Shakeel et al., 2024). In spite of several merits of HPTLC techniques, they offer some demerits such as lack of standardization and reproducibility, which could influence the accuracy and precision of the results (El-Kimary et al., 2018; Alqarni et al., 2023; Shakeel et al., 2024). Both procedures were applied in order to determine the LMB in marketed pharmaceutical tablets. The chromatogram of LMB from pharmaceutical tablets was assessed by using the NP-HPTLC method to compare the single TLC band at Rf = 0.44 ± 0.01 for LMB with standard LMB. The chromatographic peak of LMB in pharmaceutical tablets, as determined by the NP-HPTLC method, matched the peak of pure LMB. Using the RP-HPTLC technique, the single TLC band at Rf = 0.69 ± 0.02 for LMB was compared with standard LMB to analyze the chromatogram of pharmaceuticals tablets. Using the RP-HPTLC method, the chromatographic peak of LMB in pharmaceutical tablets was likewise comparable to that of pure LMB. Additionally, neither of the two procedures revealed any additional signals related to the tablet contents in the commercial tablets, suggesting that there was no interaction between LMB and the tablet ingredients. The amount of LMB in pharmaceutical tablets was established using the LMB calibration plot for both processes. Using the NP procedure, the amount of LMB in pharmaceutical tablets was found to be 89.24 ± 1.32 %. Using the RP procedure, the amount of LMB in pharmaceutical tablets was found to be 98.79 % ± 1.36 %. The amount of LMB in commercial tablets has been determined in the magnitude of 100 ± 2 % by Muralikrishna et al., (2020). However, the amount of LMB in commercial tablets was determined to be 96.59 ± 1.34 % by Kamble et al., (2022). Using the Student's t-test and the variance ratio F-test, the outcomes of the current LMB analysis methods in commercial tablets were compared with documented HPTLC techniques (Muralikrishna et al., 2020; Kamble et al., 2022). There were no discernible differences in the accuracy and precision of the examined methods, according to the acquired t and F values of the current RP-HPLC method and one of the reported HPLC procedures, which did not exceed their theoretical values (Muralikrishna et al., 2020). There were noticeable differences in the accuracy and precision of the compared methods, as evidenced by the obtained t and F values of the current RP-HPLC method, NP-HPLC method, and another reported HPLC approaches, which greatly exceeded their theoretical values (Kamble et al., 2020). These findings showed that the current RP-HPTLC method is better than the NP-HPTLC method and the HPLC method published by Kamble et al., (2022), and comparable to the HPLC method reported by Muralikrishna et al., (2020). These findings demonstrated that the RP procedure worked better than the NP procedure for the assessment of LMB.
3.6 Greenness evaluation
A number of greenness tools such as NEMI, EAT, AMVI, AES, GAPI, AMGS, RGB, AGREE, and ChlorTox can be used to assess the greenness of developed analytical procedures. The greenness tools have been used to determine the greenness of the wide range of analytical procedures such as HPLC, LC-MS, LC-MS/MS, UPLC-MS/MS, HPTLC etc. (Obaydo and Sakur, 2019; Alam et al., 2021a; Kannaiah et al., 2023a, 2023b; Saleh et al., 2024a, 2024b). In the current work, four different approaches—NEMI (Keith et al., 2005), AES (Galuszka et al., 2012), ChlorTox (Nowak et al., 2023), and AGREE (Pena-Pereira et al., 2020)—were used to assess the greenness of both procedures. The typical pictograms for the NEMI of both procedures are displayed in Fig. S3. Just two of the circles for the NP-HPTLC procedure were green (Fig. S3A). However, the RP-HPTLC procedure yields all four circles green (Fig. S3B), reflecting the method's greenness, because all of the chemicals used are neither toxic, PBT, or corrosive and produce little waste. The RP-HPTLC procedure fared better than the NP-HPTLC procedure based on the NEMI results.
The results of AES scales with penalty points for both procedures are displayed in Table 6. An AES rating of more than 75 suggested excellent greenness, a scale of less than 75 but more than 50 indicated appropriate greenness, and a scale of less than 50 indicated inadequate greenness (Galuszka et al., 2012). The AES scale for the NP-HPTLC procedure was found to be 65. On the other hand, the AES scale of the RP-HPTLC procedure was found to be 93. The RP-HPTLC procedure fared better than the NP-HPTLC procedure, according to the AES results. Additionally, we calculated the AES scales of two HPLC methods found in the literature and compared them to the NP- and RP-HPTLC procedures used currently for LMB assessment (Table 6). AES scales for two literature HPLC methods were derived to be 47 and 71, respectively (Muralikrishna et al., 2020; Kamble et al., 2022). Based on AES scales, it was found that both previously published HPLC methods for LMB determination were significantly inferior to the current RP-HPTLC procedure (Muralikrishna et al., 2020; Kamble et al., 2022). According to AES scales, one of the documented HPLC methods for LMB determination was judged to be better than the current NP-HPTLC procedure (Muralikrishna et al., 2020).
Reagents/instruments/waste
Penalty points
HPLC (Muralikrishna et al., 2020)
HPLC (Kamble et al., 2022)
Present NP-HPTLC
Present RP-HPTLC
EtOH
4
H2O
0
0
0
Ace
8
PE
24
Methanol
18
18
Acetonitrile
12
Triethylamine
6
18
Pentane sulfonic acid sodium monohydrate
0
Instruments
0
0
0
0
Waste
5
5
3
3
Total penalty points
29
53
35
7
AES scale
71
47
65
93
Table 7 displays the total ChlorTox and individual solvent ChlorTox scale results for both procedures in relation to reported HPLC methods. The current NP-HPTLC method's estimated total ChlorTox scale was 2.42 g, indicating that it was hazardous and unsafe (Nowak et al., 2023). On the other hand, the current RP-HPTLC method's computed total ChlorTox scale was 0.88 g, indicating that it was environmentally benign and safe (Nowak et al., 2023). Additionally, we calculated the ChlorTox scales for two literature HPLC methods and compared them to the NP- and RP-HPTLC methods used currently for LMB assessment (Table 7). It was found that the ChlorTox scales for two literature HPLC methods were 1.78 g and 5.81 g, respectively (Muralikrishna et al., 2020; Kamble et al., 2022). Based on ChlorTox scales, it was inferred that both literature HPLC methods for LMB detection were significantly less effective than the present RP-HPTLC procedure (Muralikrishna et al., 2020; Kamble et al., 2022). On the basis of ChlorTox scales, one of the documented HPLC methods for LMB detection was discovered to be better than the current NP-HPTLC procedure (Muralikrishna et al., 2020).
Stage
Solvent/reagent
Relative hazard (CHsub/CHCHCl3)
msub (mg)
ChlorTox (g)
Total ChlorTox (g)
Ref.
Sample preparation
Ace
0.34
800
0.27
2.42
Present NP-HPTLC
PE
0.78
1200
0.94
HPTLC analysis
Ace
0.34
800
0.27
PE
0.78
1200
0.94
Sample preparation
EtOH
0.26
1700
0.44
0.88
Present RP-HPTLC
HPTLC analysis
EtOH
0.26
1700
0.44
Sample preparation
Methanol
0.56
317
0.18
1.78
(Muralikrishna et al., 2020)
HPLC analysis
Methanol
0.56
2851
1.60
Sample preparation
Methanol
0.56
475
0.27
5.81
(Kamble et al., 2022)
HPLC analysis
Triethylamine
0.78
5227
4.07
Acetonitrile
0.39
3773
1.47
The most popular quantitative approach for assessing greenness is the AGREE methodology (Pena-Pereira et al., 2020), which considers all 12 GAC criteria (Galuszka et al., 2013). The overall AGREE scale for both approaches is shown in Fig. 6. The total AGREE scale was predicted by the current NP-HPTLC approach to be 0.59 (Fig. 6A). Nonetheless, the total AGREE scale of 0.89 was estimated by the current RP-HPTLC procedure (Fig. 6B). The AGREE results once more showed that, in terms of the AGREE scale, the present RP-HPTLC procedure performed better than the NP-HPTLC procedure. The quantitative greenness parameters such as AES, ChlorTox, and AGREE for NP and RP procedures were compared using the Student’s t-test and the variance ratio F-test. There were noticeable differences between the compared approaches, as evidenced by the calculated t and F values of the RP and NP procedures, which greatly exceeded their theoretical values. These findings indicated that there was a statistically significant difference between the NP and RP procedures. Overall greenness approaches compared to literature HPLC methods show that the current RP-HPTLC procedure for LMB assessment in commercial tablets has an excellent greener profile.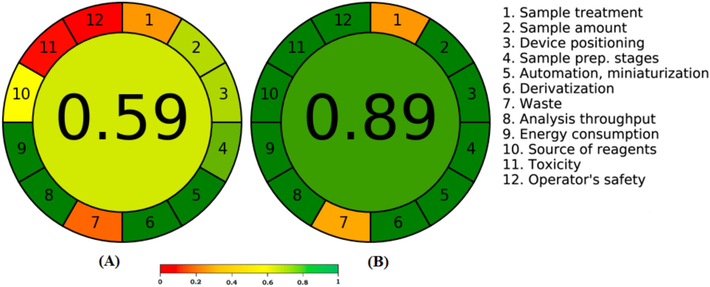
AGREE calculator-derived representative images for AGREE scales for (A) NP-HPTLC and (B) RP-HPTLC procedures.
4 Conclusions
The literature lacks stability-indicating HPTLC procedures for measuring LMB. As an alternative to the stability-indicating NP-HPTLC process, the goal of this work is to create and evaluate a sensitive and environmentally friendly stability-indicating RP-HPTLC procedure for LMB analysis in pharmaceutical tablets. In comparison to the NP-HPTLC approach, the RP-HPTLC method for measuring LMB is more linear, accurate, precise, robust, sensitive, and ecologically friendly. When employing the RP-HPTLC procedure, the LMB content was higher than with the NP-HPTLC procedure. Selectivity and stability-indicating traits were found in both techniques. The RP-HPTLC process fared better on the greenness scale than the NP-HPTLC procedure, according to the results of the NEMI, AES, ChlorTox, and AGREE evaluations. These findings demonstrated that the RP procedure performed better than the NP procedure for assessing LMB in pharmaceuticals tablets. Subsequent studies can test LMB in plasma samples and assess its pharmacokinetics using the proven HPTLC techniques.
CRediT authorship contribution statement
Tariq M. Aljarba: Data curation, Formal analysis, Methodology. Faiyaz Shakeel: Funding acquisition, Investigation, Methodology, Software, Validation, Writing – original draft. Sultan Alshehri: Data curation, Formal analysis, Validation, Writing – review & editing. Muzaffar Iqbal: Formal analysis, Validation, Writing – review & editing. Ahmed I. Foudah: Investigation, Methodology. Mohammed H. Alqarni: Data curation, Investigation, Methodology. Ali Alhaiti: Data curation, Validation, Writing – review & editing. Fatma M. Abdel Bar: Data curation, Validation, Writing – review & editing. Prawez Alam: Conceptualization, Funding acquisition, Investigation, Methodology, Project administration, Supervision.
Acknowledgments
“Authors are thankful to Researchers Supporting Project number (RSPD2024R1040), King Saud University, Riyadh, Saudi Arabia”. “The authors are also thankful to Prince Sattam bin Abdulaziz University for supporting this work via project number (PSAU/2024/R/1445)”. “Sultan Alshehri would like to express sincere gratitude to AlMaarefa University, Riyadh, Saudi Arabia, for supporting this research”.
Declaration of competing interest
The authors declare that they have no known competing financial interests or personal relationships that could have appeared to influence the work reported in this paper.
References
- Determination of the abused intravenously administered madness drops (tropicamide) by liquid chromatography in rat plasma; an application to pharmacokinetic study and greenness profile assessment. Microchem. J.. 2020;159:E105582.
- [Google Scholar]
- Tri-chromic sustainable tools of derivative/discrete Fourier transform HPLC convoluted peaks: application on LCZ696, an antihypertensive supramolecular complex, with its in process and degradation impurity analysis. Microchem. J.. 2024;200:E110307.
- [Google Scholar]
- Ecofriendly densitometric RP-HPTLC method for determination of rivaroxaban in nanoparticle formulations using green solvents. RSC Adv.. 2020;10:2133-2140.
- [Google Scholar]
- Quantitative analysis of cabozantinib in pharmaceutical dosage forms using green RP-HPTLC and green NP-HPTLC methods: a comparative evaluation. Sus. Chem. Pharm.. 2021;21:E100413.
- [Google Scholar]
- Rapid, sensitive, and sustainable reversed-phase HPTLC method in comparison to the normal-phase HPTLC for the determination of pterostilbene in capsule dosage form. Processes. 2021;9:E1305.
- [Google Scholar]
- Quantification of suvorexant in human urine using a validated HPTLC bioanalytical method. ACS Omega. 2023;8:39928-39935.
- [Google Scholar]
- Pharmacotherapy treatment options for insomnia: a primer for clinicians. Int. J. Mol. Sci.. 2015;17:E50.
- [Google Scholar]
- An overview of thin layer chromatography. Int. J. Pharm. Sci. Res.. 2011;2:256-267.
- [Google Scholar]
- In vitro and in silico characterization of lemborexant (E2006), a novel dual orexin receptor antagonist. J. Pharmacol. Exp. Ther.. 2017;362:287-295.
- [Google Scholar]
- Cross-cultural and comparative epidemiology of insomnia: The diagnostic and statistical manual (DSM), international classification of diseases (ICD) and international classification of sleep disorders (ICSD) Sleep Med.. 2015;16:477-482.
- [Google Scholar]
- A validated high-performance thin-layer chromatographic method for the assay of two binary mixtures containing omeprazole or its isomer esomeprazole in pharmaceutical dosage forms. J. Planar Chromatogr.. 2015;28:74-82.
- [Google Scholar]
- High-performance thin-layer chromatographic assay of metformin in urine using ion-pair solid-phase extraction: application for bioavailability and bioequivalence study of new microbeads controlled release formulation. J. Planar Chromatogr.. 2014;27:377-384.
- [Google Scholar]
- Novel validated HPTLC method for the analysis of two binary mixtures containing tamsulosin hydrochloride with antimuscarinic agents. J. Chromatogr. Sci.. 2018;56:81-91.
- [Google Scholar]
- A rapid and sensitive stability-indicating green RP-HPTLC method for the quantitation of flibanserin compared to green NP-HPTLC method: Validation studies and greenness assessment. Microchem. J.. 2021;164:E105960.
- [Google Scholar]
- HPLC-EAT (Environmental Assessment Tool): a tool for profiling safety, health and environmental impacts of liquid chromatography methods. Green Chem.. 2011;13:2021-2025.
- [Google Scholar]
- Analytical eco-scale for assessing the greenness of analytical procedures. Trends Anal. Chem.. 2012;37:61-72.
- [Google Scholar]
- The 12 principles of green analytical chemistry and the significance mnemonic of green analytical practices. Trends Anal. Chem.. 2013;50:78-84.
- [Google Scholar]
- Analytical method volume intensity (AMVI): a green chemistry metric for HPLC methodology in the pharmaceutical industry. Green Chem.. 2011;13:934-939.
- [Google Scholar]
- Making the move towards modernized greener separations: introduction of the analytical method GREEnness score (AMGS) calculator. Green Chem.. 2019;21:1816-1826.
- [Google Scholar]
- International Conference on Harmonization (ICH), Q2 (R2), 2023. Guideline on validation of analytical procedures–text and methodology, Geneva, Switzerland.
- UPLC-MS/MS based identification and quantification of a novel dual orexin receptor antagonist in plasma samples by validated SWGTOX guidelines. Toxics. 2023;11:E109.
- [Google Scholar]
- Development and validation of novel HPLC method for analytical evaluation of lemborexant in tablet dosage form. GSC Adv. Res. Rev.. 2022;11:132-143.
- [Google Scholar]
- Integrative AQbD, up-to-date greenness, and whiteness tools for evaluation of a sustainable RP-HPLC method used for simultaneous separation of triple antihypertensive combination therapy as a model. Sus. Chem. Pharm.. 2023;36:E101288.
- [Google Scholar]
- Application of advanced environmentally benign assessment tools in determining ternary cardiovascular drug combination by RP-HPLC with analytical quality by design: application to stability indicating method evaluation. Sus. Chem. Pharm.. 2023;35:E101197.
- [Google Scholar]
- An introduction to the national environmental methods index. Env. Sci. Technol.. 2005;39:173A-A176.
- [Google Scholar]
- Lemborexant, an orexin receptor antagonist sedative-hypnotic: is it useful for insomnia in psychiatric disorders? Aust. Psychiatry. 2022;30:530-532.
- [Google Scholar]
- Emerging role of orexin antagonists in insomnia therapeutics: an update on SORAs and DORAs. Pharmacol. Rep.. 2016;68:231-242.
- [Google Scholar]
- Abuse potential of lemborexant, a dual orexin receptor antagonist, compared with zolpidem and suvorexant in recreational sedative users. J. Clin. Psychopharmacol.. 2022;42:365-373.
- [Google Scholar]
- Comparison of TLC and different micro TLC techniques in analysis of tropane alkaloids and their derivatives mixture from Datura inoxia Mill. extract. Chromatographia. 2013;76:1327-1332.
- [Google Scholar]
- Establishment of a simultaneous assay for lemborexant, a novel dual orexin receptor antagonist, and its three metabolites, and its application to a clinical protein binding study. J. Pharm. Biomed. Anal.. 2020;187:E113359.
- [Google Scholar]
- Exploiting the power of UPLC in separation and simultaneous determination of pholcodine, guaiacol along with three specified guaiacol impurities. BMC Chem.. 2023;17:E35.
- [Google Scholar]
- Method development and validation of lemborexant in bulk and its pharmaceutical dosage form by reverse phase–high performance liquid chromatography (RP-HPLC) World J. Pharm. Res.. 2020;9:1372-1380.
- [Google Scholar]
- What color is your method? Adaptation of the RGB additive color model to analytical method evaluation. Anal. Chem.. 2019;91:10343-10352.
- [Google Scholar]
- How to evaluate methods used in chemical laboratories in terms of the total chemical risk? A ChlorTox Scale. Green Anal. Chem.. 2023;5:E100056.
- [Google Scholar]
- A green analytical method using algorithm (PCCA) for extracting components' contribution from severely overlapped spectral signals in pharmaceutical mixtures. Res. J. Pharm. Technol.. 2019;12:4332-4338.
- [Google Scholar]
- AGREE-Analytical GREEnness metric approach and software. Anal. Chem.. 2020;92:10076-10082.
- [Google Scholar]
- A new tool for the evaluation of the analytical procedure: green analytical procedure index. Talanta. 2018;181:204-209.
- [Google Scholar]
- A high-throughput UPLC-MS-MS bio-analytical method for the analysis of veterinary pharmaceutical residues in chicken tissues, application of efficient-valid-green (EVG) framework as a competence tool. J. Chromatogr. A.. 2024;1724:E464901.
- [Google Scholar]
- Guidelines for accurate application of green and white analytical concepts: merits versus demerits with insights of significant milestones of assessment tools applied for antiviral drugs. Microchem. J.. 2024;199:E109917.
- [Google Scholar]
- Clinical practice guideline for the pharmacologic treatment of chronic insomnia in adults: an American academy of sleep medicine clinical practice guideline. J. Clin. Sleep Med.. 2017;13:307-349.
- [Google Scholar]
- A greener RP-HPTLC-densitometry method for the quantification of apremilast in nanoformulations and commercial tablets: greenness assessment by analytical eco-scale, ChlorTox, and AGREE methods. Arabian J. Chem.. 2024;17:E105571.
- [Google Scholar]
- A comparative greenness assessment of chromatographic methods for cilnidipine analysis and its combination. Green Anal. Chem.. 2024;9:E100112.
- [Google Scholar]
- Classical versus chemometrics tools for spectrophotometric determination of fluocinolone acetonide, ciprofloxacin HCl and ciprofloxacin impurity-A in their ternary mixture. BMC Chem.. 2023;17:E49.
- [Google Scholar]
- Physiologically-based pharmacokinetic modeling to predict drug interactions of lemborexant with CYP3A inhibitors. CPT Pharmacometrics Syst. Pharmacol.. 2021;10:455-466.
- [Google Scholar]
Appendix A
Supplementary material
This manuscript contains supplementary materials which can be found online. Fig. S1 represents the molecular structure of LMB. Fig. S2 presents the NEMI results for the present NP- and RP-HPTLC methods. Fig. S3 presents the 3D spectra of standard LMB and commercial tablets using NP- and RP-HPTLC methods. Table S1 presents the accuracy results for both methods. Table S2 presents the precision results for both methods. Table S3 presents the robustness results for both methods. Supplementary data to this article can be found online at https://doi.org/10.1016/j.arabjc.2024.105837.
Appendix A
Supplementary material
The following are the Supplementary data to this article:Supplementary Data 1
Supplementary Data 1


