

Translate this page into:
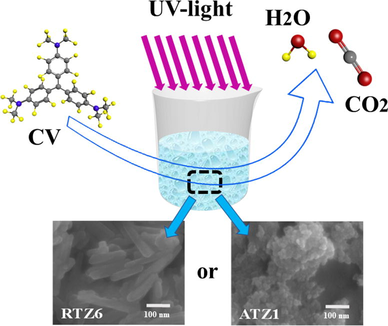
Controlled crystal phase and particle size of loaded-TiO2 using clinoptilolite as support via hydrothermal method for degradation of crystal violet dye in aqueous solution
⁎Corresponding authors. jhsun@bjut.edu.cn (Jihong Sun), wuxia@bjut.edu.cn (Xia Wu)
-
Received: ,
Accepted: ,
This article was originally published by Elsevier and was migrated to Scientific Scholar after the change of Publisher.
Peer review under responsibility of King Saud University.
Abstract
Abstract
TiO2/clinoptilolite catalyst with controlled crystal phase and particle size was prepared. Increase in temperature and acidity is found to enhance particle size of loaded TiO2. Strengthening acidity leads to the more uniform distribution of loaded TiO2. TiO2/clinoptilolite is a potential photo-catalyst in degradation of crystal violet dye. Photo-catalytic activity depends on the crystal phase and size of loaded TiO2.
Abstract
TiO2-supported clinoptilolites (TiO2/clinoptilolites) were successfully synthesized with controlled crystal phase and particle size via hydrothermal method to enhance photocatalytic performance of TiO2. The effects of various parameters including temperature, acidity and concentration of Ti-containing solutions on the particle size, crystal phase and agglomeration of TiO2 supported on clinoptilolite were investigated thoroughly by characterizations of X-ray diffraction (XRD), Fourier transform infrared (FT-IR) spectroscopy, scanning electron microscope (SEM), transmission electron microscope (TEM), BET isotherm, UV–visible (UV–vis) spectrophotometer and Malvern zetasizer. The results demonstrate that increasing temperature and strengthen acidity are beneficial to enhance the crystallinity and particle size of supported TiO2. Increase in acidity also leads to more uniform distribution of TiO2 on the surface of clinoptilolite. The TiO2 nano-crystals deposited on the surface of clinoptilolite, exhibit rutile or anatase phase, strongly depending on the preparation procedure. The resultant TiO2/clinoptilolites could be used as photo-catalysts for the degradation of crystal violet (CV) dye in aqueous solution, showing a higher photo-catalytic activity with 89% degradation within 100 min. The effect of operational parameters, such as pH values of reaction media, dose of used catalyst, and concentration of CV dye on the CV degradation performance were investigated, in which the kinetics of CV dye degradation was found to follow the pseudo-first order kinetic model.
Keywords
TiO2
Clinoptilolite
Hydrothermal method
Crystal phase
Degradation
Crystal violet dye

1 Introduction
Organic coloring matter i.e. dyes, largely used in textile and other coloring industries are the major pollutants to contaminate water and affect the water ecosystem (Mekasuwandumrong et al., 2010; Linda et al., 2016; Rashad et al., 2014; Soliman et al., 2017). Therefore, a number of technologies have been introduced to treat wastewater containing these wastes before being discharged into the surroundings. Particularly, advanced oxidation techniques (AOTs) which are based on the production of highly reactive species, such as hydroxyl radical (•OH) that can efficiently degrade the toxic organic pollutant with high rate constant, have been the focus of many researchers during the past few years (Buthiyappan et al., 2016). Heterogenous photo-catalysis is a cheap, environmentally benign promising Advance Oxidation Technology (AOT) (Ibhadon and Fitzpatrick, 2013; Khan et al., 2018; Vaiano et al., 2019), which involves the use of a semi-conductor and a light source to generate highly reactive •OH and O2•− radicals from positive holes in the valence band and the excited electrons in the conduction band respectively, causing the degradation of target organic contaminants (Banerjee et al., 2014; Panahian et al., 2018; Miklos et al., 2018). TiO2, being inexpensive, non-toxic, readily available, biologically and chemically inactive, resistance to poisoning, photo-stable and photo-active, is the most preferable semiconductor photo-catalyst (Pelaez et al., 2012; Cao et al., 2016). Its photo-catalytic activity depends upon various factors, including particle size, shape, crystal structure, and optical sensitivity, that can be properly tuned to enhance their performance in photo-catalytic degradation (Lin et al., 2006; Allen et al., 2018). However, its relatively large band gap and complicated treatment of catalyst recovery step restrict its industrial applications. Another major problem associated with TiO2, is the recombination of photo-generated electron-hole pairs, which significantly decreases the efficiency of photo-degradation process (Derikvandi and Nezamzadeh-Ejhieh, 2017). Recently some researchers proposed the immobilization of TiO2 onto the suitable supports to hopefully overcome these drawbacks (Perera et al., 2012; Li et al., 2018), which is very useful to increase its surface area, decrease sintering and enhance its thermal and chemical stability (Perisic et al., 2016; Khodadoust et al., 2012). Zeolites are the most suitable candidates as support for TiO2 with strong electric field, which inhibits the electron-hole recombination via distribution of photo-generated electrons inside the zeolite framework (Derikvandi and Nezamzadeh-Ejhieh, 2017).
Clinoptilolite, as one of the most common zeolites in nature, belongs to the group heulandites (HEU), and posses two dimensional framework originating from tetrahedral SiO4 and AlO4 units and contains three sets of intersecting channels (Roth et al., 2014; Ambrozova et al., 2017). Its general chemical formula is (Na, K)6Al6Si30O72·20H2O and the Si/Al ratio may vary from 4 to 5.3 (Kowalczyk et al., 2006). The TiO2-supported natural clinoptilolites having anatase or rutile TiO2 particles are generally prepared via different methods, including sol–gel (Khodadoust et al., 2012), hydrothermal, solvothermal (Zabihi-Mobarakeh and Nezamzadeh-Ejhieh, 2015), and solid state dispersion (Zhou et al., 2016; Mehrabadi and Faghihian, 2018) methods using inorganic and organic Ti precursors following calcination. Yener et al. (2017) synthesized clinoptilolite supported rutile TiO2 using TiCl4 as a precursor, and its photocatalytic activity for degradation of terephthalic acid under ultra violet C (UV-C) illumination elucidated that the weight ratio of TiO2 with clinoptilolite was one of the key factors, which directly impacted not only degradation behaviors but also agglomeration of TiO2 particles and loaded contents. Sene et al. (2017) prepared TiO2/clinoptilolite photo-catalysts using ultra sound irradiation via conventional synthesis methods, verifying that the chemical treatment of clinoptilolite support was favorable to enhance photo-catalytic activity by adjusting its textural properties i.e. porosity, surface area, titania-support interaction and dispersion of TiO2 over support. Furthermore, (Wang et al., 2012) the natural clinoptilolite supported Cr-doped TiO2 photo-catalysts were synthesized using TiCl4 as Ti precursor, and the effect of Cr concentration and calcination temperature on their micro-structure and photo-catalytic activity was investigated. However, the detailed synthesis mechanism of TiO2/clinoptilolite is still vague, particularly, the supported TiO2 needs to be deeply characterized for crystal phase, particle size, agglomeration state and dispersion environment.
In present work, a number of TiO2/clinoptilolites were prepared by one-step hydrothermal treatment under aqueous solution of TiCl4. Our basic objective is to assess the effects of various parameters i.e. temperature, acidity and concentration of titanium precursor on the structural and textural properties of the TiO2/clinoptilolite during hydrothermal process so as to elucidate synthesis mechanism. Using degradation of crystal violet (CV) dye in aqueous solution as a model reaction and obtained TiO2/clinoptilolite as a photo-catalyst, the influences of various parameters including crystal phase, agglomeration state, particle size, and loaded amount of TiO2 on its photo-catalytic activity were investigated via X-ray diffractometer (XRD), inductively coupled plasma-optical emission spectrometry (ICP), Fourier transform infrared (FT-IR), BET isotherm, scanning electron microscope (SEM) and transmission electron microscope (TEM), UV–visible spectrophotometer and Malvern zetasizer. Meanwhile, the kinetics of CV dye degradation was elucidated to further explore the degradation principle.
2 Experimental
2.1 Materials
Natural clinoptilolite with a Si/Al ratio of 10.63 was supplied by Guo TouShengShi Science and Technology Co. Ltd. TiCl4 (99% purity), CV dye (high purity biological stain) were obtained from J & K Co. Ltd. Deionized water with resistivity of 18.25 MΩ∙cm was used for making all kind of solutions.
2.2 TiO2/clinoptilolite preparation
The water soluble and para-magnetic impurities present in finely divided natural clinoptilolite were removed by heating its suspension made in water at 70 °C under continues stirring for 8 h. The resulting suspension was then filtered and dried at 70 °C for overnight. This process was repeated for three times. The purified clinoptilolite was then treated with aqueous solution of TiCl4.
25 mL of 0.25 M TiCl4 solution made in ice cold water were taken in three different 50 mL Teflon lined vessels along with 1 g of obtained above clinoptilolite and enclosed in stainless steel autoclaves. The mixtures were then heated on oil baths under continuous magnetic stirring for 3 h at 100, 150 and 200 °C, respectively. After that, the suspension was filtered, washed with enormous amount of deionized water until the pH of rinsing water became almost neutral and finally dried in an oven at 70 °C for overnight. The composites were marked as RTZ1, RTZ2 and RTZ3 obtained at 100, 150 and 200 °C, respectively.
Similarly, the prepared composites were named as RTZ4, RTZ5 and RTZ6 corresponding to the 1, 2 and 3 M HCl, respectively, used for 0.25 M TiCl4 hydrolysis. Another set of composites were named as RTZ7, RTZ8 and RTZ9 corresponding to 0.08, 0.15 and 0.5 M TiCl4, respectively, each one made in 3 M HCl solution. All the composites RTZ4-RTZ9 were synthesized at 200 °C using 1 g clinoptilolite, 25 mL TiCl4 solution and reaction time interval of 3 h.
Another set of composites were prepared by taking 12.5 mL of 0.5 M TiCl4 solution made in ice cold water in six different Teflon lined vessels. The pH of these solutions was adjusted to 0.05, 0.50, 1.00, 2.00, 3.00 and 7.00, using concentrated NH4OH solution and then diluted to 25 mL. 1 g of clinoptilolite was added to each 25 mL (0.25 M) of the above mentioned solutions and then heated hydrothermally at 200 °C under constant stirring for 3 h. The TiO2/clinoptilolite composites obtained at pH values of 0.05, 0.5, 1, 2, 3, and 7 were named as ATZ1, ATZ2, ATZ3, ATZ4, ATZ5, and ATZ6, respectively. Pure rutile and anatase-rutile mixed phase TiO2 were prepared by the same method mentioned above without adding clinoptilolite and were named as R-TiO2 and AR-TiO2, respectively.
2.3 Characterizations
The crystal structure of the resultant TiO2/clinoptilolite catalysts was determined via XRD (Beijing Purkinje General Instrument Co. Ltd) with a CuKα radiation source in a 2θ range of 5–75°. Scherrer’s equation (D = kλ/βcosθ) was used to calculate the crystallite size of the supported TiO2 (McGehee and Renault, 1972), where D is the size (nm) of the particle, k is a constant (0.9) called crystallite shape factor, λ is the wavelength of X-rays (0.15432 nm) from CuKα radiation source, β is the peak width at half of the maximum and 2θ is the diffraction angle. The elemental composition of clinoptilolite and its composites having TiO2 were measured via ICP (Perkin Elmer Optima 2000 DV). The FT-IR spectroscopy in the wave number range of 400 ∼ 4000 cm−1 was used to examine their chemical structures. N2 adsorption-desorption isotherm measured at 77 K using JWGB JW-BK300 from Beijing Sci. & Tech. Co. Ltd, was used to find out their textural properties including pore size, pore volume, and specific surface area. Each sample was degassed at 200 °C for 6 h prior to measurement. The SEM (JEOLJEM-220) and TEM (JEOL-2010) operating at 15.0 kV and 200 kV respectively were used to observe their morphology and microstructures. The UV–vis spectrophotometer (SHIMADZU UV-2600) was used to find out the band gaps. The pH of point of zero charge (pHpzc) was determined using Malvern Zetasizer (Malvern Instruments Ltd, Malvern, UK). The photoluminescence (PL) spectra for photocatalysts were investigated on F-700 FL (Hitachi High-Tech Science Corporation Tokyo Japan) fluorescence spectrophotometer.
2.4 Photo-catalytic degradation experiments
The photo-catalytic degradation of CV dye in aqueous solution was carried out at room temperature and 100 mL solution was taken in 250 mL glass beaker. The light source used was a high pressure UV-Hg source (80 W) enclosed in a rectangular steel box. The calibration of UV-irradiation source was carried out with iodide-iodate actinometry and the UV-fluence rate was found to be 140.2 mW/cm2. Aliquots of used sample was taken at regular interval, centrifuged to remove the suspended solid particles and then analyzed using UV–Vis spectrophotometer. Each experiment was carried out in duplicate in order to validate the results. At the end of each cycle, the used catalysts were regenerated by centrifugation, washed with deionized water and dried at 60 °C overnight to study their photo-stability.
The degradation percentages, X % of the CV dye were calculated using the following Eq. (1):
3 Results and discussion
3.1 Structure and texture of TiO2/clinoptilolites
The XRD patterns of original clinoptilolite, typical ATZ1 and RTZ6 are shown in Fig. 1A, whereas the others (RTZ1-RTZ9 and ATZ1-ATZ6) are shown in Figs. S1 and S2 of the Supporting Information (SI) section. As can be seen, the HEU structure of clinoptilolite and the crystal phase of TiO2 could be confirmed by comparison with JCDPSs values, in which, the characteristic peaks at 2θ degree of 9.98, 11.27, 22.29, 26.82, 30.07, and 32.23 in Fig. 1A and Figs. S1 and S2 are ascribed to the main features of clinoptilolite (Liu et al., 2014, Davari et al., 2017), others (RTZ6, as shown in Fig. 1A-c) at 2θ value of 27.79, 36.11, 41.39, and 54.19 in Fig. 1A-c and Fig. S1 are assigned to rutile phase, while that (ATZ1, as shown in Fig. 1A-b) at 2θ value of 25.3, 38.07, 48.07 and 53.91 (Fig. 1A-b and Fig. S2) are attributed to the anatase phase (Davari et al., 2017, Sene et al., 2017, Tang et al., 2016). Furthermore, as shown in Table 1, the crystal size calculated on the basis of Scherer’s equation presented the increasing tendency of from 13 to 26 nm for rutile phase in the composite RTZ1-RTZ9 along with enhancements of temperature, acidity, and concentration of TiCl4, but almost the same around 8–10 nm for anatase phase in the composites ATZ1-ATZ3. However, the decline phenomenon in intensity of all characteristic peaks for clinoptilolite in ATZ samples and RTZ samples was due to the large amounts and big particles of loaded TiO2. The XRD patterns of both ATZ1 and RTZ6 after photocatalytic degradation (Fig. S4) presented declined intensity of characteristic peaks belonging to anatase, rutile, and clinoptilolite, as compared that pristine catalysts (Fig. 1A). The main reason behind it might be due to the adsorption of dye molecules on the surface of catalyst.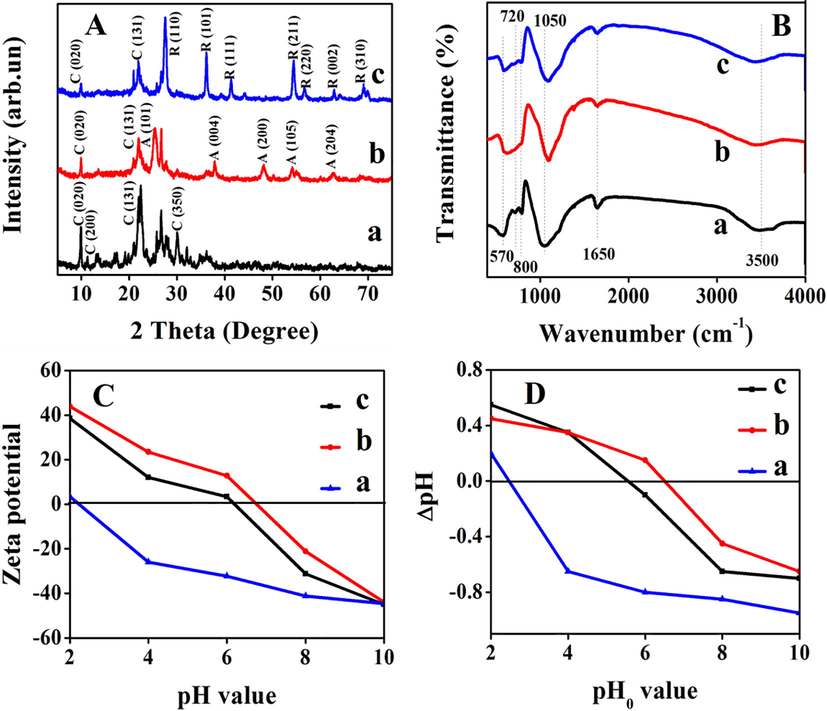
(A) XRD patterns, (B) FT-IR spectra, (C) Zeta potentials of clinoptilolite and related composites measured by zetasizer, (D) Zeta potentials of clinoptilolite and related composites determined via classical method. (a): clinoptilolite, (b): ATZ1, and (c): RTZ6.
Sample
Formula
% of TiO2
Phase of TiO2
TiO2 particle size (nm)
Si/Al (molar ratio)
BET surface area (m2/g)
Eg value (eV)
n = 1/2
n = 2
Clinoptilolite
Na0.708K1.78Al7.57Si80.46O173.52
–
–
–
10.63
19.7
–
–
RTZ1
Ti8.01Na0.37K0.86Al2.73Si53.67O128.36
15.42
Rutile
13.23
19.66
134.1
2.98
2.93
RTZ2
Ti11.21Na0.18K0.52Al1.87Si44.05O113.68
22.06
Rutile
14.08
23.56
76.3
3.22
2.94
RTZ3
Ti9.2Na1.09K0.57Al2.21Si60.01O142.57
17.61
Rutile
20.31
27.16
20.9
2.95
2.89
RTZ4
Ti11.67Na0.55K0.39Al1.79Si48.05O122.45
21.46
Rutile
21.30
26.84
28.8
2.96
2.89
RTZ5
Ti13.36Na0.74K0.52Al1.93Si49.94O132.18
19.06
Rutile
24.95
25.87
30.25
2.95
2.91
RTZ6
Ti10.23Na0.76K0.62Al2.02Si55.07O134.26
17.47
Rutile
25.68
27.26
51.4
2.96
2.85
RTZ7
Ti5.94Na0.45K0.65Al2.29Si56.21O128.29
10.78
Rutile
21.30
24.54
25.58
3.35
2.97
RTZ8
Ti5.45Na1.16K0.61Al2.239Si92.34O199.82
6.55
Rutile
24.26
41.22
24.87
3.39
2.87
RTZ9
Ti14.18Na0.58K0.64Al1.25Si33.12O97.09
31.06
Rutile
25.68
26.49
21.5
3.26
2.85
ATZ1
Ti9.17Na0.62K0.32Al1.41Si4.46O49.85
32.69
Anatase
9.2
10.25
45.4
3.50
3.19
ATZ2
Ti10.08Na0.53K1.06Al1.69Si14.88O53.25
35.69
Anatase
8.2
8.81
45.52
3.41
3.00
ATZ3
Ti11.39Na0.61K2.32Al2.61Si14.85O57.86
37.01
Anatase
7.6
5.59
68.2
3.43
3.09
FT-IR spectra of ATZ1 and RTZ6, as shown in Fig. 1B, exhibit almost the same profiles as that of clinoptilolite, suggesting that the skeleton framework of clinoptilolite are remained intact after TiO2 loading. In details, the most intense peak at around 1050 cm−1 is associated to asymmetric stretching vibration of O—Si(Al)—O (Trujillo et al., 2013), which shifts to a relatively higher wavenumber in RTZ6 (1090 cm−1, as shown in Fig. 1B-c) and ATZ1 (1080 cm−1, as shown in Fig. 1B-a) as compared to clinoptilolite (Fig. 1B-a). The bands appeared at around 1650 and 3500 cm−1 are assigned to the stretching vibration of OH group of water present in the zeolite structure (Rahmani et al., 2015). Other peaks at around 570, 720, and 800 cm−1 are attributed to the stretching vibrations of tetrahedral atoms and dual rings 4 and 6 tetrahedral atoms present in zeolite structure (Davari et al., 2017, Najafabadi and Taghipour, 2012). The broadening of bands below 1000 cm−1 observed in ATZ1 (Fig. 1B-b) and RTZ6 (Fig. 1B-c) after TiO2 loading may be due to the overlapping of Ti—O stretching band at 690 cm−1 of TiO2 and Si—O—Si bands of zeolite (Yener et al., 2017).
Fig. 1C and D show the zeta potential of clinoptilolite and related components as a function of pH of the solutions in the range of 2–10 as determined by zetasizer and classical method, respectively. As can be seen, the pH values of point of zero charge (pHpzc) for clinoptilolite (Fig. 1C-a), ATZ1 (Fig. 1C-b), and RTZ6 (Fig. 1C-c) measured by zetasizer were found to be 2.23, 6.66, and 6.15, respectively. While the pHpzc for clinoptilolite (Fig. 1D-a), ATZ3 (Fig. 1D-b), and RTZ6 (Fig. 1D-c) were found to 2.5, 6.5, and 5.6, respectively, as determined by classical method. The relatively high value of pHpzc of ATZ1 (Fig. 1C-b) and RTZ6 (Fig. 1C-c) as compared to the pure clinoptilolite (Fig. 1C-a) may be due to their synthesis procedure. The surface at pH below pHpzc reveals positively charged, whereas negatively charged at pH above pHpzc. Therefore, it is concluded that the surface of clinoptilolite throughout the pH range of 0.05–7.00 remains highly negatively charged.
UV–vis spectra of TiO2 supported clinoptilolite were taken to study the band gap variation during the process. Band gap of TiO2/clinoptilolite was determined using Tauc relation (Ahυ)n = C(hυ-Eg), where A is the absorbance, h is the Planck’ s constant, υ is the frequency and Eg is the band gap energy. The n has value of 1/2, 2, 3/2, and 3 (Karimi-Shamsabadi and Nezamzadeh-Ejhieh, 2016) for the allowed direct, indirect, and forbidden direct, and indirect, respectively. Accordingly, (Ahυ)n (y-axis) was plotted against hυ (x-axis). Extrapolating the linear portion of (Ahυ)n vs hυ plot to y-axis = 0, for n = 1/2 and 2 gives different Eg values, as shown in Table 1. As a conclusion, the band gaps for rutile phase TiO2/clinoptilolite composites (2.85 eV for RTZ6), as shown in Table 1, are reduced considerably as compared to that with anatase phase (3.19 eV for ATZ1).
The PL spectra were determined to understand the rate of photo-generated electron-hole pair recombination in different TiO2/clinoptilolite catalysts, as shown in Fig. S5. As can be seen in Fig. S5-i, pure rutile TiO2 (R-TiO2) exhibits the highest emission intensity, while ATZ1, RTZ6 and AR-TiO2 have the least emission intensity. These PL signals result from oxygen vacancies and defects of TiO2, in which, clinoptilolite as substrate is useful to decrease oxygen vacancies and intrinsic defects of TiO2. In this case, small particles have large oxygen vacancy content and thus have higher probability of excitation, leading to the strong PL signals (Wang and Li, 2014; Zhang et al., 2014).
The textural parameters of all samples originating from N2 adsorption-desorption isotherms are listed in Table 1, in which, the surface areas firstly decreased from 134 m2/g for RTZ1 to 21 m2/g for RTZ3, and then increased gradually to 51 m2/g for RTZ6, while the surface area (45.4 m2/g) for ATZ1 was low, but higher for ATZ3 (68.2 m2/g). These observations may be based on the fact that increasing acidity of the media used for hydrolysis-polycondensation duration of TiCl4 could prevent the TiO2 particles from agglomeration during hydrothermal synthesis, which in turn are beneficial to uniform and independent dispersion on the clinoptilolite.
Moreover, as listed in Table 1, Si/Al ratio of RTZ1-RTZ9 samples with TiO2-loaded contents of around 6.55 to 31% exhibited 20-41, which became higher than that of pure clinoptilolite (around 10.6), due to the dealumination under high acidic conditions.
Fig. 2a and c shows rod-like particles with uniform dispersion in size of around 30 nm of RTZ6, which is different from that of the very well defined smooth surface of pure clinoptilolite (Fig. S3-a). ATZ1 (Fig. 2b and d) presents the deposition of spherical-like particles with comparatively less agglomeration. These observations are found in close agreement with crystal phase loaded TiO2 calculated on the basis of XRD patterns (Table 1). The SEM images of ATZ1 and RTZ6 after photocatalytic activity, as shown Fig. S6, exhibit almost the same morphology to that of pristine catalysts which reflect the long term photo-stability of the composite catalysts. The SEM images of other samples (RTZ1-RTZ9 and ATZ2-ATZ3), as shown in Fig. S3 of SI section, also exhibit similar phenomena. Additionally, the TEM mapping of Ti in RTZ6 (Fig. 2e) and ATZ1 (Fig. 2f) illustrate uniform distribution on the surface of clinoptilolite, rather than going inside the micropore channels. The HRTEM images of RTZ6 (Fig. 2g) and ATZ1 (Fig. 2h) further reconfirm the presence of rutile and anatase phases in RTZ6 and ATZ1, respectively, which are aslo found in good agreement with that results depicted by XRD patterns (Fig. 1A). Selected area electron diffraction (SAED) images were shown in Fig. 2i, and j. As can be seen, the SAED patterns in RTZ6 (Fig. 2i) and ATZ1 (Fig. 2j) exhibit spotty ring pattern without any additional diffraction spots, corresponding to different crystal planes of rutile and anatase phases of TiO2, respectively, which strongly support XRD analysis in Fig. 1A.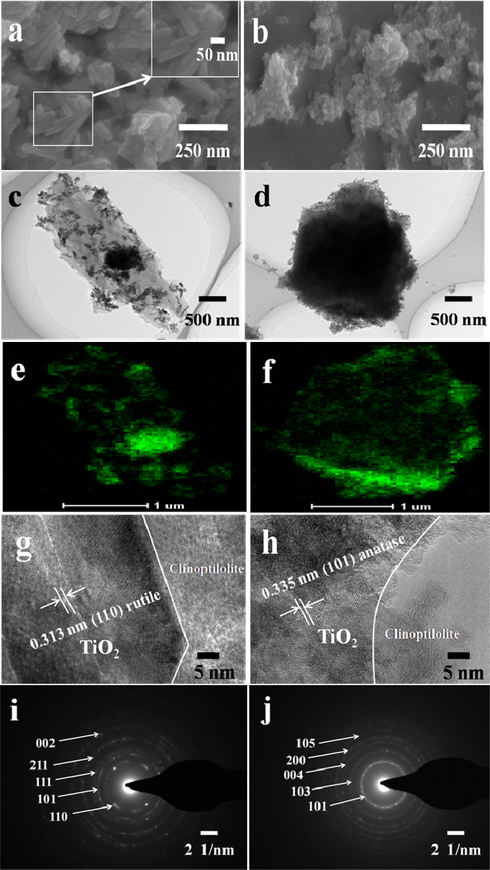
(a and b) SEM images, (c and d) TEM images, (e and f) Mapping of Ti, (g and h) HRTEM images, and (i and j) SAED images of rutile and anatase phases of TiO2 in RTZ6 (a, c, e, g, and i) and ATZ1 (b, d, f, h, and j), respectively.
3.2 Photo-catalytic degradation
Prior to photo-catalytic degradation, the solution was kept under continuous magnetic stirring for one hour in dark to attain adsorption-desorption equilibrium. The amount of adsorbed CV dye was found to vary between 5 and 15% for synthesized photo-catalysts. In order to elucidate the effect of UV-light on the degradation properties of CV dye, an experiment was carried out as a blank under UV-irradiation in the absence of photo-catalyst. Only about 5% degradation of CV dye was obtained under UV-irradiation within 60 min. Therefore, the influences of various parameters on the catalytic activity are thoroughly investigated and given in the following results and discussion section.
3.2.1 Effect of type and dose of TiO2/clinoptilolites
As shown in Fig. 3, ATZ1 is the most photo-catalytically active (up to 67.6% degradation) when using anatase-containing TiO2/clinoptilolites as catalysts, however, the rutile-contained catalysts are relatively less photo-catalytically active due to its fast electron-hole recombination characteristics (Allen et al., 2018, Behnajady et al., 2008). While RTZ6 is the most photo-catalytically active (58.8% degradation), which may be due to their relatively large surface area (51 m2/g) and bigger crystal size (26 nm) of rutile phase. Furthermore, large particle size and better dispersion of TiO2 in RTZ6 as compare to other rutile contained catalysts leads to considerable PL quenching as clear form Fig. S5, indicating effective inhibition of recombination of generated electron-hole pair. Almquist and Biswas (2002) synthesized TiO2 containing different particle sizes (5–165 nm) and concluded that an optimum particle sizes of 25–40 nm is the best for the photo-catalytic activity. They demonstrated that the increase in particle size of rutile TiO2 tends to decrease the electron-hole recombination rate, in other words, the rate of electron-hole recombination increases on the particle surface with the decreasing particle size due to the enhanced proximity of the charges. Presently, we found that the degradation efficiencies of the pure rutile TiO2 and anatase-rutile mixed TiO2 (89.68% anatase + 10.32% rutile) were about 32.26 and 55.50%, respectively. Therefore, RTZ6 and ATZ1 were selected as the optimum photo-catalysts for further studies.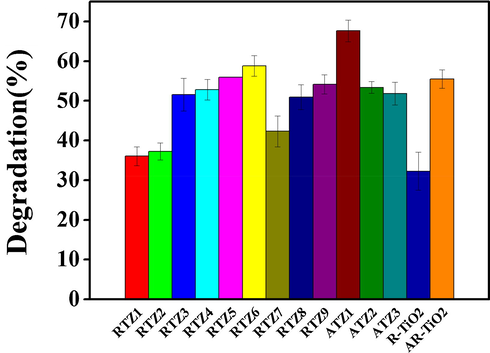
Effect of type of photo-catalyst on the photo-catalytic degradation of crystal violet dye present in aqueous solution under following conditions: catalyst dose = 0.5 g/L, pH = 5.8, CV dye concentration = 12 ppm, Time = 100 min.
To determine the optimum amount of the obtained TiO2/clinoptilolites for degradation of CV dye, five different doses i.e. 0.12, 0.25, 0.5, 0.75 and 1 g/L of TiO2/clinoptilolite were used, and their degradation performances are shown in Fig. 4A. As can be seen, the degradation rate of CV dye firstly increased to 67% for ATZ1 (Fig. 4A-a) and 58% for RTZ6 (Fig. 4A-b) with increasing dose up to 0.5 g/L, then decreased to 53% for ATZ1 and 50% for RTZ6, while using larger doses (around 1.0 g/L). The relatively low degradation rate of CV dye with lower dose, i.e. 0.1 and 0.25 g/L was quite, because less number of catalyst particles interact with UV light to produce the reactive radicals i.e. •OH, O2•− etc. (Nezamzadeh-Ejhieh and Khorsandi, 2010). While high dose, i.e. 0.75 and 1 g/L, may scatter the light and causes difficulty for UV-light to pass through the solution easily, resulting in the decrease of degradation of CV dye (Nezamzadeh-Ejhieh and Khorsandi, 2010, Shafaei et al., 2010). In these cases, 0.5 g/L is selected as the optimum dose of used catalyst. Furthermore, ATZ1 (Fig. 4A-a) exhibits higher photo-catalytic activity as compared to RTZ6 (Fig. 4A-b) for all the doses of the used catalyst. The low degradation efficiency of RTZ6 is attributed to the relatively fast electron-hole recombination taking place in rutile phase of TiO2 after UV-irradiation. However, the photo-catalytic activity using pure clinoptilolites as catalysts with different doses showed less than 6% degradation of the CV dye (Fig. 4A-c), suggesting poor photo-catalytic behavior of pure clinoptilolite.
Effect of various parameters on the % degradation of CV dye: (A) amount of photo-catalysts. Conditions: Initial pH = 5.8, dye concentration = 12 ppm, Time = 100 min, Room temperature. (B) pH of media. Conditions: dose of catalyst = 0.5 g/L, dye concentration = 12 ppm, Time = 100 min, Room temperature. (C) Irradiation time interval. Conditions: Initial pH = 8, dose of catalyst = 0.5 g/L, dye concentration = 12 ppm, Time = 100. (D) UV–Vis absorbance spectra of CV catalyzed by ATZ1. (a): ATZ1, (b): RTZ6, and (c): pure clinoptilolite.
3.2.2 Effect of pH values, irradiation time, and initial concentration of dye
The pH value is an important factor, affecting the photo-catalytic degradation of organic contaminants in wastewater due to its strong influences on the production of •OH radicals and also the charge of the catalyst surface (Nezamzadeh-Ejhieh and Amiri, 2013). The effect of pH value was investigated by performing experiments at various pH values, and Fig. 4B shows that the photo-catalytic degradation rate is around 37% for ATZ1, 7% for RTZ6, and 5% for pure clinoptilolite at low pH value of around 2.0, but gradually increases to 89% for ATZ1 (Fig. 4B-a), 76% for RTZ6 (Fig. 4B-b), and 7% for pure clinoptilolite (Fig. 4B-c) with increasing initial pH (up to 8) of the solution. As shown in Fig. 1C, the pHpzc values of 6.15 and 6.66 determined for RTZ6 and ATZ1, respectively, have direct influence on the photo-catalytic degradation. Therefore, the catalyst surface at pH < pHpzc is positively charged, which hinders the adsorption of cationic CV, leading to the low degradation rate (Nezamzadeh-Ejhieh and Shirzadi, 2014). Both the composites, i.e. ATZ1 and RTZ6 present highest degradation efficiency at pH of 8 and then a little decrease in degradation efficiency occurs at pH 10. These results were similar to that reported by Nezamzadeh-Ejhieh and Khorsandi, (2014). The decreased degradation efficiency at pH > 8 is due to the appearance of repulsive forces between the highly negatively charged catalyst surface and free electron pairs of the CV dye. Therefore, relatively less molecules of CV dye can reach the catalyst surface where the highly reactive •OH radicals are generated. Furthermore, there might occurs two types of reactions such as (i) reaction of •OH with •OH due to the presence of greater amount of •OH radicals (Liu et al., 2012), (ii) reaction of •OH with −OH, at high pH values producing relatively less reactive species (Nezamzadeh-Ejhieh and Moeinirad, 2011), and consequently reducing the % degradation.
As seen in Fig. 4C, the degradation of CV dye increases up to 89.5% for ATZ1 (Fig. 4C-a), 78.7% for RTZ6 (Fig. 4C-b), and 7% for pure clinoptilolite (Fig. 4C-c) with prolong time interval (around 100 min). The corresponding UV–vis spectra of CV dye at different irradiation time intervals using ATZ1 as a photocatalyst is also shown in Fig. 4D, which clearly illustrates a decrease in absorbance of the characteristic peak with increasing time interval.
Photo-catalytic degradation process using different initial concentrations of CV dye is shown in Fig. 5. As can be seen in Fig. 5A and B, the degradation rate using both RTZ6 and ATZ1 as catalysts decreases with increasing initial concentration of CV dye. It may be due to the fact that fix number of •OH radicals produced from a given amount of photo-catalyst and UV-light are reacting with different initial concentrations of CV dye. Furthermore, the opacity of solution increases with increasing concentration of CV dye and penetration of UV-light through the solution becomes difficult, producing relatively less number of the highly reactive •OH radicals.
Degradation of CV dye at different initial concentration of CV dye using RTZ6 (A and C) and ATZ1 (B and D). Conditions: 0.5 g/L of catalyst, pH = 8, RT, Time = 50 min.
In general, the kinetic behavior of heterogeneous photocatalytic reactions is described by following Langmuir Hinshelwood equation:
Hence, the photo-catalytic degradation of CV dye is found to fit the pseudo-first order kinetic expression (3):
Catalyst
Dye concentration (ppm)
Degradation (%)
kapp (min−1)
R2
RTZ6
4
71.97
0.023
0.987
8
62.61
0.019
0.999
12
52.28
0.012
0.969
16
41.71
0.009
0.934
20
18.48
0.003
0.971
ATZ1
4
79.21
0.030
0.985
8
70.88
0.023
0.977
12
64.58
0.019
0.985
16
44.71
0.011
0.985
20
22.60
0.005
0.964
3.2.3 Mechanism of photo-catalytic activity
The electrons in the valance band of TiO2 gets excited to the conduction band by absorbing photon of energy equal to or greater than the band gap of the semi-conductor, and leave their footprints as positive holes in the valance band. The excited electrons may either recombine with positive holes or with dissolved O2 molecules to form reactive superoxide anion radical (O2•−). In parallel, positive charged holes can oxidize water molecules adsorbed on the surface of catalyst to form potentially active hydroxyl radical (•OH). These generated hydroxyl and super oxide anion radical have high oxidation potential and thus cause degradation of organic contaminants (Pang et al., 2018). To find out the role of active species responsible for the degradation of CV dye, ATZ3 was used as the catalyst, and 10 ppm each of benzoquinone and isopropyl alcohol as scavengers for O2•− and •OH radicals respectively. Study reveals that the photo-catalytic activity of ATZ3 was reduced from 89% to 30% in the presence of •OH radical scavenger and to 63% in the presence of O2•− radical scavenger. These results demonstrate that both the radicals i.e. O2•− and •OH, contribute to the photocatalytic activity, but the activity mainly depend upon the hydroxyl radical. The relevant comparative data of CV dye degradation performances taken from the literature is listed in Table S1, where the present work could be compared.
3.2.4 Catalyst recycling
The photo-catalysts RTZ6 and ATZ1 were used over five successive cycles to investigate their photo-stability. As shown in Table 3, the degradation efficiency of both ATZ1 and RTZ6 was found to be more or less decreased after consecutive five cycles, which may be due to the accumulation of pollutant molecules on the active sites on the surface of the catalyst (Gomez et al., 2013). On the other hand, almost 90% of the photo-catalyst could be recovered in each recycle, and thereafter the dosage of reused photo-catalyst was reduced during degradation experiment, which also contributes its share to the decrease in % degradation. Kanakaraju et al. (2015) also observed a similar decrease in the photo-catalytic activity of TiO2/clinoptilolite catalyst after its successive use. Conditions: Dose of catalyst = 0.5 g/L, pH = 8, Room temperature, Time = 100 min, Initial dye concentration = 12 ppm.
%Degradation
Catalyst
1st cycle
2nd cycle
3rd cycle
4th cycle
5th cycle
ATZ1
90.04
82.54
75.09
69.66
64.94
RTZ6
77.40
72.41
67.18
60.04
52.93
4 Conclusions
TiO2/clinoptilolites with different crystal phase, particle size and agglomeration of loaded-TiO2 were successfully prepared by hydrothermal method. The various characterizations verified that increase in acidity favors rutile phase TiO2 with large particle size and uniform distribution over clinoptilolite support. The obtained TiO2/clinoptilolites could be used as photocatalysts for degradation of CV dye in aqueous solution, and the results demonstrate that crystal phase and particle size of loaded-TiO2 have a significant effect on its photo-catalytic activity, in which one having rutile phase (RTZ6) and another with anatase phase (ATZ1) were found to be the most photo- active due to their relatively big crystal size, large surface area and uniform distribution of TiO2 particles. Their degradation kinetics using both RTZ6 and ATZ1 as photo-catalysts was found to follow pseudo-first order kinetics.
Acknowledgments
This project was supported by the National Natural Science Foundation of China (21576005 and 21878006).
References
- The effect of crystalline phase (anatase, brookite and rutile) and size on the photocatalytic activity of calcined polymorphic titanium dioxide (TiO2) Polym. Degrad. Stabil.. 2018;150:31-36.
- [Google Scholar]
- Role of synthesis method and particle size of nanostructured TiO2 on its photoactivity. J. Catal.. 2002;212:145-156.
- [Google Scholar]
- New insights into the mechanism of visible light photocatalysis. J. Phys. Chem. Lett.. 2014;5:2543-2554.
- [Google Scholar]
- The effect of particle size and crystal structure of titanium dioxide nanoparticles on the photocatalytic properties. J. Environ. Sci. Health A. 2008;43:460-467.
- [Google Scholar]
- Recent advances and prospects of catalytic advanced oxidation process in treating textile effluents. Rev. Chem. Eng.. 2016;32:1-47.
- [Google Scholar]
- Highly photocatalytic activity of brookite/rutile TiO2 nanocrystals with semi-embedded structure. Appl. Catal. B. 2016;180:551-558.
- [Google Scholar]
- Degradation of diphenhydramine by the photocatalysts of ZnO/Fe2O3 and TiO2/Fe2O3 based on clinoptilolite: Structural and operational comparison. J. Environ. Chem. Eng.. 2017;5:5707-5720.
- [Google Scholar]
- Increased photocatalytic activity of NiO and ZnO in photodegradation of a model drug aqueous solution: Effect of coupling, supporting, particles size and calcination temperature. J. Hazard. Mater.. 2017;321:629-638.
- [Google Scholar]
- Preparation and characterization of TiO2/HZSM-11 zeolite for photodegradation of dichlorvos in aqueous solution. J. Hazard. Mater.. 2013;258:19-26.
- [Google Scholar]
- Heterogeneous photocatalysis: recent advances and applications. Catalysts. 2013;3:189-218.
- [Google Scholar]
- Titanium dioxide/zeolite integrated photocatalytic adsorbents for the degradation of amoxicillin. Appl. Catal. B. 2015;166:45-55.
- [Google Scholar]
- Comparative study on the increased photoactivity of coupled and supported manganese-silver oxides onto a natural zeolitenano-particles. J. Mol. Catal. A. Chem.. 2016;418:103-114.
- [Google Scholar]
- ZnO/NiO coated mulyi-walled carbon nano tubes for textile dyes degradation. Arab. J. Chem.. 2018;11:880-896.
- [Google Scholar]
- Photocatalytic degradation of monoethanolamine in wastewater using nanosized TiO2 loaded on clinoptilolite. Spectrochim. Acta Part A. 2012;92:91-95.
- [Google Scholar]
- Porous structure of natural and modified clinoptilolites. J. Colloid Interface Sci.. 2006;297:77-85.
- [Google Scholar]
- TiO2 nanoparticles assembled on kaolinites with different morphologies for efficient photocatalytic performance. Sci. Rep.. 2018;8:11663.
- [Google Scholar]
- Size dependency of nanocrystalline TiO2 on its optical property and photocatalytic reactivity exemplified by 2-chlorophenol. Appl. Catal. B. Environ.. 2006;68:1-11.
- [Google Scholar]
- Photocatalytic degradation of congo red and crystal violet dyes on cellulose/PVC/ZnO composites under UV light irradiation. Mater. Today: Proc.. 2016;3:2035-2041.
- [Google Scholar]
- Simultaneous and sensitive voltammetric determination of acetaminophen and its degradation product for pharmaceutical quality control and pharmacokinetic research by using ultrathin poly (calconcarboxylic acid) film modified glassy carbon electrode. Electrochim. Acta. 2012;63:161-168.
- [Google Scholar]
- TiO2-coated natural zeolite: rapid humic acid adsorption and effective photocatalytic regeneration. Chem. Eng. Sci.. 2014;105:46-52.
- [Google Scholar]
- The use of standard deviation of X-ray diffraction lines as a measure of broadening in the Scherrer equation: a curve fitting method. J. Appl. Crystallogr.. 1972;5:365-370.
- [Google Scholar]
- Elimination of highly consumed herbicide; 2, 4-dichlorophenoxyacetic acid from aqueous solution by TiO2 impregnated clinoptilolite, study of degradation pathway. Spectrochim. Acta Part A. 2018;204:248-259.
- [Google Scholar]
- Effects of synthesis conditions and annealing post-treatment on the photocatalytic activities of ZnO nanoparticles in the degradation of methylene blue dye. Chem. Eng. J.. 2010;164:77-84.
- [Google Scholar]
- Evaluation of advanced oxidation processes for water and wastewater treatment–A critical review. Water Res.. 2018;139:118-131.
- [Google Scholar]
- Cobalt precursor role in the photocatalytic activity of the zeolite-supported TiO2-based photocatalysts under visible light: A promising tool toward zeolite-based core–shell photocatalysis. J. Photochem. Photobiol. A. 2012;248:1-7.
- [Google Scholar]
- CuO supported clinoptilolite towards solar photocatalytic degradation of p-aminophenol. Powder Technol.. 2013;235:279-288.
- [Google Scholar]
- Photodecolorization of eriochrome black T using NiS-P zeolite as a heterogeneous catalyst. J. Hazard. Mater.. 2010;176:629-637.
- [Google Scholar]
- Photocatalytic degradation of 4-nitrophenol with ZnO supported nano-clinoptilolite zeolite. J. Ind. Eng. Chem.. 2014;20:937-946.
- [Google Scholar]
- Heterogeneous photocatalytic degradation of furfural using NiS-clinoptilolite zeolite. Desalination. 2011;273:248-257.
- [Google Scholar]
- Enhancement of the photocatalytic activity of ferrous oxide by doping onto the nano-clinoptilolite particles towards photodegradation of tetracycline. Chemosphere. 2014;107:136-144.
- [Google Scholar]
- Enhanced photo and sono-photo degradation of crystal violet dye in aqueous solution by 3D flower like F-TiO2 (B)/fullerene under visible light. J. Photochem. Photobiol. A. 2018;365:45-51.
- [Google Scholar]
- Crystalline orientation preference for TiO2 nanotube arrays with efficient photoelectrochemical properties. Phys. Lett. A. 2018;382:2759-2762.
- [Google Scholar]
- A review on the visible light active titanium dioxide photocatalysts for environmental applications. Appl. Catal. B. 2012;125:331-349.
- [Google Scholar]
- Hydrothermal synthesis of graphene-TiO2 nanotube composites with enhanced photocatalytic activity. ACS Catal.. 2012;2:949-956.
- [Google Scholar]
- Removal of diclofenac from water by zeolite-assisted advanced oxidation processes. J. Photochem. Photobiol. A. 2016;321:238-247.
- [Google Scholar]
- The beneficial utilization of natural zeolite in preparation of Cr/clinoptilolite nanocatalyst used in CO2-oxidative dehydrogenation of ethane to ethylene. J. Ind. Eng. Chem.. 2015;31:142-155.
- [Google Scholar]
- Photocatalytic decomposition of dyes using ZnO doped SnO2 nanoparticles prepared by solvothermal method. Arab. J. Chem.. 2014;7:71-77.
- [Google Scholar]
- Two-dimensional zeolites: current status and perspectives. Chem. Rev.. 2014;114:4807-4837.
- [Google Scholar]
- Sono-dispersion of TiO2 nanoparticles over clinoptilolite used in photocatalytic hydrogen production: Effect of ultrasound irradiation during conventional synthesis methods. Ultrason Sonochem.. 2017;37:490-501.
- [Google Scholar]
- Photocatalytic degradation of terephthalic acid using titania and zinc oxide photocatalysts: Comparative study. Desalination. 2010;252:8-16.
- [Google Scholar]
- Photocatalytic activity of transition metal ions-loaded activated carbon: Degradation of crystal violet dye under solar radiation. J. Water Process Eng.. 2017;17:245-255.
- [Google Scholar]
- Synthesis and characterization of a novel nanofibrous TiO2/SiO2 composite with enhanced photocatalytic activity. Mater. Lett.. 2016;183:175-178.
- [Google Scholar]
- TiO2/clinoptilolite composites for photocatalytic degradation of anionic and cationic contaminants. J. Mater. Sci.. 2013;48:6778-6785.
- [Google Scholar]
- Electric energy saving in photocatalytic removal of crystal violet dye through the simultaneous use of long-persistent blue phosphors, nitrogen-doped TiO2 and UV-light emitting diodes. J. Cleaner Prod.. 2019;210:1015-1021.
- [Google Scholar]
- Synthesis and characterization of natural zeolite supported Cr-doped TiO2 photocatalysts. Appl. Surf. Sci.. 2012;258:4328-4333.
- [Google Scholar]
- Preparation and characterisation of S doped TiO2/natural zeolite with photocatalytic and adsorption activities. Mater. Technol.. 2014;29:204-209.
- [Google Scholar]
- Clinoptilolite supported rutile TiO2 composites: Synthesis, characterization, and photocatalytic activity on the degradation of terephthalic acid. Sep. Purif. Technol.. 2017;173:17-26.
- [Google Scholar]
- Application of supported TiO2 onto Iranian clinoptilolite nanoparticles in the photodegradation of mixture of aniline and 2, 4-dinitroaniline aqueous solution. J. Ind. Eng. Chem.. 2015;26:315-321.
- [Google Scholar]
- New understanding of the difference of photocatalytic activity among anatase, rutile and brookite TiO2. Phys. Chem. Chem. Phys. 2014:20382-20386.
- [Google Scholar]
- Synthesized TiO2/ZSM-5 composites used for the photocatalytic degradation of azo dye: intermediates, reaction pathway, mechanism and bio-toxicity. Appl. Surf. Sci.. 2016;383:300-309.
- [Google Scholar]
Appendix A
Supplementary material
Supplementary data to this article can be found online at https://doi.org/10.1016/j.arabjc.2019.06.011.
Appendix A
Supplementary material
The following are the Supplementary data to this article:Supplementary data 1
Supplementary data 1


