

Translate this page into:
Controlling the diffusion of micro-volume Pb solution on hydrophobic polyurethane membrane for quantitative analysis using laser-induced breakdown spectroscopy (LIBS)
⁎Corresponding author. e.safitri@unsyiah.ac.id (Eka Safitri)
-
Received: ,
Accepted: ,
This article was originally published by Elsevier and was migrated to Scientific Scholar after the change of Publisher.
Peer review under responsibility of King Saud University.
Abstract
This work reports a novel controlling mechanism of analyte diffusion in a micro volume solution (100 μL) into a hydrophobic membrane. This study was designed to facilitate the liquid–solid conversion using membrane for laser-induced breakdown spectroscopy (LIBS) in quantitatively analyzing aqueous lead (Pb) pollutant. Herein, we used the same analyte (Pb) solution applied on one side of the membrane (back side) to enhance the diffusion of the analyte administered from the other side (front side). The membrane was confirmed hydrophobic with contact angles ranged from 104.6°±1.3° to 106.28°±1.7°, where its morphology had smooth surface and randomly distributed small pores. We found the limit of detection (LOD) to reach 184.2 mg/L derived from a calibration curve with Pb I (405.7 nm) line intensity as the dependent variable, where the root-mean-square-errors (RMSE) and correlation (R2) were 1.08 M and 0.999, respectively. In comparison, the membrane back side with distilled water achieved LOD as low as 134.53 mg/L obtained from the similar calibration curve (RMSE = 5.8 M; R2 = 0.986). Further analysis using the LIBS spectra confirmed the role of the analyte ion on the back side of the membrane in enhancing the analyte diffusion.
Keywords
Drop-wising
LIBS
Liquid–solid conversion
Membrane
Polyurethane

- AAS
-
Atomic absorption spectroscopy
- BET
-
Brunauer-Emmett-Teller
- BJH
-
Barret-Joyner-Halenda
- CPUM
-
Castor oil-based polyurethane membrane
- DDG
-
Digital delay generator
- ICCD
-
Intensified charge-coupled device
- LIBS
-
Laser-induced breakdown spectroscopy
- LOD
-
Limit of detection
- LSC
-
Liquid-to-solid conversion
- MDI
-
4,4′-diphenylmethane diisocyanate
- RMSE
-
Root-mean-square errors
- SEM
-
Scanning electron microscopy
- TDI
-
Toluene diisocyanate
Abbreviations
1 Introduction
Laser-induced breakdown spectroscopy (LIBS) has gained many scholars’ attention in the field of analytical chemistry (Anabitarte et al., 2012). The technique is capable of performing multi-elemental analysis with good accuracy and precision via micro ablation sampling for metal and solid materials. Moreover, LIBS has a practical advantage that requires no chemical solvents and is often considered as an eco-friendly analytical tool (Hussain Shah et al., 2020). As of today, LIBS has been developed to carry analysis on much more complicated substrates; soft organic samples such as milk powder (Iqbal et al., 2018), coffee bean (Abdulmadjid et al., 2017; Nasution et al., 2019), raw fish (Marpaung et al., 2020), and saliva (Zahroh et al., 2019). The main challenge in LIBS technique is the presence of matrix effects which could be derived from the physical and chemical properties of the substrate (Guezenoc et al., 2019). This challenge is primarily obtained when handling liquid samples, where water evaporation and splashing are expected.
Overcoming the matrix effects of liquid samples is the key to enabling LIBS applicability in environmental monitoring for water pollution. Some have tried enhancing the water surface hardness by freezing (Cáceres et al., 2001) or forming a jet flow (Cheri and Tavassoli, 2011). Others have modified the system by employing double-pulse laser (Zhao et al., 2019). However, complex preparation and equipment settings are the major drawbacks of those foregoing alternatives. Thus, our group has developed a simpler sample pre-treatment technique that relies on liquid-to-solid conversion (LSC) using adsorbent mediums (Iqhrammullah et al., 2021; Iqhrammullah et al., 2020a). Similar efforts have also been introduced by many studies (Fu et al., 2020; Lee et al., 2020; Lin et al., 2016; Nam et al., 2018; Ripoll et al., 2021; Wang et al., 2015), of which, the conversion carried out via drop-wising is the most practical requiring only small volume (micro level) of analyte solution (Rupiasih et al., 2013).
In this work, we used a polyurethane membrane – a scarcely used membrane for LSC in LIBS qualitative analysis. The membrane was prepared by employing castor oil (Ricinus communis L.) as the polyol source and toluene diisocyanate (TDI) as the isocyanate source (Marlina et al., 2020, 2017). To enable the attachment of analyte onto the membrane surface, a complexing agent, 1,10-fenantroline, was added as a filler (Nisah et al., 2021). The membrane produced has a hydrophobic characteristic derived from the castor oil properties (Iqhrammullah et al., 2020a; Marlina et al., 2019). The hydrophobicity contributes to the durability of the membrane along with its prominent mechanical strength and flexibility (Chakraborty and Chatterjee, 2020). More importantly, hydrophobic feature prevents the absorbance of water molecules from ambient air into the membrane. Low content of water could essentially reduce the water vapor-associated plasma quenching during LIBS analysis. Unfortunately, this hydrophobicity also hinders the analyte diffusion that is counterproductive to our objective.
The diffusion allows the analyte mobility across the entire membrane inner surface which is important for the homogeneity. Trans-membrane movement may depend on ion-ion interaction (Zhang et al., 2019). In a forward osmosis membrane, the draw solution’s ionic charges have been associated with the ion trans-membrane mobility (Irvine et al., 2013; Saiful et al., 2020). Thus, we hypothesized that a certain solution on one side of the membrane allows us to control the analyte diffusion from the other side of the membrane. For this purpose, we employed Pb ion as the ionic analyte model, as it is considered the most common heavy metal pollutant found in areas with intense industrial activities (El Azhari et al., 2017; Li et al., 2020; Yulianto et al., 2020). Prior to the wastewater treatment, concentration of Pb could reach hundreds of mg/L, and it is difficult for conventional method such as atomic absorption spectroscopy (AAS) as it requires multiple dilution. Hence, our method is proposed to monitor Pb concentration produced from the industrial activities. The study has a significance of employing a small amount of sample (as low as 100 μL), which contributes to the practicality of the proposed method.
2 Materials and methods
2.1 Materials
The main requirement in preparing polyurethane material is polyol and isocyanate sources. The polyol source used to prepare the membrane was industrial grade castor oil, extracted from Ricinus communis L. (purchased from PT. Rudang Jaya, Medan, Indonesia). As for the isocyanate source, this study employed toluene diisocyanate (TDI). To bind the analyte on the membrane surface 1,10-fenantroline was used as a complexing agent and acted as a filler. Other chemicals used in this study were HNO3, KOH, acetone and Pb(NO3)2. Otherwise mentioned, all the used chemicals were analytical grade and purchased from Merck (Selangor, Malaysia).
2.2 Preparation of hydrophobic polyurethane membrane
The substrate used in this study for liquid–solid conversion was castor oil-based polyurethane membrane (CPUM). The preparation employed a one-shoot method (Iqhrammullah et al., 2020b; Marlina et al., 2020), where castor oil (3.5 g) and 1,10-fenantroline (5 mg) were firstly mixed and stirred for 15 min at 250 rpm. The mixture was then added with 1.75 g TDI to obtain the doping solution, heated at 50 °C and 280 rpm for 15 min. The doping solution was sonicated using Crest Genesis™ XG-500–6 ultrasonic (40 kHz; 500 W) along with the addition of 2 g acetone. After it is completely dissolved in acetone, the solution was casted on a glass plate and heated in the oven at 40 °C for 24 h. The solid film membrane was then released from the glass plate with the help of acetone and left cold for 5 h. The CPUM was cut into a circle shape with diameter of 2 cm for further use. The preparation of CPUM has been illustrated in Scheme 1.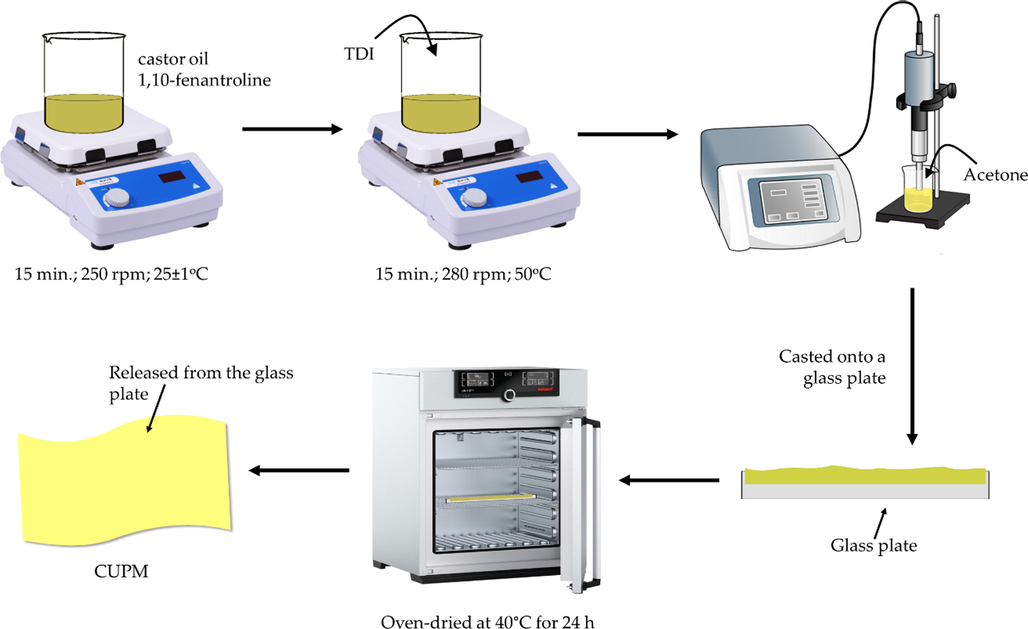
Preparation of CPUM from castor oil and TDI using one-shoot method.
2.3 Characterization
Prepared CPUM was characterized for its morphology using Jeol. Jsm-6510 LA scanning electron microscopy (SEM) (Tokyo, Japan), run at 10 kV with 20,000x magnification. Measurement of contact angle was performed on Biolin Scientific Attension Goniometer (Uusimaa, Finland) in triplicate, where the solution pH was adjusted to 7. Crater from the laser ablation was observed under Stereomicroscope Primo Star Zeiss (Jena, Germany) with 40x magnification. Total surface area and total pore volume of the priorly dried CPUM were determined based on Brunauer-Emmett-Teller (BET) and Barret-Joyner-Halenda (BJH) isotherms of adsorption–desorption of N2 at 77.3 K, performed on QuadraSorb Station 1 (ver. 5.06) (Quantachrome, FL, USA).
2.4 Analyte loading
Pb solution was prepared by diluting the Pb(NO3)2 stock solution into a desired concentration, ranging from 0.1 to 0.7 M. The pH of the analyte solution was maintained at 7 using KOH and HNO3. For the purpose of this investigation, we specify the two sides of the membrane; the back side and the front side. The back side was where the solution concentration remained constant, meanwhile at front side, the analyte concentration was varied. The Pb solution (0.1 M) and distilled water, as much as 100 μL, was exposed to the back side by drop-wising for 30 min. Membrane receiving Pb solution 0.1 M was labelled as CPUM0.1 and the one with distilled water was labelled as CPUM0. Afterwards, the analyte (100 μL) with a varied concentration was loaded onto the front side of the membrane by drop-wising and left for 30 min, before dried and stored for further analysis.
2.5 LIBS analysis
LIBS system used a 1064 nm Q-switched Nd:YAG laser (Quanta-Ray, LAB 130-10, USA) operating at 8 ns width and 10 Hz frequency. The laser beam was reflected toward the vertically positioned sample surface passing through a focus lens (170 mm). The sample was rotated at 5 rpm during the ablation. The signal from the plasma was recorded using an optical fibre located 5 cm from the sample and right angle to laser beam. The signal collected was then processed using a spectrometer (McPherson model 2061, focal length 1000 mm, f/8.6, Czerny Turner configuration) with an intensified charge-coupled device (ICCD) camera (Andor 117 iStar’ intensified CCD 1024 × 256 pixels, UK). Laser and ICCD camera were controlled using a digital delay generator (DDG 535, Stanford Research System, 119 USA). The system was run in air at 1 atm, where each run consists of 10 data accumulations.
3 Results and discussion
3.1 Characteristics of the polyurethane membrane
The CPUM produced from the one-shot method in this study had a thickness of around 0.017 ± 0.001 mm. Results from SEM investigation on the membrane surface from its front and back sides have been presented (Fig. 1a,b). The morphology of the membrane front side was similar to that of the back side, where both had smooth surface. The presence of randomly distributed pores was observed at both sides of the membrane with diameters reaching around 1.7 μm. Some of 1,10-fenantroline particles formed agglomerates which is observable at both sides of the membrane. Our current findings share a similarity with those from previously reported, such as the one synthesizing CPUM with red seaweed filler (Nurman et al., 2021). In our previous studies using 4,4′-diphenylmethane diisocyanate (MDI) as the isocyanate source, the surface morphology also appeared smooth along with a dense structure (Iqhrammullah et al., 2020; Iqhrammullah et al., 2020b).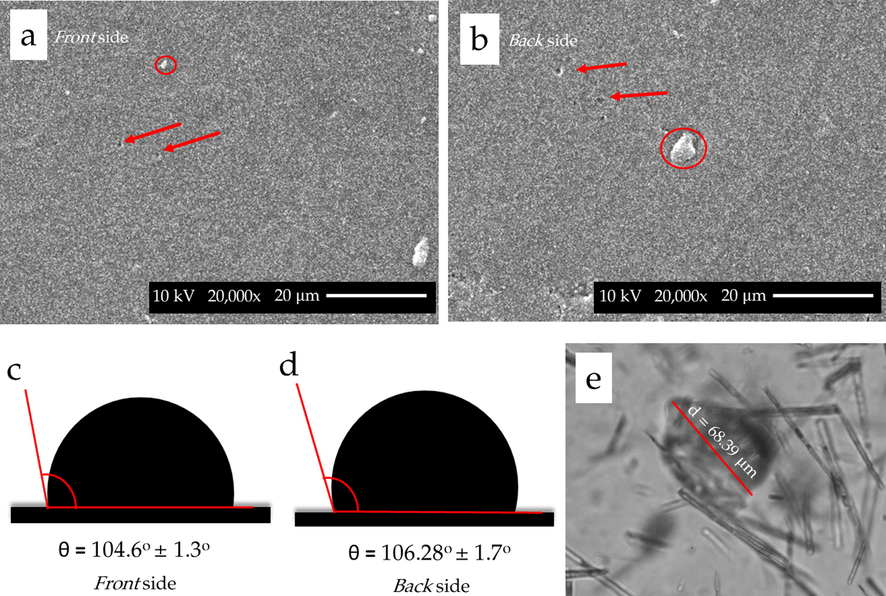
SEM images of the (a) front and (b) back sides of the membrane observed under 5,000x magnification. Red arrows and red circles indicate pores and 1,10-fenantroline agglomerates, respectively. Contact angle measured on the surface of (c) front and (d) back sides of the membrane measured at pH 7. (e) Crater created after the laser ablation on the membrane surface with the longest diameter of 68.39 μm.
The calculation using BET and BJH isotherm on the adsorption–desorption of N2 revealed that the membrane had a total surface area of 32.56 m2/g and a total pore volume of 0.035 cm3/g. These values are close to those reported in a study synthesizing polyurethane membrane prepared from MDI and Chaetomorpha Linum-derived polyol (Marlina et al., 2020). Based on the contact angle formed between the water droplet (pH 7) and the membrane surface, both the front and back sides had similar contact angle values of more than 90° (104.6°±1.3° and 106.28°±1.7°, respectively), confirming their hydrophobicity (Fig. 1c). Previously, a polyurethane foam made of castor oil-derived polyol was reported to have similar hydrophobicity (Vieira Amorim et al., 2021). However, CPUM was also reported with hydrophilic characteristic (contact angle < 90°) (Macalino et al., 2017). The author argued that the hydrophilicity was the results of the polymerization using aliphatic isocyanate – 1,6-hexamethylene diisocyanate (Macalino et al., 2017). Meanwhile, hydrophobic feature of castor oil-based polyurethane was obtained when cyclic isocyanate was used (Vieira Amorim et al., 2021), including that in this present study. In addition to the stated characteristics, the crater formed after laser ablation was also presented (Fig. 1e). The laser ablation was shown to have left a crater on the membrane surface with a diameter of 68.39 μm.
3.2 Optimization of LIBS parameters
In order to reduce the matrix effects, we studied and optimized the LIBS parameters viz delay time and laser energy. Delay time adjustment is used to discriminate the continuum noise resulted from hot plasma (Anabitarte et al., 2012). Longer delay time allows the signal to be captured where the continuum noise is at minimum. However, extending more delay time will allow the plasma to decay which eventually leads to lower intensity. To study this effect of delay time variation, the experiment was conducted at constant laser energy of 122 mJ. In our case (Fig. 2a), delay time of 1 μs is sufficient to distinguish the signal from analyte with that of continuum noise. Usually, the 3 μs was reported to be the optimum delay time for 1 atm open-air LIBS system (Marpaung et al., 2019). However, at 2 μs, the intensity decreased indicating the decay process (Fig. 2a). These different findings might be attributed to the differences in the membrane substrate properties that affect the plasma characteristics – known as substrate-based matrix effects.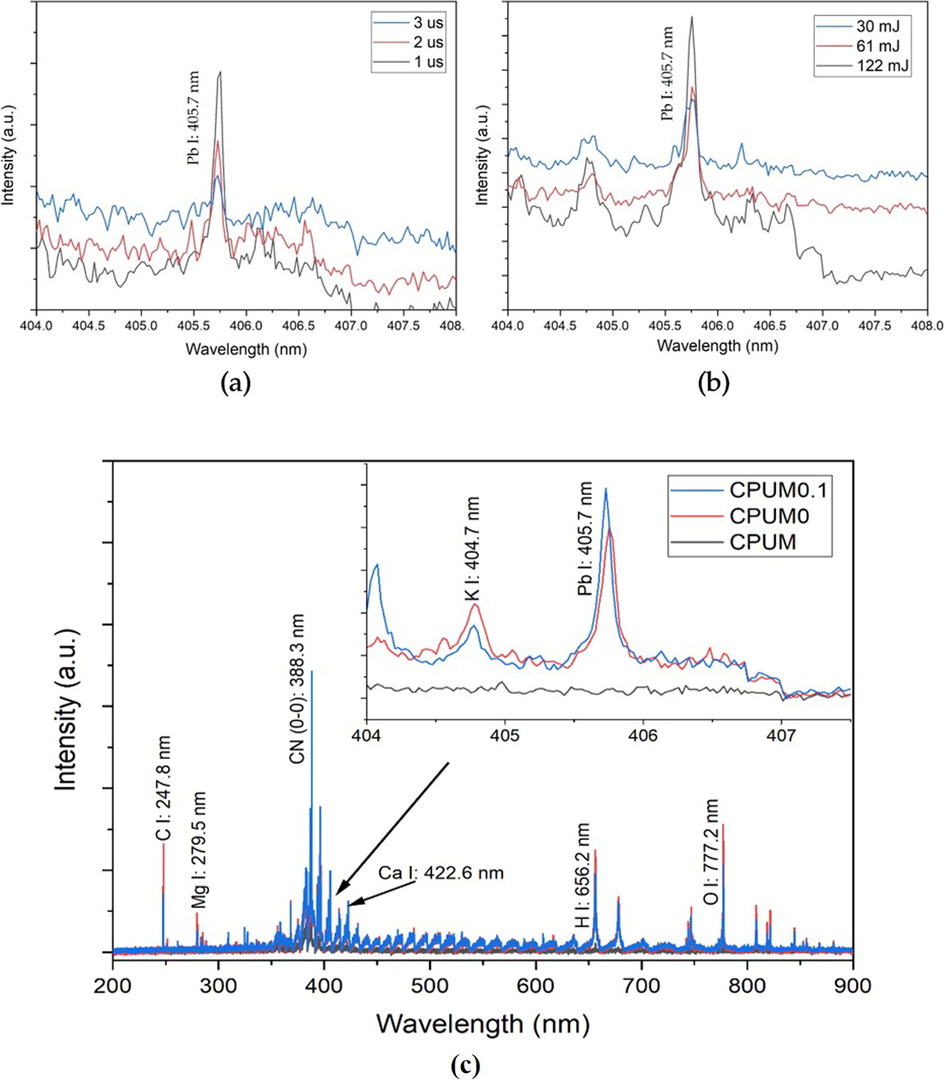
Spectra of Pb 0.7 M-loaded CPUM0.1 analyzed under different (a) delay times and (b) laser energy levels. Delay time variation was conducted at constant laser energy of 122 mJ and laser energy levels – at constant delay time of 1 μs. (c) Identification of elements contained in CPUM and Pb 0.7 M-loaded CPUM0 and CPUM0.1 based on LIBS spectral profile obtained at 1 μs and 122 mJ.
Other LIBS parameter optimized in this study is laser energy, as it determines the amount of ablated substrate. There is a give-and-take when it comes to this parameter; lower energy is less destructive and the noise could be kept minimum, but higher energy is required to generate higher signal intensity (Abdulmadjid et al., 2015). To study the influence of laser energy, the experiment was conducted at constant delay time of 1 μs. As shown in Fig. 2b, the highest laser energy level, 122 mJ, yielded the highest intensity with more background noise. However, the high intensity could compensate the background noise very well. The destruction level was also found to be tolerable against the membrane substrate, allowing us to perform multiple repetitions upon the analysis. Therefore, based on the explanation above, the optimum laser parameters taken for further investigations were 1 μs delay time and 122 mJ laser energy.
3.3 Qualitative analysis
LIBS is commonly used for its ability in simultaneously analyzing multiple elements in a substrate. We have conducted analyses on the CPUM0.1 and CPUM0 after the analyte loading with the highest concentration (0.7 M), then compared the spectra with that of pure membrane (CPUM) to qualitatively see whether the analyte could be attached to the membrane substrate (Fig. 2c). As shown, only loaded CPUM0.1 and CPUM0 generate the Pb I (405.7 nm) spectral line suggesting that the analyte has been embedded onto the membrane substrate. Other elements, such as K, Ca, and Mg were found to be present in the substrate which can be originated from the human skin contact (Yang and Yoh, 2018), the contaminated analyte solution, or impurities from the membrane ingredient. It is also interesting to note that the membrane is an organic substrate containing O, N, C, and H which give the spectra with a unique characteristic – possessing many molecular bands (Abdulmadjid et al., 2017; Marpaung et al., 2020). CN bands are among the most observable molecular bands, especially the CN (0–0) at 388.3 nm that has the tallest vibrational intensity.
3.4 Quantitative analysis
In order to perform a quantitative analysis, the membrane substrate should be loaded with a variation of analyte concentration ranging from 0.1 to 0.7 M. Higher analyte concentration consequently generate higher spectral intensity, observed from the LIBS spectra obtained from Pb-loaded CPUM0.1 (Fig. 3a) or CPUM0 (Fig. 3b). However, to overcome the uncertainty in LIBS measurement, normalizing the value with internal standard lines could be conducted (Wei et al., 2015). Herein, we selected the spectral lines from C and CN as they might be originated from the membrane and are not varied in concentration from one substrate to another (Iqhrammullah et al., 2020a). Other than the spectral lines, noise signal intensity could also be one of the options to compensate the uncertainty in LIBS. The noise signal was selected from the nearest vicinity of the Pb I (405.7 nm) spectral line. However, the contribution of other external or internal factors, such as CO2 from breathing and ambient N2, may affect the quality of the calibration curve as well. This is why we conducted the investigation by constructing the calibration curve using all possible normalization.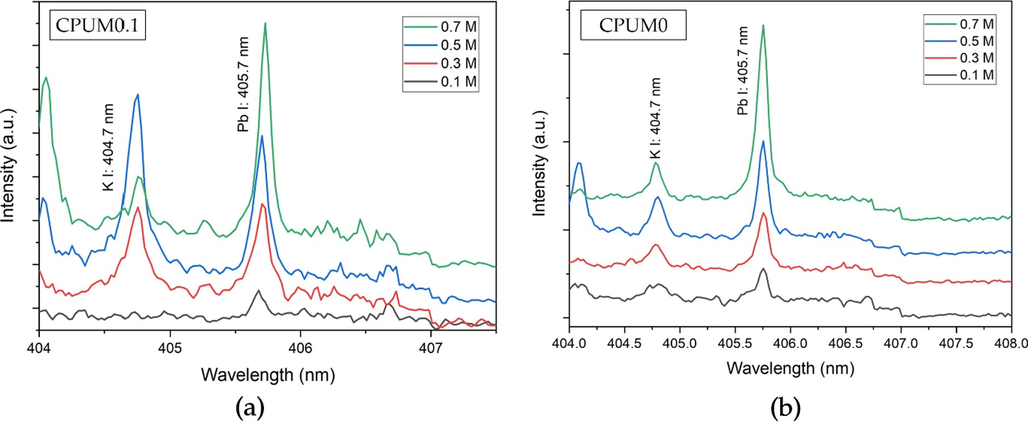
Pb I (405.7 nm) LIBS spectral lines after the loading of analyte with different concentrations onto (a) CPUM0.1 and (b) CPUM0.
In the case of CPUM0.1, among the four callibration curve models, the correlation (R2) closest to 1 was found from the one constructed based on Pb I (405.7 nm) spectral line intensity (Fig. 4a). Poorer correlation was observed when the normalization was conducted. Therefore, we concluded that the generated Pb spectral line was stable and requiring no further normalization using internal standard lines.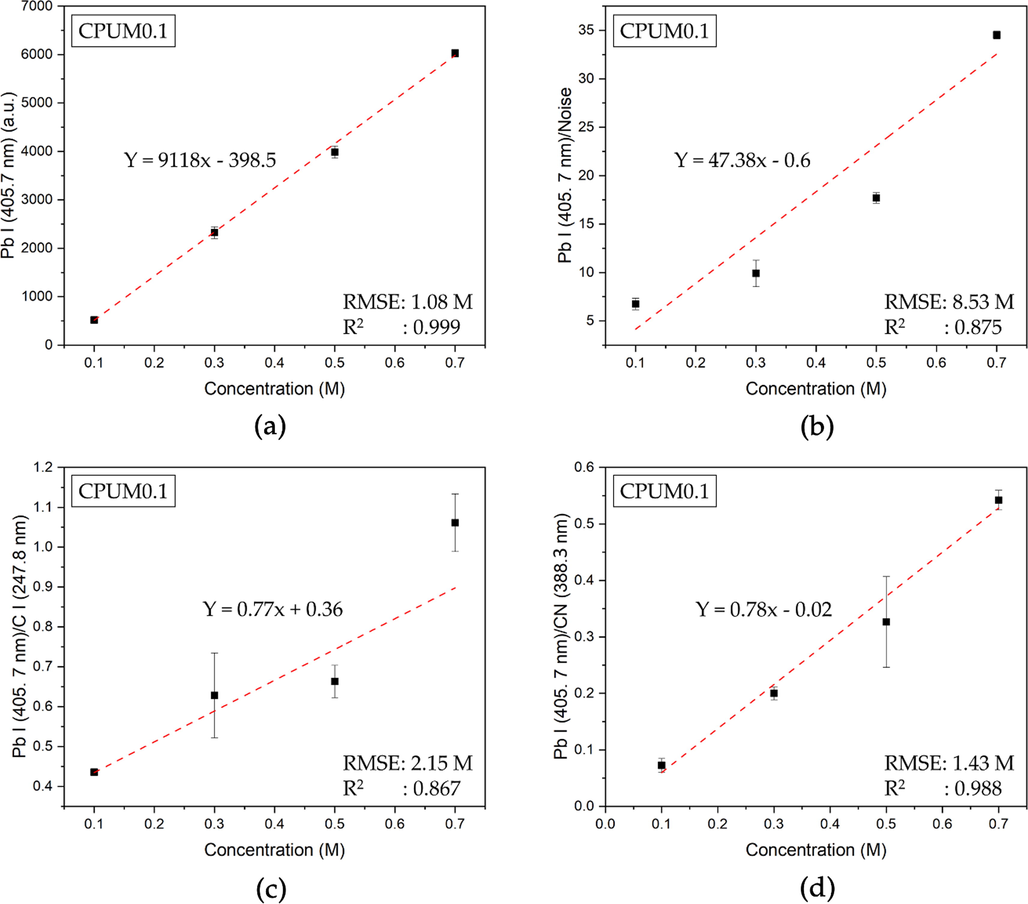
Calibration curve for aqueous Pb analysis using (a) Pb I (405.7 nm), (b) Pb I (405.7 nm)/Noise, Pb I (405.7 nm) /C I (247.8 nm), and Pb I (405.7 nm)/ CN (388.3 nm) y-axes based on the LIBS spectra of CPUM0.1.
In contrast with CPUM0, the best correlation was obtained from the ratio of Pb I (405.7 nm) and C I (247.8 nm) spectral lines (Fig. 5c). If the uncertainty was caused by the unstable fluence or plasma temperature, the similar phenomenon should be expected in the case of CPUM0.1. This difference lead us to question the role of analyte interraction with the surface of membrane substrate. In our previously conducted investigation (Iqhrammullah et al., 2021), we found that the different analyte interraction could be observed by varying the laser energy. In another previous study, we also found that Pb may form a multilayer interraction (Iqhrammullah et al., 2020b), where dissolved Pb particles are piled up in one binding site creating a distance to the surface (Chen et al., 2019; Rahmi et al., 2021). As a consequence, the particles are less attracted to the surface and become unstable, which is then sensitive to the change of plasma temperature. In the next section, we will further discuss the probable causes of the interaction attributed to the administration of Pb solution onto the back side of the membrane (CPUM0.1).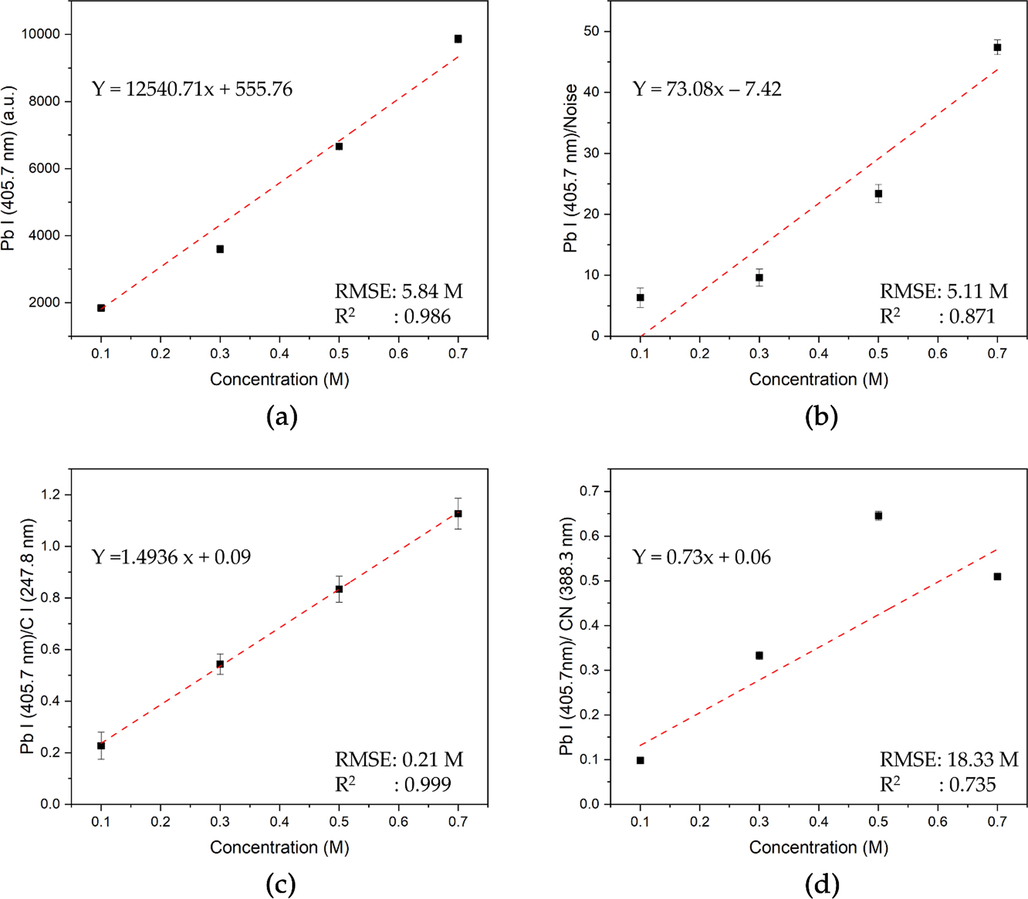
Calibration curve for aqueous Pb analysis using (a) Pb I (405.7 nm), (b) Pb I (405.7 nm)/Noise, Pb I (405.7 nm) /C I (247.8 nm), and Pb I (405.7 nm)/ CN (388.3 nm) y-axes based on the LIBS spectra of CPUM0.
The comparison of analytical parameters obtained from each calibration curve from CPUM0.1 and CPUM0 has been presented (Table 1). A good quality calibration curve can be determined by high correlation (R2) value and low root-mean-square errors (RMSE) value. In CPUM0.1, the calibration curve with Pb I (405.7 nm) as the y-axis has the highest R2 (0.999) and the lowest RMSE (1.08 M). Therefore, the limit of detection (LOD) was calculated based on the calibration curve with the formula of three times blank reference standard deviation divided by the slope. The LOD was obtained to be 8.9 × 10⁻⁴ M or 184.2 mg/L. As for the CPUM0, by employing the same calculation on the calibration curve with Pb I (405.7 nm) intensity as the y-axis (R2 = 0.986; RMSE = 5.84 M), the LOD was obtained to be 6.5 × 10⁻⁴ M or 134.53 mg/L, which is better than that of CPUM0.1. This is due to the fact that the CPUM0 has higher Pb emission, whereas at the analyte concentration of 0.1 M, the spectral line intensity has reached 1840.92 a.u. Meanwhile, in CPUM0.1, the average intensity of Pb I (405.7 nm) spectral line was only 519.05 a.u. SC = sample concentration, CC = calculated concentration, RMSE = root-mean-square-errors.
Y-axis
CPUM0.1
CPUM0
SC (M)
CC ± Error (M)
RMSE (M)
R2
SC (M)
CC ± Error (M)
RMSE (M)
R2
Pb I (405.7 nm)
0.1
0.10 ± 0.07
1.08
0.999
0.1
0.13 ± 0.22
5.84
0.986
0.3
0.30 ± 0.06
0.3
0.26 ± 0.20
0.5
0.48 ± 0.06
0.5
0.49 ± 0.20
0.7
0.71 ± 0.05
0.7
0.72 ± 0.18
Pb I (405.7 nm) /Noise
0.1
0.17 ± 0.57
8.53
0.875
0.1
0.18 ± 0.56
5.11
0.871
0.3
0.24 ± 0.54
0.3
0.22 ± 0.55
0.5
0.41 ± 0.52
0.5
0.42 ± 0.52
0.7
0.78 ± 0.45
0.7
0.78 ± 0.40
Pb I (405.7 nm) /C I (247.8 nm)
0.1
0.13 ± 0.63
2.15
0.867
0.1
0.10 ± 0.03
0.21
0.999
0.3
0.33 ± 0.56
0.3
0.31 ± 0.03
0.5
0.36 ± 0.55
0.5
0.50 ± 0.03
0.7
0.78 ± 0.84
0.7
0.70 ± 0.04
Pb I (405.7 nm) / CN (388.3 nm)
0.1
0.12 ± 0.25
1.43
0.988
0.1
0.01 ± 1.08
18.33
0.735
0.3
0.29 ± 0.22
0.3
0.32 ± 0.98
0.5
0.45 ± 0.22
0.5
0.72 ± 1.08
0.7
0.73 ± 0.19
0.7
0.55 ± 1.01
Indeed, some research groups have reached LOD in parts per billion levels (Lin et al., 2016; Ripoll et al., 2021), suggesting that our system still needs improvement. Our current investigations (Iqhrammullah et al., 2021; Iqhrammullah et al., 2020a), along with some others (Lee et al., 2012; Schmidt and Goode, 2002; Zhu et al., 2012), obtained the LODs within 1 – 10 mg/L range. Other published studies reported LODs exceeding more than 20 mg/L in their systems (Horňáčková et al., 2019; Suyanto et al., 2016; Terán et al., 2019; Yang et al., 2018). Taken altogether, our system is still not a match to the previously mentioned studies in term of the sensitivity (LOD). Nonetheless, our system is potentially more practical because it only requires a small volume of analyte (<100 μL). Based on the current results, our proposed method could be useful for Pb monitoring in industrial setting. Moreover, in forensic investigation (where the analyte is typically available in a small amount) the method proposed herein could be useful, especially by considering the fact that acute toxicity of Pb could only be induced if the concentration is high (reaching hundreds of mg/L) (Besser et al., 2005). Further studies will be carried out to lower the LOD of our system. One of the alternatives to improve the analytical performance of our system in the future research is by constructing a non-linear calibration curve as reported previously (Zhou et al., 2021).
3.5 Analyte mobility and diffusion
Previously, we have explained that the Pb ions are stacked in multilayer on a binding site of the membrane surface. It may be due to the fact that mobility of Pb solution was restricted inside the membrane due to the hydrophobic nature of the membrane. As a result, Pb was unable to diffuse into the deeper side of the membrane and became concentrated. This condition permits the Pb analyte to have multilayer interaction with the membrane surface. On the contrary, when Pb solution was applied on the other side of the membrane, it consequently eased the analyte mobility allowing the ions to be homogeneously distributed on the membrane surface preventing the multilayer interaction.
To prove this theory, we had conducted an investigation on the back side of the membrane (Fig. 6). Pb emission was only detected on the CPUM0.1 (Fig. 6a), where its intensity corresponds to the analyte loading concentration. It means Pb moved from the front side to the back side, where the other Pb ions were present. As for CPUM0 (Fig. 6b), there might be a small concentration of Pb that passed through the membrane layers, but it was not sufficient to generate the signal that is three times higher than noise intensity. This investigation proves that the diffusion has been enhanced in CPUM0.1.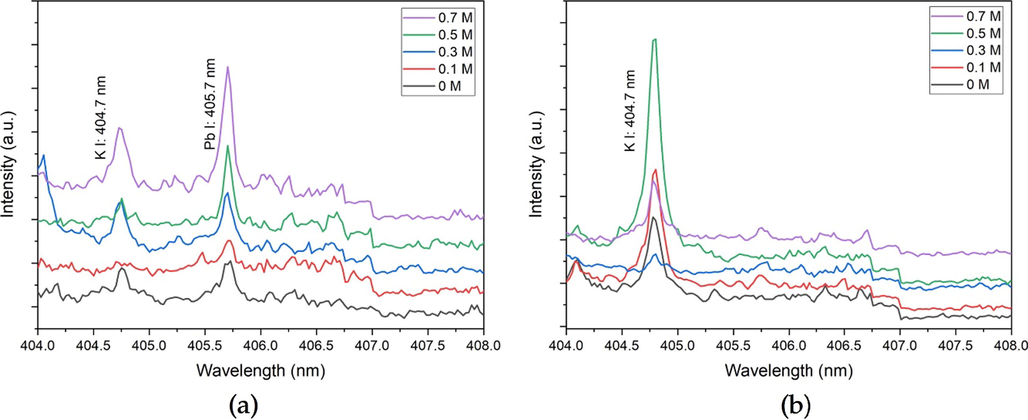
Pb I (405.7 nm) LIBS spectral lines obtained from the laser shot (1 μs; 122 mJ) at the back-sides of (a) CPUM0.1 and (b) CPUM0 with different drop-wised analyte loading concentrations.
A clearer depiction of the changes of Pb emission intensity obtained from the ablation of the back side surface of the membrane, affected by the analyte loading with varied concentration, can be seen in Fig. 7. Interestingly, without the presence of Pb on the other side (distilled water), the Pb mobility was constrained, associated with higher spectral intensity. It is also supported by our previous findings that CPUM0 yielded higher intensity of Pb I (405.7 nm) spectral emission. Nonetheless, due to unstable interaction between the analyte and membrane surface, the errors are higher. Therefore, even though the LOD might be worse, controlling the analyte – substrate interaction is also important to obtain a stable and accurate measurement. Indeed, this problem could be overcome by normalization using internal standard line just like we did in this study. However, there are several cases where it is not possible, for instance, sample containing high organic materials may change the total carbon concentration.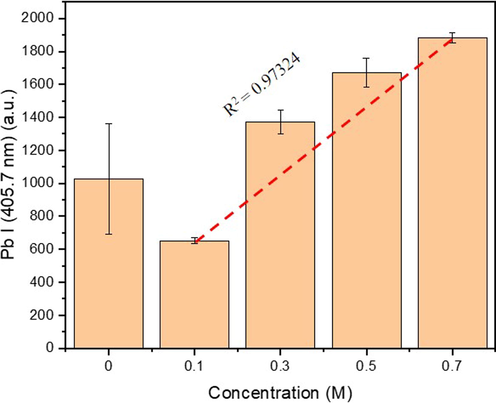
Spectral intensities of Pb I (405.7 nm) line obtained from the laser shot (1 μs; 122 mJ) at the back-sides of CPUM0.1 with different drop-wised analyte loading concentrations. The red-dashed line is the theoretical data indicating the correlation between the analyte loads and the spectral line intensity.
The above stated results were further confirmed by investigating the spatial distribution of Pb analyte in the CPUM0.1 and CPUM0, where the data have been presented in Table 2. Spatial distribution was investigated by allowing the laser shot to target a pre-determined spot with a variation of distances from the center (0–0.6 cm). We found even distribution of Pb analyte in CPUM0.1, proven by the statistical insignificance (P = 0.2279). On contrary, CPUM0 system had a significant variation of Pb I (405.7 nm) intensities (P = 0.003). These data suggest that analysis using CPUM0.1 system had a better precision. Number of shots were roughly calculated by ablation duration (2 s) multiplied by laser frequency (10 Hz). P-value was obtained from one-way ANOVA. * significant at P < 0.05. ** very significant at P < 0.001. (-) not detected, the intensity could not be distinguished from the noise (3 times higher than noise). NA: not applicable.
Experiment
Pb I (405.7 nm) intensity (a.u.)
CPUM0.1
CPUM0
Spatial distribution, distance from the center (cm)
0
7110.67 ± 61.33
8569.33 ± 114.52
0.2
7027.22 ± 66.1
9027.21 ± 180.42
0.3
7039.33 ± 56.58
7413.38 ± 234.27
0.4
7190.82 ± 66.64
8394 ± 218.1
0.5
7113.67 ± 56.05
8133.61 ± 163.57
0.6
7143.33 ± 61
8372.47 ± 119.6
P-value
0.2279
0.003*
Depth profile, number of shots
20
7168
9048
40
5801
–
60
2695
–
P-value
<0.001**
NA
Depth profile of Pb contained in CPUM0.1 and CPUM0 has been presented (Table 2). The investigation was carried out on the same ablated surface for 3 runs, where each run lasted for around 2 s. Hence, we were able to calculate that each run should consist of 20 laser shots. As can be seen in Table 2, reduction of the Pb I (405.7 nm) intensity fell greatly (P < 0.001) after the second run (40 shots) and further depleted following the third run (60 shots). As in the case of CPUM0, Pb I (405.7 nm) was immediately undetectable in the second run. Taken altogether, these data corroborate the Pb analyte mobility in the CPUM0.1, where on the contrary, the Pb analyte was more likely to be retained on the front side of CPUM0.
4 Conclusion
Diffusion of micro-volume Pb2+ analyte into a hydrophobic membrane surface during the LCS could be controlled by applying either distilled water or ionic solution. Preventing the analyte diffusion which could lead to the enhancement of analyte on the membrane surface via multilayer binding, where it could be achieved by applying distilled water on the other side of the membrane. On contrary, diffusion could be promoted if the back side of the membrane was administered with an ionic solution. It is still unclear whether the ionic solution should be the same with that of the analyte. Further investigations need to carry out to elucidate other factors which could affect the diffusion of micro-volume analyte into a hydrophobic membrane.
Acknowledgement
The authors wish to thank the Laboratory of Optics and Laser Application at the Department of Physics, Universitas Syiah Kuala, for the LIBS instrument. Authors also wish to appreciate the help from Firman M. Nur from Faculty of Marine and Fisheries, Universitas Syiah Kuala, for the microscopy analysis.
Funding
Self.
References
- Abdulmadjid, S.N., Meilina, H., Hedwig, R., Kurniawan, K.H., 2017. Elemental detection of arabica and robusta green bean coffee using laser-induced plasma spectroscopy. p. 050001. doi: 10.1063/1.4973099.
- Sensitive analysis of carbon, chromium and silicon in steel using picosecond laser induced low pressure helium plasma. Spectrochim. Acta Part B At. Spectrosc.. 2015;114:1-6.
- [CrossRef] [Google Scholar]
- Laser-induced breakdown spectroscopy: fundamentals, applications, and challenges. ISRN Spectrosc.. 2012;2012:285240
- [CrossRef] [Google Scholar]
- Acute and chronic toxicity of lead in water and diet to the amphipod Hyalella azteca. Environ. Toxicol. Chem.. 2005;24:1807.
- [CrossRef] [Google Scholar]
- Quantitative analysis of trace metal ions in ice using laser-induced breakdown spectroscopy. Spectrochim. Acta Part B At. Spectrosc.. 2001;56:831-838.
- [CrossRef] [Google Scholar]
- Polymers and composites derived from castor oil as sustainable materials and degradable biomaterials: current status and emerging trends. Biomacromolecules. 2020;21:4639-4662.
- [CrossRef] [Google Scholar]
- Adsorption property of Pb(II) by the laterite-bentonite mixture used as waste landfill liner. Adv. Civ. Eng.. 2019;2019:1-11.
- [CrossRef] [Google Scholar]
- Quantitative analysis of toxic metals lead and cadmium in water jet by laser-induced breakdown spectroscopy. Appl. Opt.. 2011;50:1227.
- [CrossRef] [Google Scholar]
- Pollution and ecological risk assessment of heavy metals in the soil-plant system and the sediment-water column around a former Pb/Zn-mining area in NE Morocco. Ecotoxicol. Environ. Saf.. 2017;144:464-474.
- [CrossRef] [Google Scholar]
- Determining available potassium in soil by laser-induced breakdown spectroscopy combined with cation exchange membrane adsorption. J. Anal. At. Spectrom. 2020
- [CrossRef] [Google Scholar]
- Critical review and advices on spectral-based normalization methods for LIBS quantitative analysis. Spectrochim. Acta Part B At. Spectrosc.. 2019;160:105688
- [CrossRef] [Google Scholar]
- Heavy metals detection in zeolites using the LIBS method. Atoms. 2019;7:98.
- [CrossRef] [Google Scholar]
- Laser induced breakdown spectroscopy methods and applications: a comprehensive review. Radiat. Phys. Chem.. 2020;170:108666
- [CrossRef] [Google Scholar]
- Shock wave plasma generation in low pressure ambient gas from powder sample using subtarget supported micro mesh as a sample holder and its potential applications for sensitive analysis of powder samples. Microchem. J.. 2018;142:108-116.
- [CrossRef] [Google Scholar]
- Iqhrammullah, M., Marlina, Hedwig, R., Karnadi, I., Kurniawan, K.H., Olaiya, N.G., Mohamad Haafiz, M.K., Abdul Khalil, H.P.S., Abdulmadjid, S.N., 2020a. Filler-modified castor oil-based polyurethane foam for the removal of aqueous heavy metals detected using laser-induced breakdown spectroscopy (LIBS) technique. Polymers (Basel) 12, 903. doi: 10.3390/polym12040903.
- Iqhrammullah, M, Marlina, Nur S., 2020. Adsorption behaviour of hazardous dye (methyl orange) on cellulose-acetate polyurethane sheets. IOP Conf. Ser. Mater. Sci. Eng. 845, 012035. doi: 10.1088/1757-899X/845/1/012035.
- Iqhrammullah, M., Suyanto, H., Rahmi, Pardede, M., Karnadi, I., Kurniawan, K.H., Chiari, W., Abdulmadjid, S.N., 2021. Cellulose acetate-polyurethane film adsorbent with analyte enrichment for in-situ detection and analysis of aqueous Pb using Laser-Induced Breakdown Spectroscopy (LIBS). Environ. Nanotechnol. Monit. Manag. 16, 100516. doi: 10.1016/j.enmm.2021.100516.
- Characterization and performance evaluation of cellulose acetate-polyurethane film for lead II ion removal. Polymers (Basel). 2020;12:1317.
- [CrossRef] [Google Scholar]
- Ion selective permeation through cellulose acetate membranes in forward osmosis. Environ. Sci. Technol.. 2013;47:13745-13753.
- [CrossRef] [Google Scholar]
- Fast and simple selenium speciation by solid phase extraction and laser-induced breakdown spectroscopy. J. Anal. Sci. Technol.. 2020;11:27.
- [CrossRef] [Google Scholar]
- Laser-induced breakdown spectroscopy (LIBS) of heavy metal ions at the sub-parts per million level in water. Appl. Spectrosc.. 2012;66:1385-1396.
- [CrossRef] [Google Scholar]
- Health risk assessment of metals (Cu, Pb, Zn, Cr, Cd, As, Hg, Se) in angling fish with different lengths collected from Liuzhou, China. Int. J. Environ. Res. Public Health. 2020;17:2192.
- [CrossRef] [Google Scholar]
- Ultra-trace metallic element detection in liquid samples using laser induced breakdown spectroscopy based on matrix conversion and crosslinked PVA polymer membrane. J. Anal. At. Spectrom.. 2016;31:1622-1630.
- [CrossRef] [Google Scholar]
- Castor oil based polyurethanes: synthesis and characterization. IOP Conf. Ser. Mater. Sci. Eng.. 2017;229:012016
- [CrossRef] [Google Scholar]
- Marlina, Iqhrammullah, M., Saleha, S., Fathurrahmi, Maulina, F.P., Idroes, R., 2020. Polyurethane film prepared from ball-milled algal polyol particle and activated carbon filler for NH3–N removal. Heliyon 6, e04590. doi: 10.1016/j.heliyon.2020.e045900.
- Marlina, Iqhrammullah, M., Darmadi, Mustafa, I., Rahmi, 2019. The application of chitosan modified polyurethane foam adsorbent. RASĀYAN J. Chem. 12, 494–501. doi: 10.31788/RJC.2019.1225080.
- Synthesis and characterization new polyurethane membrane from hydroxylated rubber seed oil. Orient. J. Chem.. 2017;33:199-206.
- [CrossRef] [Google Scholar]
- Emission spectrochemical analysis of soft samples including raw fish by employing laser-induced breakdown spectroscopy with a subtarget at low-pressure helium gas. ACS Omega. 2020;5:16811-16818.
- [CrossRef] [Google Scholar]
- Quantification of rare earth elements with low pressure laser induced breakdown spectroscopy employing subtarget supported micro mesh sample holder. J. Laser Appl.. 2019;31:032001
- [CrossRef] [Google Scholar]
- Feasibility of separation and quantification of inorganic arsenic species using ion-exchange membranes and laser-induced breakdown spectroscopy. Anal. Lett.. 2018;51:2835-2848.
- [CrossRef] [Google Scholar]
- Nasution, A.M., Wicaksono, P.E., Suyanto, H., 2019. Determination of coffee bean’s moisture content using laser-induced breakdown spectroscopy (LIBS), in: Hatta, A.M., Nasution, A.M. (Eds.), Third International Seminar on Photonics, Optics, and Its Applications (ISPhOA 2018). SPIE, p. 9. doi: 10.1117/12.2503362.
- Nisah, K., Ramli, M., Marlina, Idroes, R., Safitri, E., 2021. Study of linearity and stability of Pb(II)-1,10-phenanthroline complex with the presence of Fe (II) dan Mg (II) matrix ions using UV-Vis spectrophotometry. IOP Conf. Ser. Mater. Sci. Eng. 1087, 012052. doi: 10.1088/1757-899X/1087/1/012052.
- Synthesis of polyurethane membranes derived from red seaweed biomass for ammonia filtration. Membranes (Basel). 2021;11:668.
- [CrossRef] [Google Scholar]
- Rahmi, Iqhrammullah, M., Audina, U., Husin, H., Fathana, H., 2021. Adsorptive removal of Cd (II) using oil palm empty fruit bunch-based charcoal/chitosan-EDTA film composite. Sustain. Chem. Pharm. 21, 100449. doi: 10.1016/j.scp.2021.100449.
- Evaluation of thin film microextraction for trace elemental analysis of liquid samples using LIBS detection. Talanta. 2021;223:121736
- [CrossRef] [Google Scholar]
- Rupiasih, N.N., Suyanto, H., Sumadiyasa, M., Purwanto, C.P., Purnomo, R.R., 2013. Study of filtering Ag liquid sample by chitosan biomembrane using laser-induced breakdown spectroscopy (LIBS). pp. 32–35. doi: 10.1063/1.4820987.
- Development of chitosan/starch-based forward osmosis water filtration bags for emergency water supply. Membranes (Basel). 2020;10:414.
- [CrossRef] [Google Scholar]
- Analysis of aqueous solutions by laser-induced breakdown spectroscopy of ion exchange membranes. Appl. Spectrosc.. 2002;56:370-374.
- [Google Scholar]
- Study of adsorption Ag and Pb in liquid sample using Berea sandstone by commercial laser-induced breakdown spectroscopy (LIBS) J. Phys. Conf. Ser.. 2016;776:012107
- [CrossRef] [Google Scholar]
- Assessment of sorption capability of montmorillonite clay for lead removal from water using laser–induced breakdown spectroscopy and atomic absorption spectroscopy. Microchem. J.. 2019;144:159-165.
- [CrossRef] [Google Scholar]
- Vieira Amorim, F., José Ribeiro Padilha, R., Maria Vinhas, G., Ramos Luiz, M., Costa de Souza, N., Medeiros Bastos de Almeida, Y., 2021. Development of hydrophobic polyurethane/castor oil biocomposites with agroindustrial residues for sorption of oils and organic solvents. J. Colloid Interface Sci. 581, 442–454. doi: 10.1016/j.jcis.2020.07.091.
- Simple, fast matrix conversion and membrane separation method for ultrasensitive metal detection in aqueous samples by laser-induced breakdown spectroscopy. Anal. Chem.. 2015;87:5577-5583.
- [CrossRef] [Google Scholar]
- Quantitative determination of Cr in ink by laser-induced breakdown spectroscopy(LIBS) using ZnO as adsorbent. Chem. Res. Chinese Univ.. 2015;31:909-913.
- [CrossRef] [Google Scholar]
- Spreading a water droplet through filter paper on the metal substrate for surface-enhanced laser-induced breakdown spectroscopy. Opt. Express. 2018;26:30456.
- [CrossRef] [Google Scholar]
- Forensic discrimination of latent fingerprints using laser-induced breakdown spectroscopy (LIBS) and chemometric approaches. Appl. Spectrosc.. 2018;72:1047-1056.
- [CrossRef] [Google Scholar]
- Heavy metals (Cd, Pb, Cu, Zn) in green mussel (perna viridis) and health risk analysis on residentsof semarang coastal waters, Central Java, Indonesia. Asian J. Water Environ. Pollut.. 2020;17:71-76.
- [CrossRef] [Google Scholar]
- Zahroh, A., Nasution, A.M., Suyanto, H., 2019. The analysis of calcium contained in saliva due to smoking habits: using laser-induced breakdown spectroscopy (LIBS), in: Hatta, A.M., Nasution, A.M. (Eds.), Third International Seminar on Photonics, Optics, and Its Applications (ISPhOA 2018). SPIE, p. 32. doi: 10.1117/12.2504816.
- Controllable ion transport by surface-charged graphene oxide membrane. Nat. Commun.. 2019;10:1253.
- [CrossRef] [Google Scholar]
- Quantitative analysis of Pb in soil by femtosecond-nanosecond double-pulse laser-induced breakdown spectroscopy. Results Phys.. 2019;15:102736
- [CrossRef] [Google Scholar]
- Real-time monitoring of carbon concentration using laser-induced breakdown spectroscopy and machine learning. Opt. Express. 2021;29:39811.
- [CrossRef] [Google Scholar]
- Laser-induced breakdown spectroscopy for determination of trace metals in aqueous solution using bamboo charcoal as a solid-phase extraction adsorbent. Anal. Methods. 2012;4:819.
- [CrossRef] [Google Scholar]


