

Translate this page into:
Conventional and ultrasound-assisted methods for extraction of bioactive compounds from red araçá peel (Psidium cattleianum Sabine)
⁎Corresponding author. jamilezeni@uricer.edu.br (Jamile Zeni)
-
Received: ,
Accepted: ,
This article was originally published by Elsevier and was migrated to Scientific Scholar after the change of Publisher.
Peer review under responsibility of King Saud University.
Abstract
The present study aimed to maximize the conventional extraction and compare it with the ultrasound-assisted method for extracting bioactive compounds obtained from the red araçá peel. The behavior of anthocyanins related to the pre-treatment of the vegetal matrix, employed solvent, extraction kinetics of both methods, the levels of total phenolic compounds, flavonoids and carotenoids, as well as the antioxidant activity were evaluated. The ultrasound-assisted extraction (40 KHz −154 W and 90 min) had an increase of 12% in the levels of anthocyanins (121.85 Eq. mg of cyanidin-3-glycoside/100 g of peel) and a 25% reduction in time extraction compared to conventional extraction by maceration (116.81 Eq. mg of cyanidin-3-glycoside/100 g of peel) using 90% ethanol, for 2 h, pH 1.5, at 40 °C and mass/volume ratio 1 g/10 mL). Analyses of the total phenolic compounds, flavonoids and carotenoids presented promising results for the ultrasound-assisted and conventional extractions, respectively. Analyzes of total phenolic compounds, flavonoids and carotenoids, show promising results for ultrasound-assisted extractions, respectively, indicating that red araçá is rich in bioactive compounds beneficial to human health, in addition to being considered natural pigments that can be used in food.
Keywords
Cyanidin-3-glycoside
Phenolic compounds
Experimental design
Ultrasound-assisted extraction
Conventional extraction

1 Introduction
The relationship between nutrition quality and health has been extensively studied and is a matter of great interest. There are substantial evidences of beneficial effects attributed to fruit and vegetables-rich diets (Denardin et al., 2015). Brazil has a great biological diversity that can be explored to yield extracts for therapeutic applications to control and/or prevent chronic diseases. Polyphenols from fruits and vegetables (Manach et al., 2004) can be divided into several classes such as hydroxybenzoic acids, hydroxycinnamic acids, anthocyanins, proanthocyanidins, flavonols, flavones, flavanones, isoflavones, stilbenes, and lignans. They markedly contribute to the antioxidant effect of many small-fruited species and have potential healthful effects (Denardin et al., 2015).
As regards to the brazilian native flora, the Myrtaceae family is highlighted by presenting species that produce small fruits only consumed by local population and wild animals and are found from the Amazonas state up to south of the country (Santos et al., 2007). The red araçá (Psidium cattleianum Sabine) is a fruit belonging to Myrtaceae family characterized by a globose shape, slightly acidic succulent pulp and numerous seeds. It is also rich in bioactive compounds, presenting high levels of phenolic substances, vitamin C and unsaturated fatty acids (Reissig et al., 2016).
Bioactive compounds or phytochemicals are substances derived from the secondary metabolism of vegetables and are beneficial to human health. Among them, anthocyanins deserve a special focus for being considered natural pigments that may be utilized in food processing, besides being potential agents in preventing diseases (Das et al., 2017).
Extraction is one of the most used processes to obtain bioactive compounds, where a solvent acts in the vegetable cellular structure removing the interest substance (Dalla Nora et al., 2014). Among the most common extraction methods are the maceration and percolation (conventional extraction) and those considered as non-conventional methodologies, including the ultrasound-assisted (Tao et al., 2014; Krishnan et al., 2015), liquid-pressurized (Garcia-Mendoza et al., 2017), supercritical fluid (Valadez-Carmona et al., 2018), microwave assisted extraction, ohmic heating assisted extraction; ultrasound assisted microwave extraction and ultrasound assisted ohmic heating extraction (Rawson et al., 2011; Rawson et al., 2012; Janghu et al., 2017; Sengar et al., 2019).
The ultrasound-assisted extraction process has the advantages of being considered a technology labeled green; higher yield and selectivity of bioactive compounds, in addition to less time and energy spent on extraction, easier operation and lower cost when compared to other modern methods (Wang and Weller, 2006; Trusheva et al., 2007; Lianfu and Zelong, 2008; Pingret et al., 2012; Rombaut et al., 2014; Sforcin, 2016; Pradal et al., 2016; Oroian et al., 2020a, 2020b).
Ultrasound can be used for the extraction of bioactive compounds, since the energy generated produces cavitation, which increases the mass transfer rates in the process. This phenomenon occurs with the formation of bubbles that collapse explosively on the surface of the vegetable material, leading to a pressure that breaks the tissue and releases the compounds (Ralet et al., 2003; Teh and Birch, 2014; Asfaram et al., 2018; Dil et al., 2019a, 2019b, 2019c; Asfaram et al., 2019; Oroian et al., 2020a, 2020b).
While the extraction by conventional methods spend a larger volume of solvent and time to obtain results, the non-conventional methodologies are proving to be more effective by reducing these parameters (Corbin et al., 2015). The variables of a process can be determined through different forms; in this sense the experimental planning tool has demonstrated advantages, such as fewer experiments to evaluate the effect of parameters and their interactions, generating a mathematical model that describes the processes (Das et al., 2017, Ramic et al., 2015).
The ultrasound-assisted extraction process is already used in assays of bioactive compounds from different plant matrices (Bashi et al., 2012; Majd et al., 2014; Al-Dhabi et al., 2017; Deng et al., 2017; Hilbig et al., 2018; Nipornram et al., 2018; Arruda et al., 2019). However, in relation to araçá, there are some studies that determine bioactive compounds (Dalla Nora et al., 2014, Biegelmeyer et al., 2011, Medina et al., 2011, MCcook-russell et al., 2012), however of extraction comparing the conventional method and the aid by ultrasound are still little explored. Thus, the objective of the present study was to compare the extraction of bioactive compounds from the bark of red araçá (Psidium cattleianum Sabine) by the methods of maceration (conventional) and assisted by ultrasound. The behavior of anthocyanins in relation to the pre-treatment of the plant matrix (drying), or the oil used, an extraction kinetics of both methods were applied, or the content of total phenolic compounds, flavonoids and carotenoids, as well as an antioxidant activity.
2 Materials and methods
2.1 Harvesting, preparation and chemical characterization of the red araçá peel
The red araçá fruits (Psidium cattleainum Sabine) were daily harvested from January to March 2016 (summer), at coordinates −27.841692°, −52.302515°, Rio Grande do Sul, Brazil. After visual assessment, the ideal harvest point would be defined when the fruit had a red coloration characteristic of araçá. Ripe fruits were selected for analysis without skin damage. A sample of twig with leaves and fruits was incorporated at Herbário Padre Balduíno Rambo (HPBR), at URI Erechim, under the registration number of exsiccate 12350.
After harvesting, the fruits were manually selected, excluding those damaged. Then, they were washed under running water and immersed for 15 min in NaClO solution at 200 ppm. Next, fruits were rinsed and the external water removed, conditioned in polyethylene packages containing the indication of weight and harvesting date, and frozen at −10 °C.
For the chemical characterization, peels were dehydrated in air circulating oven (Lucadema, model LUC-01) at the temperature of 38 ± 1 °C to avoid loss of volatiles compounds. During the process, the samples were weighed (Shimadzu, model AUX220) at intervals of 30 min until constant weight (360 min). After drying, the samples were ground in a mill (Solab, model SL-01).
The water content was determined after drying the samples by the method of desiccation in air circulating oven (Luccadema, model Lucca-001), at 105 °C temperature, according to the 012/IV methodology described by IAL (2008). Lipid content was determined by the method of 032/IV do IAL (2008) in a Soxhlet extractor (Marconi model MPA 491/6) using petroleum ether P.A. (Dinâmica®) as solvent extractor. Protein content was assessed according to AOAC 991.20 (AOAC, 2007) by the method of Kjeldahl, consisting in nitrogen determination in three steps: sample digestion (Lucadema, model 341/2), distillation and titration. Fixed mineral residue was also determined using the method 018/IV from IAL (2008), with carbonization performed at 200 °C (A. Scientific model EEQ9012D-2) followed by muffle incineration (Zezimaq, model 004) at 550 °C. Total carbohydrates was obtained by subtracting the other constituents of the chemical composition, according to RDC n° 360 (Brasil, 2003). The pH values were established using a pH meter (Tecnopon, model mPA-210) by reading directly in the crushed peels and diluted in distilled water, following the method described by IAL (2008), whereas soluble solids were evaluated in a portable refractometer, as previously reported in the IAL (2008), with the data expressed in °Brix.
2.2 Effects of the process variables on the total anthocyanins extraction
The methodology of the conventional extraction used was proposed by Medina et al. (2011) with some modifications: 5 g of each sample were conditioned in 25 mL Falcon tubes, covered by aluminum. It was next added 10 mL of 90% (v/v) ethanol, containing 0.1% HCl. The extraction occurred in the dark during 2 h and at 4 ± 1 °C. After this time, the samples were centrifuged (MPW, model MPW-351R) at 8000 rpm for 15 min and under refrigeration. The pellet was rinsed twice with 5 mL of ethanol. The total extract obtained was submitted to vacuum filtration and the volume of each sample was normalized to 20 mL. Then, the extracts were dried in an exhaust hood until the solvent removal and stored at −8 °C.
In order to evaluate whether the thermal processing influences on the extraction of total anthocyanins (TA), the red araçá peel was analyzed in natura and submitted to air circulating drying processing, with temperature at 38 ± 1 °C up to constant weight. Peels were ground in a mill (Solab, model SL-01) and immediately sent to extraction.
To verify the influence of the solvent type and concentration, extractions were performed with ethanol P.A. (Merck®) and methanol P.A. (Vetec®), both acidified by HCl P.A. (31–33%, Vetec®) at different concentrations (30, 50, 70, 90 and 100%).
After defining the solvent and concentration to be used, Central composite rotational design (CCRD) were developed aiming the optimization of the extraction process by the maceration conventional method. First, the effects of stirring and sample mass/solvent volume ratio were evaluated from a complete factorial planning 22 – CCRD, where the stirring (X1 - 40–110 rpm) and sample mass/solvent volume ratio (X2 - 0.6/10–3.4/10) were established as independent variables to verify the effects on the extraction (Table 1). Fixed variables of extraction were sample in nature, extraction time of 2 h, solvent type (90% ethanol) and temperature at 4 °C. After that, the effects of pH and temperature from a new complete factorial planning 22 - CCRD, where pH (X1 - 0.8–2.21) and temperature (X2 - 4.8–75.2 °C) were considered the independent variables (Table 1). Fixed variables of extraction were time of 2 h, solvent 90% ethanol, temperature at 4 °C, sample mass/solvent volume ratio of 1 g/10 mL and no stirring. *X1 = stirring (rpm); X2 = sample mass/solvent volume ratio (g/mL); X3 = pH; e X4 = temperature (°C). ** Fixed independent variables: ethanol solvent (90%), sample mass/solvent volume ratio (1 g/10 mL), extraction time (2 h), temperature (4 °C).
Assays
Independent variables:
Total anthocyanins content (mg of cyanidin-3-glycoside/100 g of peel)
X1
X2
1
−1 (50)
−1 (1/10)
79.57
2
−1 (50)
1 (3/10)
63.39
3
1 (1 0 0)
−1 (1/10)
68.34
4
1 (1 0 0)
1 (3/10)
66.30
5
−1.41 (40)
0 (2/10)
69.50
6
+1.41 (1 1 0)
0 (2/10)
67.39
7
0 (75)
−1.41 (0.6/10)
81.66
8
0 (75)
+1.41 (3.4/10)
56.68
9
0 (75)
0 (2/10)
66.48
10
0 (75)
0 (2/10)
67.50
11
0 (75)
0 (2/10)
66.41
X3
X4
1
−1 (1)
−1 (15)
89.84
2
−1 (1)
1 (65)
115.22
3
1 (3)
−1 (15)
54.27
4
1 (3)
1 (65)
69.39
5
−1.41 (0.8)
0 (40)
95.03
6
+1.41 (2.21)
0 (40)
60.99
7
0 (1.5)
−1.41 (4.8)
79.39
8
0 (1.5)
+1.41 (75.2)
88.27
9
0 (1.5)
0 (40)
114.47
10
0 (1.5)
0 (40)
112.74
11
0 (1.5)
0 (40)
111.98
It was also performed the ultrasound-assisted extraction using the parameters obtained in the conventional method that resulted in the higher TA content, including solvent concentration, sample mass/solvent volume ratio, time, pH and temperature. For the extraction, 1 g of red araçá peel was weighed and conditioned in an Erlenmeyer flask, following by 10 mL of solvent addition. Flasks were covered with aluminum and immersed in ultrasonic bath (Unique model USC-1800A) at frequency 40 KHz −154 W. After 2 h of extraction, samples were centrifuged, filtered and adjusted to 20 mL.
TA quantification was performed according to the method described by Fetter et al. (2010) using a spectrophotometer (Agilent, model 8453E) at 535 nm. This is based on the interpolation of the linear regression tangent to the standard curve of commercial cyanidin-3-glycoside (Sigma-Aldrich®). This is the major component of the anthocyanin group in red araçá (Biegelmeyer et al., 2011; Medina et al., 2011). Standard curve was constructed with different concentrations of the commercial cyanidin-3-glycoside (1, 5, 10, 15 and 20 ppm).
2.3 Kinetics of TA extraction using conventional and ultrasound-assisted methods
The kinetics of TA extraction was performed to determine the time required for extracting TA and whether degradation of the compound occurred during the extraction period. Thus, 8 g of sample were added to 40 mL of 90% ethanol and kept in the absence of light. Samples destined for extraction by the conventional method were incubated in an orbital shaker without stirring at 4 °C. For the ultrasound-assisted extraction, samples were immersed in an ultrasonic bath at 40 °C and 40 KHz −154 W frequency without stirring. At time intervals, 1 mL of the supernatant from each sample was taken, centrifuged (Hettich, model 200424) and read at 535 nm.
2.4 Determination of bioactive compounds
For the extracts that presented the higher content of TA from the experimental planning by the conventional and the ultrasound-assisted methods, the analyses of total phenolic compounds, flavonoids, carotenoids and antioxidant activity were carried out.
The total phenolic compounds content of the extracts from the red araçá peel was determined following the methodology of Singleton et al. (1999) with modifications proposed by Blainski et al. (2013) and Dai and Mumper (2010). First, 0.5 mL of the sample followed by 2.5 mL of 0.2 N Folin-Cicocalteu reagent (Vetec®) were added under stirring on a Vortex tube shaker (IKA, model MS 3B). The mixture remained resting for 5 min at room temperature in the dark. Then, 2 mL of 5% NaCO3 (Vetec®) and 50 μL of 10% LiCl (Synth®) were added and incubated for 2 h in the dark and in a water bath (Nova Ética, model 501D) at 25 °C. The absorbance measurement was carried out in a quartz cuvette using a spectrophotometer at 760 nm. The results were expressed as Eq.mg of gallic acid in the analyzed sample after construction of the calibration curve and the equation of the straight line with commercial gallic acid standard (Neon®) at concentrations ranging from 0.01 to 0.25 mg/mL−1.
The total flavonoids content of the extracts from the red araçá peel was determined according to the methodology described by Zhishen et al. (1999) where 0.25 mL of sample was added to the test tube containing 1.25 mL of deionized water and 75 μL of the 5% NaNO2 solution (Synth®), homogenized in a Vortex tube shaker (IKA Model MS 3B) and the mixture remained resting for 6 min at room temperature (25 °C). Next, 150 μL of 10% AlCl3 solution was added, homogenized and remained resting for another 5 min at room temperature. After that, 0.5 mL of 1 mol·L-1 NaOH solution (Dynamic®) and 2.5 mL of distilled water under stirring (1200 rpm) were added and the measurement performed at 510 nm. The results were expressed in Eq.mg of catechin/100 g of red araçá peel after construction of the calibration curve and the equation of the straight line with commercial catechin standard (Vetec®) at concentrations ranging from 0.01 to 0.25 mg·mL−1.
The total carotenoids content was estimated by reading the absorbance of the extracts at 448 nm, according to Eq. (1) (Davies, 1976). The absorbance coefficient used was referred to β-carotene for ethanol: E1% 1 cm = 2620 (Davies, 1976). The carotenoid concentration results were expressed in terms of total carotenoids (μg/mL).
The antioxidant activity of the extracts obtained from the two extraction methods was determined by monitoring the capture of the free radical DPPH (1,1-diphenyl-2-picrylhydrazyl) that presents the maximum absorption at 515–520 nm, as described by Brand-Williams et al. (1995) with modifications, where 23.659 mg of DPPH (Sigma-Aldrich®) was diluted in 1000 mL of methanol (Merck®). Then, 100 μL of each extract and 3900 μL of DPPH were added to the test tubes and homogenized on a vortex tube shaker (IKA, model MS 3B). The blank was performed with 100 µL of the sample and 3900 µL of methanol and the control sample with 100 µL of methanol and 3900 µL of DPPH. The solution was kept out of the light for 30 min and thereafter read at 515 nm. The antioxidant activity was calculated according to Eq. (2) and the value expressed as % of DPPH inhibition.
2.5 Statistical analysis
All experiments were performed in triplicate. The results were submitted to statistical analysis using the Statistica program (version 7.0 StatSoft, Inc., Tulsa OK, USA). The analysis of variance (ANOVA) was used to detect the significant difference between the samples (p < 0.05). Mean values were compared to each other by Student's t-test at 5% of probability of error (p ≤ 0.05).
3 Results and discussion
3.1 Chemical characterization of the red araçá peel
The water content from the red araçá peel obtained in the present study was 78.85%. This value was lesser than those found by Santos et al. (2007) and Silva et al. (2008) that evaluated the red araçá whole fruit, 79.6% and 82.36%, respectively. These data suggest that the water content presented in the red araçá fruit is higher in the pulp in comparison to the peel. Gondim et al. (2005) compared the physicochemical composition of the peel and the whole fruit of 7 brazilian species, and the calculated water content from the peel was lower than the fruit for all the species.
For the total carbohydrates analyses, the value of 11.19% is lower than the 26.79% described by Dalla Nora et al. (2014) in the whole fruits. However, it corresponds to the second largest centesimal fraction of peel, suggesting that the peel also contributes to the sweet flavor characteristic of red araçá. The ethereal extract of 0.17% is low, similar to the values of 0.24% and 0.34% found by Damiani et al. (2011) and Dalla Nora et al. (2014) respectively, demonstrating the reduced lipid content of the red araçá, either the whole fruit or only the peel. Similarly, the values of fixed mineral residue was slightly elevated as compared to the obtained by Dalla Nora et al. (2014) with the whole fruit, approximately 6%, what makes the red araçá peel an excellent source of minerals, such as potassium, calcium, phosphorus, magnesium, among others (Kinupp and Barros, 2008). In addition, the protein content of the peels was 4.31%, higher than those obtained by MCcook-russell et al., 2012 (2.1%) and Dalla Nora et al. (2014) (3.77%) in whole fruits. As regards to the soluble solids content, the obtained value was 13.33 °Brix. This parameter is important for the fruits because it implies the presence of sugars in the structure that are essential for the anthocyanins stability (Cavalcanti et al., 2006). Gondim et al. (2005) mentioned that, in general, fruit peels have the amount of nutrients superior than their respective edible parts, corroborating with our present data. The pH value of 2.56 gives the characteristic red color of the peel by the influence of cation flavylium. In contrast, these values for the whole fruits are higher, according to Santos et al. (2007) that found 3.29.
3.2 Influence of processing on the total anthocyanins (TA) content
The TA content found for the in natura and dried samples were 34.32 e 5.49 mg of cyanidin-3-glycoside/100 g of peel, respectively, presenting significant difference (p < 0.05), which indicates that thermal processing, even at temperatures under 40 °C, provoked anthocyanins degradation of approximately 84%. Besides the temperature, the time and air circulation may also have influenced on the results, since oxygen exposition can degrade anthocyanins. Dalla Nora et al. (2014) also found values lesser for the samples submitted to the drying process, with a degradation of 98.3% at 70 °C. Asami et al. (2003) attributed to the high temperatures and oxygen concentrations during the drying process the anthocyanins degradation by oxidation and condensation of the phenolic compounds. Based on that, our further analyses were performed in natura peels.
As regards to the influence of the solvent type on the TA extraction, it was obtained 59.40 and 56.57 mg of cyanidin-3-glycoside/100 g of peel for methanol and ethanol, respectively, emphasizing that these extracts were not significantly different at 5% level. Montes et al. (2005) also did not find significant differences between these two solvents for TA extraction. Therefore, ethanol was chosen as solvent due to its similarity to methanol in terms of the content of TA extracted and to the lower toxicity.
Fig. 1 shows the obtained results regarding to the content of TA from the red araçá peel related to the different concentrations of ethanol tested. It was observed that as the concentration of ethanol increases, there was a greater extraction of TA, with no statistical difference between solutions with 90% and 100%. Thus, the concentration of 90% ethanol (ethanol 90:water 10, v/v) acidified with 0.1% HCl was defined as solvent for the next steps.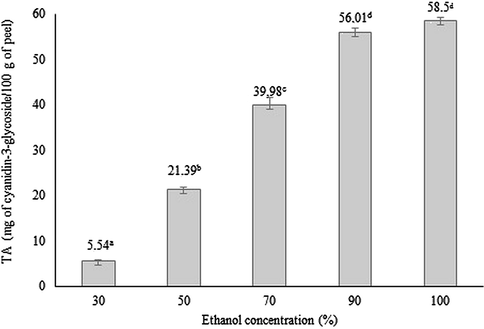
Total anthocyanins (TA) content extracted from the red araçá peel related to the different concentrations of ethanol solvent.
Table 1 presents the complete factorial planning matrix 22 (CCRD) related to the independent variables stirring (rpm) (X1) and sample mass/solvent volume ratio (g/mL) (X2), and the respective response in terms of TA (Eq. mg of cyanidin-3-glycoside/100 g of peel) found for each experiment. The higher TA content was 81.66 Eq.mg of cyanidin-3-glycoside/100 g of peel for the assay 7, using 75 rpm stirring and 0.6 g/10 mL sample mass/solvent volume ratio.
Fig. 2a shows the Pareto’s graph with the estimated variables from the complete factorial planning 22 related to the TA content, where it can be verified that the sample mass/solvent volume ratio causes a significant negative effect, that is, the lower the sample mass in the solvent, the greater the TA extraction. It may be explained due to the higher amount of solvent available for the extraction, promoting a better transfer of anthocyanins mass from the vegetal matrix to the solvent. However, a slightly difference in the TA content was observed between the assays 1 and 7, although the amount of sample mass was 40% higher in assay 1. Hence, the sample mass/solvent volume ratio determined for the next experiments was 1 g/10 mL. Stirring also provokes a negative effect, even though was not significant at 5% level. Therefore, considering this negative effect and the process costs, the static mode (without stirring) for the extractions was employed in the further steps.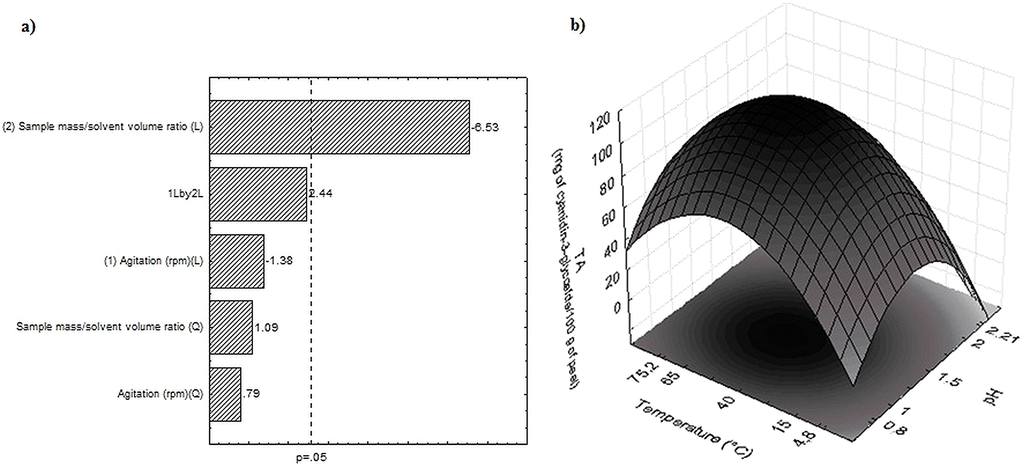
Pareto’s graph with the estimated effects (absolute value) of the variables stirring and sample mass/solvent volume ratio (a) and response surface related to the pH and temperature (b) for the total anthocyanins extraction from the red araçá peel.
The complete factorial planning matrix 22 related to the independent variables pH (X3) and temperature (X4), as well as the respective responses in terms of TA content from the red araçá peel (Table 1), demonstrates that the higher TA contents were 115.22 Eq.mg of cyanidin-3-glycoside/100 g of peel using pH 1.0 and temperature at 65 °C (assay 2) and of 114.47 mg of cyanidin-3-glycoside/100 g of peel using pH 1.5 and temperature at 40 °C (assay 9). These contents were larger than those described by Teixeira et al. (2005) for the peel of eggplant (64.06 ± 8.44), purple cabbage (61.44 ± 3.71) and pomegranate (12.67 ± 1.25), and by Patil et al. (2009) that extracted 37.26 mg/100 g of radish peel, which indicate that the red araçá peel is a good source of anthocyanins.
The results were statistically analyzed and the Eq. (3) presents the second order coded model obtained by regression coefficients of the TA content related to the pH and temperature within the studied range. This model was validated by analysis of variance where a correlation coefficient of 0.93 and a Fcalc 4.4 fold greater than the Ftab value were obtained, thus allowing the construction of the contour curve, as shown in the Fig. 2b.
As can be seen in Fig. 2b, the highest TA content were obtained in the pH range from 1.0 to 1.5 and temperature from 40 to 65 °C. These results corroborate with those described by Bordignon et al. (2009) that found the highest TA content with pH close to 1.0 for the strawberry anthocyanins extraction. The variables of the central point, temperature at 40 °C and pH 1.5 are more efficient at the experimental level, because for the temperature of 65 °C is needed a higher energy consumption and the pH 1.0 limits the applications of the extract as food dyes. Thus, the temperature at 40 °C and the pH 1.5 were defined for the next step, which aimed to evaluate the ultrasound-assisted extraction.
Time of 2 h, sample mass/solvent volume ratio of 1 g/10 mL and ethanol at 90% concentration were the parameters that complemented this condition.
3.3 Kinetics of extraction by the conventional and ultrasound-assisted methods
In order to understand the behavior of the TA content, kinetics of extraction by the conventional and ultrasound-assisted methods was performed for 150 min, according to Fig. 3. The maximum anthocyanins extraction by the conventional method was 121.81 Eq.mg of cyanidin-3-glycoside/100 g of peel obtained in 120 min. Therefore, the extraction time was fixed in 120 min, similarly to the time established by Medina et al. (2011) in the TA extraction from the red araçá fruit by the conventional method. On the other hand, for the ultrasound-assisted extraction, the highest TA content was 125.88 Eq.mg of cyanidin-3-glycoside/100 g of peel at 90 min, after the anthocyanins content decreased, suggesting degradation. Possible wind is related to the prolonged exposure of the compounds to ultrasonic powers, which can cause structural degradation and destruction due to the increase in pressure and temperature created by the intensity of the collapse of the cavitation microbubbles (Al-Dhabi et al., 2017; Nipornram et al., 2018). In this context, Das et al. (2017) also concluded that this method provokes a degradation process at a certain time with free radical generation and depolymerization of the compound, by evaluating the TA extraction from the black rice using 40 KHz −154 W frequency and temperatures near to 40 °C.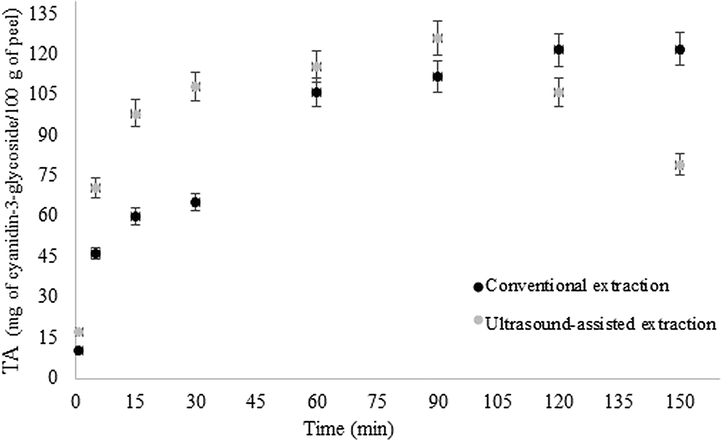
Kinetics of extraction by the conventional and ultrasound-assisted methods.
In our study of ultrasound-assisted extraction (40 KHz −154 W), a 12% increase in 25% reduction in time-reduced compounds is promoted. This result is justified by the phenomenon caused by acoustic cavitation caused by the propagation of pressure waves or ultrasound, causing the implantation of microbubbles on the surface of the matrix, resulting in several effects, such as flaking of the surface, fragmentation, sound effect, sonoporation, shear pressure, explosion of plant structures, among others. These combined effects result in the collapse of the vegetable matrix, allowing the solvent to penetrate the material and improving the release of intracellular substances in the solvent, and consequently the extraction rates (Chemat et al., 2017; Goula et al., 2017; Arruda et al., 2019).
Adjé et al. (2010) verified that the ultrasound makes the extraction process three fold faster than the conventional method by maceration for the anthocyanins from Delonix regia flowers, although did not significantly increase the maximum content of TA extracted (but with more process time). Furthermore, Chen et al. (2007) reduced the extraction time of anthocyanins from raspberry when using the ultrasound-assisted in comparison to the conventional method.
From the results obtained through the kinetics of extraction by the two methodologies, it is possible to observe that the ultrasound-assisted extraction is more efficient than the conventional extraction, because presents similar TA content (p < 0.05) for a time extraction of 30 min, which means 25% lower as compared to the conventional.
3.4 Bioactive compounds
Table 2 exhibits the results for the contents of TA, total phenolic compounds, flavonoids, carotenoids and antioxidant activity for the extracts obtained from the conventional and ultrasound-assisted extraction methods from the red araçá peel. Extractions were performed with 90% ethanol, pH 1.5, temperature at 40 °C and 1 g/10 mL sample mass / solvent volume ratio, 40 KHz −154 W frequency (only for the ultrasound-assisted method) and extraction times of 120 and 90 min for the conventional and ultrasound-assisted methods, respectively. The maximum TA content at these experimental conditions was significantly different for both methodologies. However, the contents were above of 100 Eq. mg cyanidin-3-glycoside/100 g of peel, which are elevated for anthocyanins, characterizing the red araçá peel as a good source of this compound. Fetter et al. (2010) achieved 36.12 mg of anthocyanins using the whole fruit, approximately 4 fold lesser than what the present work found only in the peel, suggesting that the peel is probably the predominant location of the anthocyanins in the red araçá. Extraction conditions: ethanol concentration (90%), pH 1.5, sample mass/solvent volume ratio (1 g/10 mL), temperature (40 °C), time (120 min for the conventional extraction and 90 min for the ultrasound-assisted extraction), frequency (only for the ultrasound–assisted – 50 KHz). a,b Means (± Standard Deviation) followed by equal letters/lines indicate that there is no significant difference at the 5% level (Student's t-test).
Bioactive compounds
Extraction method
Conventional
Ultrasound-assisted
Anthocyanins (mg of cyanidin-3-glycoside/100 g of peel)
116.81b ± 1.12
121.85a ± 0.91
Total phenolic compounds (Eq.mg of gallic acid/100 g of peel)
477.53b ± 3.09
589.49a ± 2.15
Flavonoids (mg de catechin/100 g of peel)
351.80b ± 2.25
374.05a ± 1.33
Carotenoids (µg of β-carotene/mL of extract)
4.45a ± 0.018
4.47a ± 0.037
Antioxidant activity (% DPPH inhibition)
85.67a ± 0.36
86.31a ± 0.35
The total phenolic compounds content from the conventional extraction was 477.53 Eq. mg of gallic acid/100 g of peel, whereas for the ultrasound-assisted extraction this parameter reached 589.49 mg. Denardin et al. (2015), MCcook-russell et al., 2012 and Medina et al. (2011) also found values above 450 mg in studies with the whole fruit from red araçá by the conventional extraction. Thus, the present study corroborates the results obtained by other authors, confirming that the fruit is rich in phenolic compounds and may be utilized for disease prevention.
The flavonoids content found for the conventional and ultrasound-assisted extraction methods was 351.80 and 374.05 mg of catechin/100 g of peel, respectively. Biegelmeyer et al. (2011) obtained values near to 100 mg of catechin/100 g of whole fruit using the conventional method of extraction. These data demonstrate that the peel concentrates the highest content of flavonoids as compared to the whole fruit.
Comparing the total phenolic compounds and flavonoids obtained by both methods, it could be noted that the ultrasound-assisted extraction was significantly more efficient, being 23.45% higher than the conventional methodology for total phenolic compounds and 12% for flavonoids. This can be explained by the ultrasound cavitation process, which leads to cell wall rupture and release of polyphenol-rich compounds through mass transfer (Abid et al., 2013).
Regarding to the carotenoids content, there were no significant differences at 5% level between the samples submitted to both extraction methods. The average content ranged from 4.45 to 4.47 μg of β-carotene/mL of extract. These values are higher than the 1.07 μg of β-carotene/mL of extract obtained by Faller and Fialho (2009), but similar to those found by Denardin et al. (2015) and Medina et al. (2011) The differences in values may be probably due to the climate from the cultivation place and the degree of maturation, which can influence the fruits chemical composition. The red araçá peel present higher carotenoids content in comparison to the value of 2.95 μg of β-carotene / mL of extract from yellow araçá reported by Pereira et al. (2012).
The antioxidant activity efficiency evaluated by the percentage of DPPH inhibition demonstrated 85.67 and 86.31% inhibition for conventional and ultrasound-assisted methodologies, respectively, using extract concentration of 50 mg/mL. These efficiencies may be associated with the increased TA content from the red araçá peel, since these compounds are generally more reactive than other phenolic compounds, basically due to their cation form that can be easily oxidized. Further investigations are needed in in vivo situations to prove the present data showing the better anthocyanin efficiency over other phenolic compounds.
4 Conclusion
Ultrasound-assisted extraction provided a 12% higher yield, with 25% less extraction time compared to the maceration conventional process, confirming that red araçá, especially bark, is rich in bioactive compounds, being beneficial in preventing the generation of free radicals and oxidative stress related disease. These results also contribute to the use of ultrasound technology as a simple, fast and low environmental impact process to recover compounds with high added value.
Acknowledgements
The authors thank to National Council for Scientific and Technological Development (CNPq), Coordination for the Improvement of Higher Education Personnel (CAPES) and Research Support Foundation of the State of Rio Grande do Sul (FAPERGS).
Declaration of Competing Interest
The authors declare that they have no known competing financial interests or personal relationships that could have appeared to influence the work reported in this paper.
References
- Effect of ultrasound on different quality parameters of apple juice. Ultrason. Sonochem.. 2013;20(5):1182-1187.
- [CrossRef] [Google Scholar]
- Optimization of anthocyanin, flavonol and phenolic acid extractions from Delonix regia tree flowers using ultrasound-assisted water extraction. Ind. Crops Prod.. 2010;32(3):439-444.
- [CrossRef] [Google Scholar]
- Development and validation of ultrasound-assisted solid-liquid extraction of phenolic compounds from waste spent coffee grounds. Ultrason. Sonochem.. 2017;34:206-213.
- [CrossRef] [Google Scholar]
- Effects of high-intensity ultrasound process parameters on the phenolic compounds recovery from araticum peel. Ultraso. Sonochem.. 2019;50:82-95.
- [CrossRef] [Google Scholar]
- Comparison of the total phenolic and ascorbic acid content of freeze-dried and air-dried marion berry, strawberry, and corn grown using conventional, organic, and sustainable agricultural practices. J. Agric. Food Chem.. 2003;51(5):1237-1241.
- [CrossRef] [Google Scholar]
- Simple and selective detection of quercetin in extracts of plants and food samples by dispersive-micro-solid phase extraction based on core-shell magnetic molecularly imprinted polymers. New J. Chem.. 2018;19:16144-16153.
- [CrossRef] [Google Scholar]
- Ultrasound combined with manganese-oxide nanoparticles loaded on activated carbon for extraction and pre-concentration of thymol and carvacrol in methanolic extracts of: Thymus daenensis, Salvia officinalis, Stachys pilifera, Satureja khuzistanica, and mentha, and water samples. Analyst. 2019;144:1923-1934.
- [CrossRef] [Google Scholar]
- Association of Official Analytical Chemists – AOAC, 2007. Official Methods of Analysis of AOAC International. Current through Revision 2, 18th ed. AOAC International, Washington (DC).
- Optimization of ultrasound-assisted extraction of phenolic compounds from yarrow (Achillea beibrestinii) by response surface methodology. Food Sci. Biotechnol.. 2012;21:1005-1011.
- [CrossRef] [Google Scholar]
- Comparative Analysis of the Chemical Composition and Antioxidant Activity of Red (Psidium cattleianum) and Yellow (Psidium cattleianum var. lucidum) Strawberry Araçá Fruit. Food Sci.. 2011;76(7):991-996.
- [CrossRef] [Google Scholar]
- Application and analysis of the Folin Ciocalteau method for the determination of the total phenolic content from Limonium Brasiliense L. Molecules. 2013;18(6):6852-6865.
- [CrossRef] [Google Scholar]
- Influence of the extraction solution pH on the content of anthocyanins in strawberry fruits. Food Sci. Technol.. 2009;29(1):183-188.
- [CrossRef] [Google Scholar]
- Use of a free radical method to evaluate antioxidant activity. Lebensm. Wiss. Technol.. 1995;28:25-30.
- [CrossRef] [Google Scholar]
- Brasil. Resolution - RDC No. 360 of December 23, 2003. Technical Regulation on Nutritional Labeling of Packaged Foods, making nutrition labeling mandatory. Official Gazette, Brasilia, Brasil. December 26, 2003; Section 1:28.
- Determination of total soluble solids (° Brix) and pH in milk drinks and processed fruit juices. Pesqui. Bras. Odontopediatria Clín. Integr.. 2006;6(1):57-64.
- [Google Scholar]
- Ultrasound assisted extraction of food and natural products. Mechanisms, techniques, combinations, protocols and applications. A review. Ultrason. Sonochem.. 2017;34:540-560.
- [CrossRef] [Google Scholar]
- Optimization of ultrasound-assisted extraction of anthocyanins in red raspberries and identification of anthocyanins in extract using high-performance liquid chromatography–mass spectrometry. Ultrason. Sonochem.. 2007;14(6):767-778.
- [CrossRef] [Google Scholar]
- Development and validation of an efficient ultrasound-assisted extraction of phenolic compounds from flax (Linum usitatissimum L.) seeds. Ultrason. Sonochem.. 2015;26:176-185.
- [CrossRef] [Google Scholar]
- Plant phenolics: extraction, analysis and their antioxidant and anticancer properties. Molecules. 2010;15(10):7313-7352.
- [CrossRef] [Google Scholar]
- Effect of processing on the stability of bioactive compounds from red araçá (Psidium cattleyanum Sabine) and guabiju (Myrcianthes pungens) J. Food Compos. Anal.. 2014;34(1):18-25.
- [CrossRef] [Google Scholar]
- Characterization of fruits from the savanna: Araça (Psidium guinnensis Sw.) and Marolo (Annona crassiflora Mart.) Food Sci. Technol.. 2011;31(3):723-729.
- [CrossRef] [Google Scholar]
- Extraction of phenolic compounds and anthocyanin from black and purple rice bran (Oryza sativa L.) using ultrasound: A comparative analysis and hytochemical profiling. Ind. Crops Prod.. 2017;95:332-341.
- [CrossRef] [Google Scholar]
- Carotenoid. In: Goodwin T.W., ed. Chemistry and Biochemistry of Plants and Pigments. New York: Academic Press; 1976. p. :138-165.
- [Google Scholar]
- Antioxidant capacity and bioactive compounds of four Brazilian native fruits. J. Food Drug. Anal.. 2015;23(3):387-398.
- [CrossRef] [Google Scholar]
- Comparative evaluation of maceration and ultrasonic-assisted extraction of phenolic compounds from fresh olives. Ultrason. Sonochem.. 2017;37:328-334.
- [CrossRef] [Google Scholar]
- Application of hydrophobic deep eutectic solvent as the carrier for ferrofluid: A novel strategy for pre-concentration and determination of mefenamic acid in human urine samples by high performance liquid chromatography under experimental design optimization. Talanta. 2019;202:526-530.
- [CrossRef] [Google Scholar]
- Magnetic dispersive micro-solid phase extraction with the CuO/ZnO@Fe 3 O 4 -CNTs nanocomposite sorbent for the rapid pre-concentration of chlorogenic acid in the medical extract of plants, food, and water samples. Analyst.. 2019;144:2684-2695.
- [CrossRef] [Google Scholar]
- A ferrofluidic hydrophobic deep eutectic solvent for the extraction of doxycycline from urine, blood plasma and milk samples prior to its determination by high-performance liquid chromatography-ultraviolet. J. Chromatogr. A 2019 (in press)
- [CrossRef] [Google Scholar]
- The antioxidant capacity and polyphenol content of organic and conventional retail vegetables after domestic cooking. Food Res. Int.. 2009;42(1):210-215.
- [CrossRef] [Google Scholar]
- Functional properties of yellow araçá, red araçá (Psidium cattleyanum) and araçá (P. acutangulum) cultivated in Pelotas/RS. Braz. J. Food Technol.. 2010;3:92-95.
- [CrossRef] [Google Scholar]
- Extraction of phenolic compounds and anthocyanins from juçara (Euterpe edulis Mart.) residues using pressurized liquids and supercritical fluids. J. Supercrit. Fluid.. 2017;119:9-16.
- [CrossRef] [Google Scholar]
- Centesimal and mineral composition in fruit peels. Ciênc. Tecnol. Aliment.. 2005;25(4):825-827.
- [CrossRef] [Google Scholar]
- Ultrasonic-assisted extraction combined with sample preparation and analysis using LC-ESI-MS/MS allowed the identification of 24 new phenolic compounds in pecan nut shell [Carya illinoinensis (Wangenh) C. Koch] extracts. Food Res. Int.. 2018;106:549-557.
- [CrossRef] [Google Scholar]
- Institute Adolfo Lutz -IAL. 2008. Physicochemical methods for food analysis, 4. ed. 1. ed. digital. São Paulo, pp. 1020.
- Green ultrasound-assisted extraction of carotenoids from pomegranate wastes using vegetable oils. Ultrason. Sonochem.. 2017;34:821-830.
- [CrossRef] [Google Scholar]
- Study on power ultrasound optimization and its comparison with conventional thermal processing for treatment of raw honey. Food Technol. Biotechnol.. 2017;55(4):570-579.
- [CrossRef] [Google Scholar]
- Protein and mineral content of native species, potential vegetables and fruits. Ciênc. Tecnol. Aliment.. 2008;28(4):846-857.
- [Google Scholar]
- Ultrasound assisted extraction of oil from rice bran: A response surface methodology approach. J. Food Process. Technol.. 2015;6(6):2-7.
- [CrossRef] [Google Scholar]
- Optimization and comparison of ultrasound/microwave assisted extraction (UMAE) and ultrasonic assisted extraction (UAE) of lycopene from tomatoes. Ultrason. Sonochem.. 2008;15(5):731-737.
- [CrossRef] [Google Scholar]
- Optimization of ultrasonic-assisted extraction of phenolic compounds from bovine pennyroyal (Phlomidoschema parviflorum) leaves using response surface methodology. Ind. Crops Prod.. 2014;57:195-202.
- [CrossRef] [Google Scholar]
- Polyphenols: food sources and bioavailability. Am. J. Clin. Nutr.. 2004;79:727e47.
- [CrossRef] [Google Scholar]
- Nutritional and nutraceutical comparison of Jamaican Psidium cattleianum (strawberry araçá) and Psidium guajava (common araçá) fruits. Food Chem.. 2012;134:1069-1073.
- [CrossRef] [Google Scholar]
- Araçá (Psidium cattleianum Sabine) fruit extracts with antioxidant and antimicrobial activities and antiproliferative effect on human cancer cells. Food Chem.. 2011;128(4):916-922.
- [CrossRef] [Google Scholar]
- Application of tristimulus colorimetry to optimize the extraction of anthocyanins from Jaboticaba (Myricia Jaboticaba Berg.) Food Res. Int.. 2005;38(8):983-988.
- [CrossRef] [Google Scholar]
- Optimization of low power ultrasound-assisted extraction of phenolic compounds from mandarin (Citrus reticulata Blanco cv. Sainampueng) peel. Food Chem.. 2018;241:338-345.
- [CrossRef] [Google Scholar]
- Influence of ultrasonic amplitude, temperature, time and solvent concentration on bioactive compounds extraction from propolis. Ultrason. Sonochem.. 2020;64:106021.
- [CrossRef] [Google Scholar]
- Comparative evaluation of maceration, microwave and ultrasonic-assisted extraction of phenolic compounds from propolis. J. Food Sci. Technol.. 2020;57(1):70-78.
- [CrossRef] [Google Scholar]
- Extraction, dealcoholization and concentration of anthocyanin from red radish. Chem. Eng. Process: Process Intensificat.. 2009;48(1):364-369.
- [CrossRef] [Google Scholar]
- Characterization and antioxidant potential of Brazilian fruits from the Myrtaceae family. J. Agric. Food Chem.. 2012;60(12):3061-3067.
- [CrossRef] [Google Scholar]
- Lab and pilot-scale ultrasound-assisted water extraction of polyphenols from apple pomace. J. Food Eng.. 2012;111(1):73-81.
- [CrossRef] [Google Scholar]
- Kinetics of ultrasound assisted extraction of antioxidant polyphenols from food by-products: Extraction and energy consumption optimization. Ultrason. Sonochem.. 2016;32:137-146.
- [CrossRef] [Google Scholar]
- Polyelectrolyte behavior and calcium binding properties of sugar beet pectins differing in their degrees of methylation and acetylation. Biochem. Eng. J.. 2003;16:191-201.
- [CrossRef] [Google Scholar]
- Modeling and optimization of ultrasound-assisted extraction of polyphenolic compounds from Aronia melanocarpa by-products from filter-tea factory. Ultrason. Sonochem.. 2015;23:360-368.
- [CrossRef] [Google Scholar]
- Effect of thermal and non thermal processing technologies on the bioactive content of exotic fruits and their products: Review of recent advances. Food Res. Int.. 2011;44(7):1875-1887.
- [CrossRef] [Google Scholar]
- Application of supercritical carbon dioxide to fruit and vegetables: extraction, processing, and preservation. Food Rev. Int.. 2012;28:253-276.
- [CrossRef] [Google Scholar]
- Bioactive compounds in conventional and no added sugars red strawberry araçá (Psidium cattleianum Sabine) Jellies. Rev. Bras. Frutic.. 2016;38(3):e-062.
- [CrossRef] [Google Scholar]
- Green extraction processes of natural products as tools for biorefinery. Biofuels Bioprod. Biorefining.. 2014;8(4):530-544.
- [CrossRef] [Google Scholar]
- Rheological properties of sweet mass of red guava (Psidium cattleianum sabine) rheological properties of jams in mass of red strawberry guava (Psidium cattleianum Sabine) Rev. Brasil. Tecnol.. 2007;1(2):104-116.
- [CrossRef] [Google Scholar]
- Comparison of different ultrasound assisted extraction techniques for pectin from tomato processing waste. Ultrason. Sonochem.. 2019;61:104812
- [CrossRef] [Google Scholar]
- Biological Properties and Therapeutic Applications of Propolis. Phyther. Res.. 2016;30(6):894-905.
- [CrossRef] [Google Scholar]
- Chemical characterization of native cerrado fruits. Ciênc. Rural.. 2008;38(6):1790-1793.
- [CrossRef] [Google Scholar]
- Analysis of total phenols and other oxidation substrates and antioxidants by means of Folin-ciocalteu Reagent. Meth. Enzymol.. 1999;299:152-178.
- [CrossRef] [Google Scholar]
- Ultrasound-assisted extraction of phenolics from wine lees: modeling, optimization and stability of extracts during storage. Ultrason. Sonochem.. 2014;21(2):706-715.
- [CrossRef] [Google Scholar]
- Effect of ultrasonic treatment on the polyphenol content and antioxidant capacity of extract from defatted hemp, flax and canola seed cakes. Ultrason. Sonochem.. 2014;21(1):346-353.
- [CrossRef] [Google Scholar]
- Different extraction methods of biologically active components from propolis: a preliminary study. Chem. Cent. J.. 2007;1:13.
- [CrossRef] [Google Scholar]
- Valorization of cacao pod husk through supercritical fluid extraction of phenolic compounds. J. Supercrit. Fluids.. 2018;131:99-105.
- [CrossRef] [Google Scholar]
- Recent advances in extraction of nutraceuticals from plants. Trends Food Sci. Technol.. 2006;17:300-312.
- [CrossRef] [Google Scholar]
- The determination of flavonoid contents in mulberry and their scavenging effects on superoxide radicals. Food Chem.. 1999;64(4):555-559.
- [CrossRef] [Google Scholar]


