

Translate this page into:
Correlation between crystallite size and photocatalytic performance of micrometer-sized monoclinic WO3 particles
⁎Corresponding author. nandiyanto@upi.edu (Asep Bayu Dani Nandiyanto)
-
Received: ,
Accepted: ,
This article was originally published by Elsevier and was migrated to Scientific Scholar after the change of Publisher.
Abstract
The correlation between crystallite size and the characteristics of micrometer-sized photocatalyst particles was investigated. As a model of photocatalyst, monoclinic tungsten trioxide particles with controllable crystallite sizes were used. The crystallite size was controlled independently in the constant particle outer diameters to comprehend the crystallite size parameters precisely. To minimize the misleading photocatalytic measurements due to the over-dominancy of other catalytic parameters (such as excessive surface area and quantum confinement effect), the present study utilized micrometer-sized particles. The results revealed that in the constant process condition, the photocatalytic properties were strongly dependent on the material crystallinity. Increases in the crystallite sizes had a strong influence to the enhancement of the photodecomposition rate of organic material. The tendency for the impact of crystallite size was also confirmed by varying the number of catalysts in the photocatalytic process. To confirm the analysis of photocatalysis, the study was completed with the theoretical consideration and the proposal of the particle formation as well as the phenomena that happen during the photocatalytic process.
Keywords
Amorphous
Crystallite size
Tungstate material
Curcumin
Photodecomposition rate

1 Introduction
The design of effective photocatalyst has attracted a tremendous amount of attention (Zhao and Liu, 2008). For the obtainment of excellent photocatalysts, there are principal parameters that must be considered:
-
Types of materials (Sakthivel et al., 2003; Vamvasakis et al., 2015; Nadarajan et al., 2018; Radhika et al., 2019; Badli et al., 2017);
-
Catalyst morphology, size, and surface chemistry (Nagaveni et al., 2004; Nandiyanto et al., 2009a, 2013; Arutanti et al., 2014b);
-
Crystallite size and structure (Cheng et al., 2010);
-
Additional co-catalyst and doped material (Arai et al., 2008; Arutanti et al., 2014a, 2015; Abdullah et al., 2016; Nadarajan et al., 2018; Alshammari et al., 2019; Armaković et al., 2019; Badli et al., 2017);
-
Photocatalytic process condition (e.g. pH, temperature, illumination time, radiation intensity) (Sakthivel et al., 2003; Zhang et al., 2007; Nandiyanto et al., 2016b);
-
Stoichiometrical composition between reactant and catalyst in the photodecomposition process (Hayashi et al., 2003; Sakthivel et al., 2003; Churbanov et al., 2007; Szilágyi et al., 2008).
Even though research on above parameters has been well-documented, the research on the influence of crystallite sizes on photocatalytic performance is still uncompromised among researchers. Some reports confirmed that the crystallite sizes have a positive impact on the improvement of the catalytic process (Tanaka et al., 1991; Ohtani et al., 1997), while others showed the opposite results (Peng et al., 2005; Sharma et al., 2014; Arias et al., 2015; Vamvasakis et al., 2015). On the other hand, other researchers reported that the correlation between crystallite sizes and the catalytic properties cannot be predicted (Kim and Kwak, 2007; Devi et al., 2010). The difficulty in understanding this correlation is due to the involvement of many parameters in the measurement process. Specifically, the main problem for the uncompromising trend of crystallite sizes is due to the use of nanomaterial by most of the researchers. In fact, the use of nanomaterial as a tool for analyzing catalytic parameters sometimes results in misleading information on the measurement (Nandiyanto et al., 2009b). The occurring phenomena and parameters that influence the catalytic process cannot be predicted since the nanoparticle itself has shortcomings regarding over dominance in surface area and quantum confinement effects (Liangrong et al., 2002; Marotti et al., 2006; Kim and Kwak, 2007). Consequently, each parameter that influences the catalytic process cannot be analyzed precisely. Opposed to the utilization of nanomaterial, some reports proposed the use of film-typed material due to its simplification control of material morphological and crystal structure (Peiro et al., 2001; Santato et al., 2001; Zhang et al., 2002; Arias et al., 2015). However, some issues are still persisted. Since the catalyst itself is embedded in the specific position, the use of film has a limitation in the reactant-catalyst interaction, light penetration, and blockage of impurities that cannot be removed easily on the film surface (Nandiyanto et al., 2009a). This makes other misleading results in the precise analysis of each parameter that influence the catalytic process.
In our previous studies, we have demonstrated the production of photocatalyst with controllable outer diameters, shapes, and crystallinity (Nandiyanto et al., 2009a, 2013, Arutanti et al., 2014a, 2014b, 2015, 2016b, 2017a). The strategies for gaining excellent photocatalytic performance have also been reported. However, the reports did not focus on the crystallite size parameters in detail. Thus, the purpose of this study was to report a systematic experimental evaluation regarding the singular effect of particle crystallinity on the photocatalytic performance. This study was conducted to confirm a current uncompromised issue regarding the crystallite sizes. In addition, the parameter of the crystallite sizes was focused since the parameter directly correlates with the temperature in the production process (Marotti et al., 2006; Sharma et al., 2014; Nandiyanto et al., 2016a; Armaković et al., 2019). Thus, it is important to understand this parameter to optimize the production and the scaling-up process. This study used tungsten trioxide (WO3) particles as a model of photocatalyst. WO3 was used due to its excellent performance (i.e., active under visible light, relatively harmlessness, chemical and thermal stable, good photostability, as well as chemical and biological inertness) (Nandiyanto et al., 2013; Singh et al., 2019).
Although WO3 has been well documented in various phases (e.g., tetragonal, orthorhombic, monoclinic, triclinic, and hexagonal) which can be controlled by changing the production process condition such as temperature (Granqvist, 1995), the present study used WO3 with monoclinic phase. Monoclinic was selected because this phase is the most stable crystalline structure and the most active catalytic performance among WO3 phases (Szilágyi et al., 2008).
To prepare WO3 microparticles, ammonium tungstate was used. This type of raw material was used due to its simplification for decomposition into WO3 (van Put, 1995). Further, different from other ammonium tungstate raw materials such as inorganic tungstate (e.g., sodium tungstate and calcium tungstate), decomposition of ammonium tungstate allows the fabrication of high purity of tungstate product. Organic components (i.e., ammonium) in the ammonium tungstate can be released easily by heating without remaining impurities. Recently, commercial ammonium tungstates have three forms (Hunyadi et al., 2014), i.e., ammonium normal tungstate (ANT; (NH4)2WO4), ammonium paratungstate (APT; (NH4)10[W12O41]. m H2O (m = 4, 5, 7, 10)); and ammonium metatungstate (AMT; (NH4)6[W12O41]. n H2O (n = 1–22)). APT and AMT sometimes interact with water into their structure to form (NH4)10[H2W12O42]·m H2O and (NH4)6[H2W12O42]·n H2O, respectively. Among the commercial ammonium tungstate materials, ANT and AMT have good water solubility, making them easy to contact and interact with water. As a consequence, a process using both raw materials must be done carefully. APT has relatively less stability in water, making them easily controlled for producing high-purity tungstic acid, tungsten metal powder, tungsten carbide, and tungsten oxide (see in http://www.tungsten-powder.com/AMT-APT-difference.html; retrieved on 29 September 2017).
To prepare WO3 particles from ammonium tungstate, there are three production routes. The first route is by dissolving ammonium tungstate into the aqueous solution and contacting with acid-basic solution to precipitate WO3 particles (Fujioka et al., 2011; Supothina et al., 2007). The second route is by dissolving ammonium tungstate and putting it into the specific apparatus (such as spray method) to crystallize WO3 as well as to remove the solvent and organic components (Nandiyanto et al., 2013). And, the third is by direct heating process to decompose ammonium tungstate (Nandiyanto et al., 2016a). Based on the above method, the third route is the best option to generate high-purity material since the process does not involve other chemicals and solvents. This is also the main reason why the present study used the third route for producing WO3 particles with controllable crystallite size. In addition, to ensure the production of high purity of raw tungstate product, high-purity ammonium tungstate (>99%) was used. Indeed, when using high purity of raw materials and WO3 product, precise analysis of the photocatalytic performance will be obtained since the existence of impurities that may trigger or inhibit the photochemical reaction can be prevented.
To precisely uncover the crystallinity parameter associating with the obtainment of excellent photocatalytic performances, the present study was performed using a micrometer-sized catalyst, while the utilization of particles in micrometer range is rarely found and typically disregarded in current reports. In fact, the micrometer-sized particles can give exceptional outcomes that differ markedly from those of nanoparticles or film material.
Different from film-typed catalysts, the microparticles can easily mix, sink, and fly in the solution, making them possible in light penetration and reactant-catalyst interaction. Further, unlike nanoparticles that need specific techniques for removing them from the characterized sample, the micrometer-sized particles are easily collectable. The micrometer-sized particles can also be spontaneously settled and precipitated after the process (Andral et al., 1999). These benefits give positive consequences for getting precise photocatalytic measurement as the microparticles do not contaminate the characterized sample. Compared to nanoparticles, their less photocatalytic activities also give advantages for distinguishing the deviation results easily, proposing the micrometer-sized particles as a prospective tool for analyzing each catalytic parameter in detail, specifically for crystallite size parameter.
To clarify the explanation of the crystallinity effect on the catalytic performance, the crystallite size was controlled independently in the constant particle outer diameter. The impact of initial catalyst loading was also tested to confirm the influence of crystal size precisely. In addition, the results were also investigated in detail along with the theoretical consideration and the proposal of the particle formation as well as the phenomena that occur during the photocatalytic process.
2 Experimental method
2.1 Micrometer-sized WO3 catalyst preparation
Micrometer-sized WO3 particles were prepared by heating APT-typed ammonium tungstate (ammonium tungstate pentahydrate powder (ATP); >99%; Kanto Chemical Co., Inc., Japan). In a typical experimental procedure, 2 g of ATP was heated using an electrical furnace in the atmospheric condition under a fixed condition: a heating rate of 50 °C/min and a holding time at a specific temperature for 30 min. To obtain the control of particle crystallinity, heating temperatures were varied from 150 to 800 °C. To gain monoclinic phase, the heated material was cooled to room temperature with a cooling rate of 50 °C/min. In addition, ATP was purchased and used without further purification.
2.2 WO3 particles characterization
Several analyses were employed to characterize the physicochemical properties of the heated ATP. Thermal Gravimetry (TG) and Differential Thermal Analysis (DTA) (DTG-60A, Shimadzu Corp., Japan; operated at a heating rate of 5 °C/min with a flow of air (200 mL/min)) was used to analyze the mass transformation profile of ATP into WO3 as a function of temperature. Fourier Transform Infrared Spectroscopy (FTIR; FTIR-8400, Shimadzu Corp., Japan) and X-ray diffraction (XRD; XRD; PANalytical X’Pert PRO; Philips Corp., The Netherland) were utilized to analyze the chemical composition and the crystal phase/pattern respectively. Scanning Electron Microscope (SEM; SEM, JSM-6360LA; JEOL Ltd., Japan) was used to characterize the particle outer diameter and morphology. The nitrogen sorption analysis (BET Nova 4200e; Quantachrome Instruments Corp., US; operated at 77 K) was also conducted to analyze the surface area and porous structure of the sample.
2.3 Photocatalytic performance analysis
For analyzing the effect of crystallite size on the photocatalytic performance, the produced WO3 powder with a specific crystallite size was used for degrading 100 ppm of curcumin solution. The curcumin solution itself was obtained from extraction process of turmeric (Curcuma longa L; collected from Bandung, Indonesia), in which the extraction process is described in detail in elsewhere (Nandiyanto et al., 2017a, 2017b).
The mixed catalyst-curcumin suspension was put in the photocatalytic process. The photocatalytic process was carried out in a 400-mL capacity of borosilicate photochemical batch glass reactor having dimension of 10 and 8 cm for height and diameter, respectively. 36 W of Neon Lamp was used as the light source. The experiments were performed at ambient temperature between 25 °C and 30 °C at atmospheric condition. All experiments were stirred using a magnetic stirrer with a mixing rate of 600 rpm. To keep the concentration of dissolved oxygen in the suspension constant during experiments, 1 L/min of air was bubbled into the reactor.
Prior to each experiment, the catalyst-curcumin suspension was allowed to equilibrate for 5 min without any illumination. Then, the photocatalytic process was conducted for 6 h. The progress of the process was monitored by withdrawing definite quantity of aliquot and measured using a portable spectrophotometer (Vis-spectro, Indonesia; see reference (Nandiyanto et al., 2016b)) and UV–Vis spectrophotometer (Shimadzu UV–VIS-Spectrophotometer, UV-3150) for decoloration.
3 Results
3.1 Preparation of WO3 particles with controllable crystallite sizes
To analyze the impact of temperature for controlling the formation of WO3, TG-DTA analysis was conducted (Fig. 1). The TG result showed the detection of loss in mass as a function of temperature. Decreases in mass were found gradually from the beginning of the heating process. However, after passing 500 °C, the mass was relatively stable. The decreases in mass are believed to have a correlation with the existence of reaction, strengthened by the DTA analysis for the detection of either an exothermic or an endothermic process at temperatures of 120, 190, 280, and 420 °C. The loss in mass in TG analysis was in a good agreement with the theoretical stoichiometrical approximation (see attached Table in Fig. 1).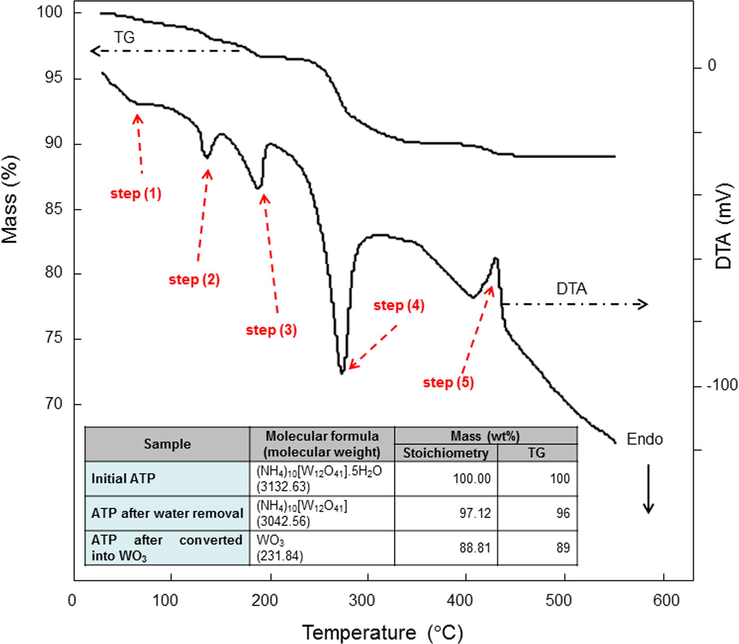
TG-DTA analysis result of ATP. Attached table is a prediction of mass calculated using stoichiometry.
The photograph images of samples produced with various temperatures are shown in Fig. 2. Physical appearances of WO3 changed from white, orange, to yellowish green along with the changes in temperatures. Meanwhile, the initial ATP was white (Fig. 2a), and the color1 did not change when ATP was heated with temperatures lower than 250 °C (Fig. 2b and c). Then, heating temperatures of about 380 °C gave the outcome for the production of material with orange color (Fig. 2d and e). Finally, the color changed into yellowish green gradually when using temperatures of more than 380 °C (Fig. 2f–h). This result confirmed the impact of the change in chemical composition on the material physical properties.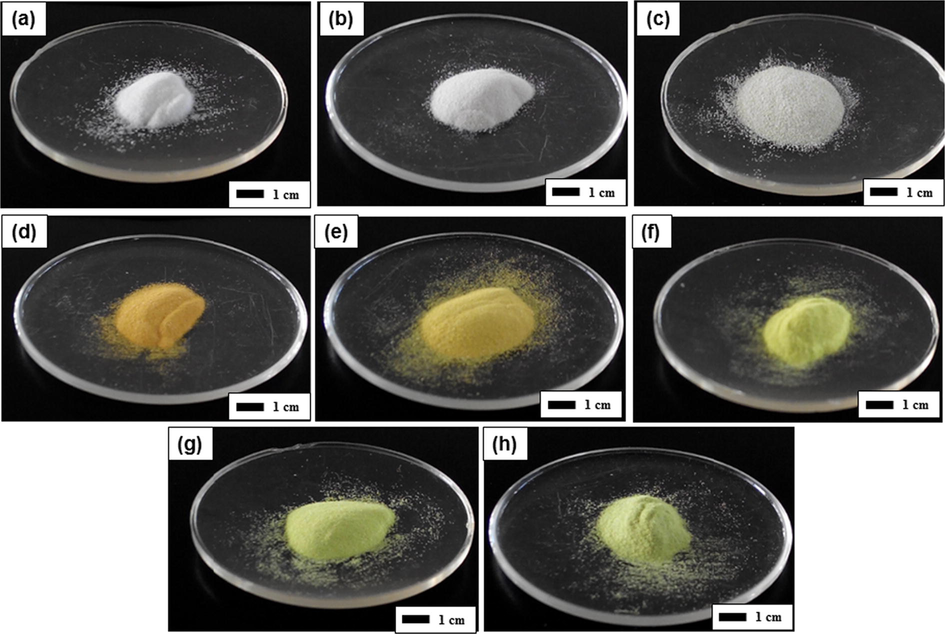
Photograph images of ATP heated with various temperatures. Figure (a) is the initial ATP powder. Figures (b), (c), (d), (e), (f), (g), and (h) are samples heated at 150, 210, 380, 480, 600, 700, and 800 °C respectively.
The FTIR analysis results of ATP heated with various temperatures are shown in Fig. 3. The results revealed the changes in the chemical composition, as confirmed by the changes in the FTIR peaks and pattern. The FTIR of the initial ATP detected some peaks, corresponding to the tungstate-related specific bond (Nandiyanto et al., 2016a; Madarász et al., 2004) (in the range below 1000 cm−1), OH molecules (Nandiyanto et al., 2009b) (at the band of about 1600 and 3600 cm−1), and N-H bond (Nandiyanto et al., 2009b) (at the band of about 1400 and 3200 cm−1). Then, the peak intensities relating OH and N-H bond decreased with the increasing temperature. Further, the peaks disappeared after 300 °C. This result verified that the chemical composition in the product was strongly dependent on the temperature used for the heating process, specifically relating to OH and NH-related molecule removal.
FTIR analysis results of ATP heated with various temperatures.
Fig. 4 presents the XRD patterns of ATP heated with various temperatures. Changes in the patterns along with the selection of temperature process were detected. The spectra of initial sample were in a good agreement with that of pure ATP (Nandiyanto et al., 2016a; Madarász et al., 2004). By heating the sample at 150 °C, the disappearances of some peaks in the range of 20, 30–40, and higher than 50° were detected. The use of temperature of 280 °C resulted in the formation of materials with amorphous phase. Then, starting from 300 °C, all peaks were re-assigned. The detection of diffraction peaks corresponding to monoclinic WO3 based on Joint Committee on Powder Diffraction Standards (JCPDS) No. 72-1465 was observed. No impurity peaks and no transition to other phases were detected, indicating that the products are pure in both chemistry and crystalline phase. The peak intensities become more prominent with the increasing temperature from 380 °C, indicating the formation of material with higher degree of crystallinity and larger crystallite size. Using the similar calculation method referred in Tahara et al. (2014), we found that in the degree of crystallinity case, all samples prepared at temperatures from 380 to 800 °C were completely crystalline. According to the Scherrer equation, the crystallite sizes of the sample increased from 19 to 42 nm with the increasing temperatures from 380 to 800 °C. Based on these results, the heating temperature plays an important role for regulating the degree of crystallinity and crystallite sizes in the product.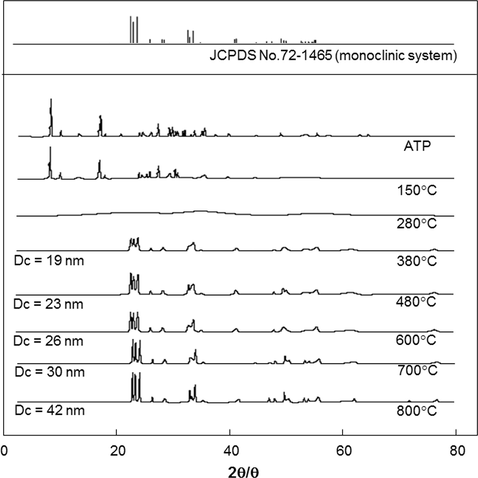
XRD analysis results of ATP heated with various temperatures.
Fig. 5 depicts the SEM images of the samples produced with various temperatures. The results showed that agglomerated-free particles with polyhedra shapes were observed for all temperature variations. A change in the outer diameter was observed depending on the heating temperature (see Fig. 5 h). The mean outer diameters of initial ATP particles were about 120 μm (Fig. 5a), and the sizes decreased along with the increase of the temperatures (Fig. 5b–g). Increasing the level of temperature has promoted to the existence of smaller particles, in which these particles were probably from the breakage of initial ATP particles. However, in the case of process using temperature higher than 380 °C (See Fig. 5d–g), the constant particle size with the mean outer diameters of about 60 μm were obtained.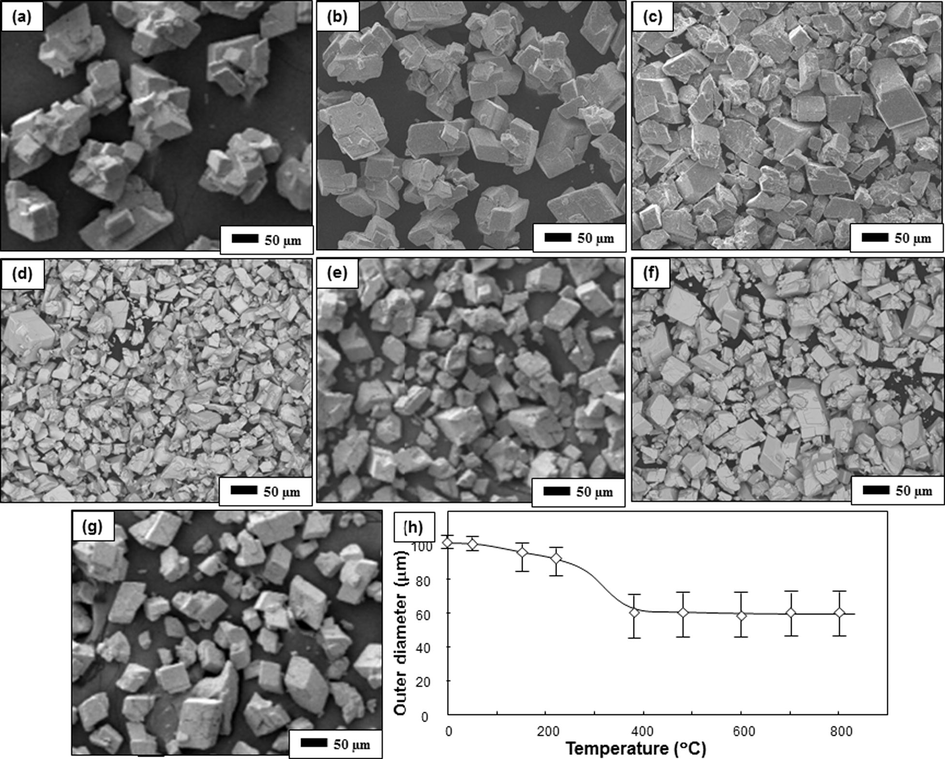
SEM images of ATP heated with various temperatures. Figure (a) is the initial ATP powder. Figures (b), (c), (d), (e), (f), and (g) are samples heated at 150, 210, 380, 480, 600, and 800 °C respectively. Figure (h) is the outer diameters of the particle versus heating temperatures.
High-magnified SEM images are depicted in Fig. 6. The modification of surface morphology in the particle was found along with the change in temperature. A smooth surface was found for initial ATP particles (Fig. 6a). Adding heat into the ATP, the surface with smooth shape changed into that with some cracks (Fig. 6b). The cracks enlarged with increasing temperature (Fig. 6c and d). In addition to the cracks, the rougher surface was also observed when the temperature increased (Fig. 6d).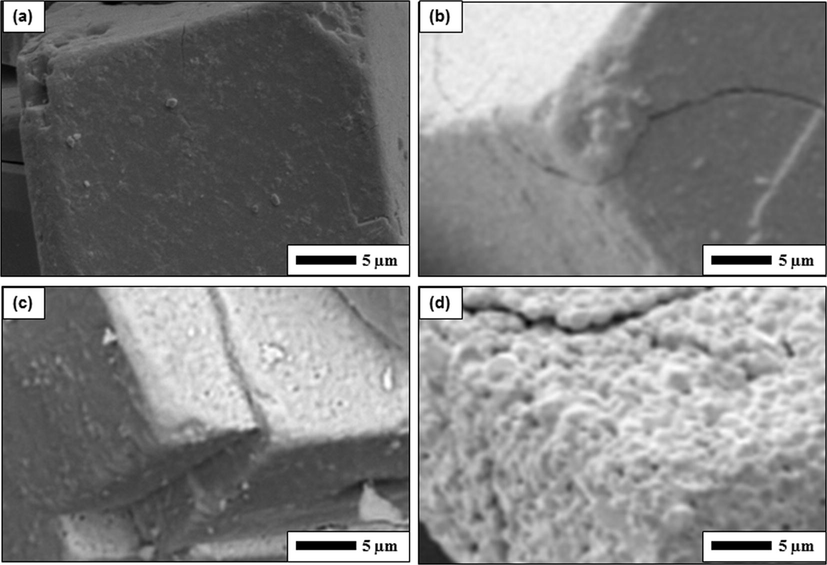
High magnification of SEM images of ATP heated with various temperatures. Figure (a) is the initial ATP powder. Figures (b), (c), and (d) respectively are samples heated at 210, 600, and 800 °C.
Fig. 7 shows the nitrogen adsorption/desorption isotherms of samples prepared with various temperatures. Although there is a change in the maximum volume adsorbed values, the values are relatively small (less than 30 cc/g in STP condition).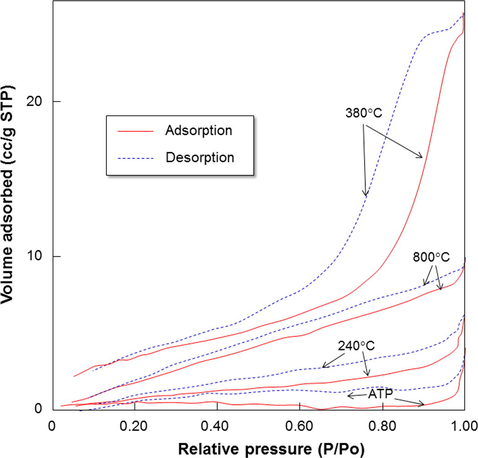
Isotherm adsorption/desorption results of samples prepared with various temperatures.
To confirm detailed information gained from nitrogen sorption analysis, Table 1 shows the characteristics of the samples (i.e., surface area, pore volume, micropore volume, and average pore radius). Results showed that the surface area increased from about 2–13 m2/g. Then, samples heated with temperatures higher than 380 °C had similar surface area of about 13 m2/g. These surface areas are relatively low compared to porous materials (Nandiyanto et al., 2009b, 2013). The increases in the surface area confirmed the changes of particle size as shown in Fig. 5. In short, increasing the processing temperature has a direct correlation to the production of smaller particles. Indeed, the smaller particles have a consequence to the higher surface area. Then, when the particle outer diameters are nearly the same (such as samples heated with temperatures of higher than 380 °C), the surface area will be the same.
Samplesa
Surface area (m2/g)
Pore volume (cc/g)
HK micropore volume (cc/g)
Average pore radius (nm)
BJH average pore radius (nm)
Adsorption
Desorption
Initial ATP
1.81
0.00626
0.00072
6.91
1.55
2.13
240 °C
4.29
0.00914
0.00092
4.26
1.54
1.68
380 °C
13.25
0.03978
0.00487
6.01
1.54
3.88
800 °C
13.39
0.01571
0.00225
2.35
1.54
1.69
The pore radiuses for all samples were less than 7 nm. This pore size range is relatively not active for photocatalytic process due to the limitations in the oxygen and light penetration into the deepest position in the pores (Nandiyanto et al., 2009a). Thus, the present study can assume that the photocatalytic process will be done on the outer surface of the catalyst only.
3.2 Photocatalytic performance of WO3 particles with controllable crystallite sizes
The absorbance at all wavelengths decreased over time due to the degradation of curcumin. Using Beer’s Law, the absorbance can be re-expressed as a unit of concentration (Nandiyanto et al., 2009a).
The normalized curcumin concentrations (with respect to the initial concentration) over time during photocatalysis experiments are shown in Fig. 8. Photodegradation was measured for 6 h of the process, which was an ample amount of time to observe the differences in the photocatalytic performances of WO3 with various crystallite sizes. WO3 samples with a constant particle outer diameter were used to confirm that the photodegradation rate is from the effect of the crystallite size. As a comparison, we also investigated the catalytic performance of ATP and amorphous WO3 particles. The evaluation of ATP and amorphous particles is to show the importance of crystallinity on the photocatalytic performance.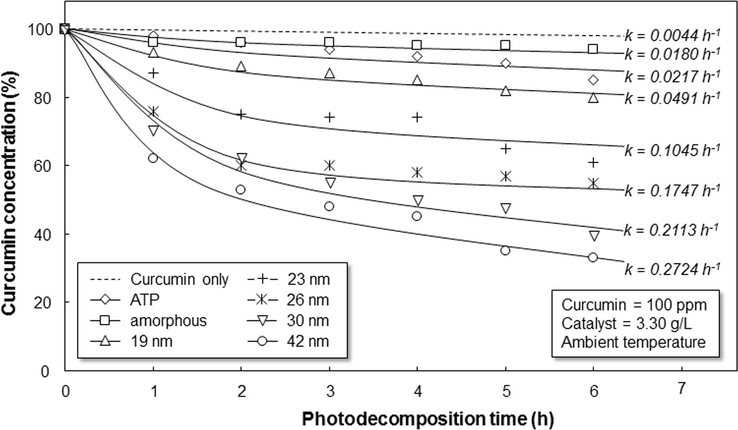
Photodecomposition profile of curcumin catalyzed by WO3 particles with various crystallite sizes. The samples were conducted using 100 ppm of curcumin with 3.30 g/L of WO3 catalyst in the ambient condition.
Curcumin decomposing rates relied on the type of WO3 catalysts used. The concentration of irradiated curcumin without additional WO3 displayed insignificant discoloration (final concentration of 98%). Next, the slight change in the concentration was found when using ATP and amorphous WO3. When WO3 particles with crystallite sizes of 19, 23, 26, 30, and 42 nm were used as the catalyst, the final concentrations of curcumin were 80, 61, 55, 40, and 33%, respectively. Since the fastest degradation of curcumin was obtained when using WO3 with larger crystallite, the result confirmed the important roles of the degree of crystallinity and crystal sizes on the photocatalytic performance.
To ensure the influence of crystallity parameter on the photocatalytic performance empirically, the Langmuir–Hinshelwood kinetic model for solid–solute reactions was used (Nandiyanto et al., 2009a). In short, the equation is expressed by
Fig. 9 shows the calculated photocatalytic rate versus crystallite size. To confirm the effect of crystallite size, the photodecomposition process of curcumin were tested in different catalyst loadings. The result showed that the more additional catalyst had correlation to the increases in the photocatalytic rate. But, too high concentration of catalyst added has a negative impact to the lowering photocatalytic performance. However, the main idea gained from this figure is to get the tendency in the crystallinity parameter compared to above analysis in Fig. 8. In general, all catalyst loading parameters agreed the increases in the crystallite size have a direct impact to the increases in the photocatalytic rate. For example, for process with catalyst loading of 3.30 g/L, the photocatalytic rate of WO3 with crystallite sizes of 19, 23, 26, 30, and 42 nm were 0.049; 0.105; 0.175; 0.211; and 0.272 h−1, respectively, whereas that with WO3 with amorphous phase was 0.018 h−1.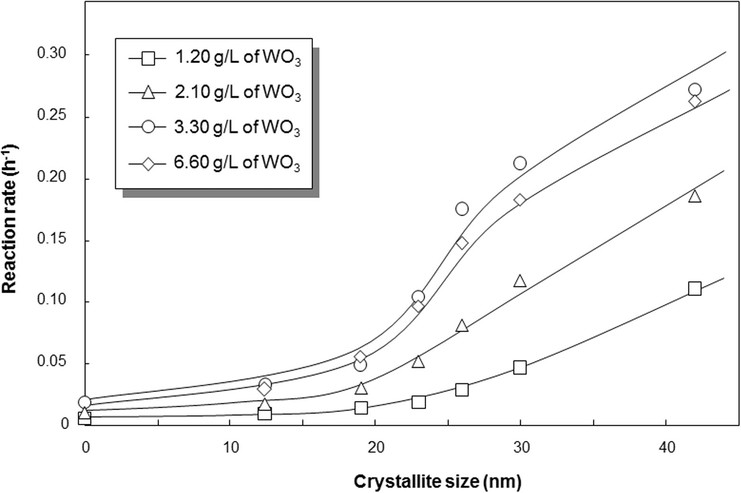
Correlation of crystallite size and photodecomposition rate of 100-ppm curcumin under various initial catalyst loadings under ambient temperature.
In addition, the present research was focused on the evaluation of the effect of crystalline size on the photocatalytic performance. Thus, the present data is reproducible when using high purity of WO3. No additional chemical, additive, surfactant, or doping was added during the photocatalytic process since the existence of other chemicals may trigger or inhibit photochemical reactions. Study on additional chemical is interesting, but it will be done in our future work.
4 Discussion
4.1 WO3 particle formation
Fig. 10 shows a schematic illustration of the particle formation phenomena during the thermal decomposition process of inorganic material. In this model, thermal decomposition of ATP was used. Based on the DTA analysis (see dashed arrows in Fig. 1), five steps of processes occurred. The stoichiometry analysis was done to ensure the steps, as presented in Table 2. The total reaction of the WO3 formation from decomposition of ATP can be written as
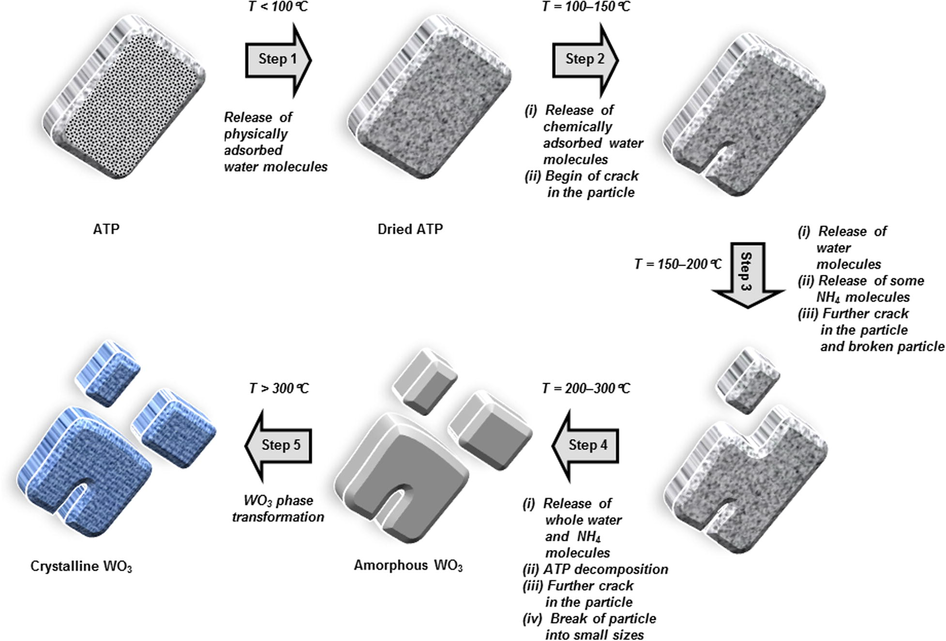
Illustration image of the conversion of ATP into WO3 particles.
Step
Reaction type
Temperature range (°C)
DTA peak (°C)
Δm (%)a
Possible released components (mol)b
NH3
H2O
1
Endothermic
0–100
66.3232
0
0
0c
2
Endothermic
100–150
135.4199
2.0635
0
3.59c
3
Endothermic
150–200
188.5834
1.2537
0.54
1.68d
4
Endothermic
200–300
273.4023
5.3042
9.18
4.86e
5
Exothermic
300–800
430.7504
2.3151
0.27
0.14e
Then, detailed steps are described in the following:
(i) The first step: temperature < 100 °C
The first step is an endothermic process, occurring at less than 100 °C (see step 1 in Fig. 10). The result was identified by the slight decreases in mass (less than 1 wt%) in TG analysis and the small endothermic peak in DTA analysis in Fig. 1. Since there is no pattern change in the FTIR analysis result, the change in TG mass is due to the release of physically adsorbed water in the sample (Nandiyanto et al., 2016a). Indeed, since the release of water involved physical removal only, less energy interfered.
(ii) The second step: temperature = 100–150 °C
The second step occurs in temperature of between 100 and 150 °C (see step 2 in Fig. 10). The mass loss of 2 wt% in TG analysis and strong signal for the endothermic peak at temperature of 135 °C in DTA curve were detected (See Fig. 1). FTIR analysis in Fig. 3 detected no changes in pattern, indicating no serious chemical structure deformation occurs. However, the XRD analysis in Fig. 4 showed the disappearance of some peaks in the position of after 30°. These analyses suggested the phenomena in the release of water crystal. Based on the stoichiometrical calculation (see Table 2), the reaction possibly releases almost 4 mol of water crystals. The reaction can be written as
(iii) The third step: temperature = 150–200 °C
The third step happens in temperature of between 150 and 200 °C with a DTA endothermic peak at temperature of 188 °C (see step 3 in Fig. 10). The FTIR analysis in Fig. 3 identified a change in the wavenumber of less than 1000 cm−1, in which this is due to the release of the rest of H2O and some ammonium component (NH4). The formation of WO3 component is possibly started in the material. Thus, the reaction can be written as Based on the stoichiometrical analysis, the percentage of possible released NH3 is about 0.54 mol. This is confirmed by the appearance of NH3 gas smell when heating ATP at the temperature of more than 150 °C. The number of WO3 can be produced is about 0.054 mol. Since the amount of WO3 is too small, the analysis of XRD and FTIR cannot identify its existence. Thus, to clarify the release of NH3, further analysis must be done.
(iv) The fourth step: temperature = 200–300 °C
The fourth step is the condition when the temperature was between 150 and 200 °C (see step 4 in Fig. 10). Major change in the TG mass was found, followed by the detection of the strongest signal for DTA endothermic peak at temperature of 273 °C (Fig. 1). This result confirmed that the heating process promotes the decomposition of organic-related components (Kim and Kwak, 2007). This hypothesis is also supported by the disappearance of FTIR peaks at about 1400, 1600, 3200, and 3600 cm−1 (Fig. 3), assigned as the removal of OH and NH-related molecules.
OH and NH-related molecules are removed from their originated positions and lost entirely from specimen. The molecules are released as gases, following with the concomitant effect of forming some cracks and holes in the particle (see SEM images in Fig. 6b). The release of these molecules also leads to the collapse of tungstate elemental structure in ATP, changing the position and orientation of tungsten (W) and oxygen (O) elements. The aggregation of W and O elements happens, followed by the creation of an intermediate amorphous phase (see XRD result in Fig. 4) (Nandiyanto et al., 2016a). The beginning of the amorphous formation is at temperature of 280 °C, implying that the minimum temperature for preparing crystalline WO3 must be conducted at more than 280 °C.
Based on the stoichiometry in Table 2, the ATP was almost completely changed into WO3 material. However, some ammonium components still exist in small number. The reaction can be generalized as
(v) The five step: temperature > 300 °C
When applying temperature of more than 300 °C, almost no significant change in TG mass (see step 5 in Fig. 10) was detected. Small changes in mass occurred due to the release of the rest of ammonium molecules. This result is also confirmed by the XRD analysis results in Fig. 4, showing the increasing intensities of the diffraction peaks (i.e. increasing sizes of WO3 crystal).
By applying the temperature that is higher than the minimum crystal growth temperature, all organic components (i.e. OH and NH-related molecules) are supposed to be removed. This phenomenon is followed by the enlargement of cracks in the particle (See Fig. 6c–d) and the break of particle into smaller parts (See Fig. 5d–g). The existence of cracks was also confirmed by nitrogen sorption analysis in Table 1, showing the increases in surface area, pore size, and pore volume. W and O elements further connect each other and do further atomic orientations, resulting in the formation of crystalline structure (Sharma et al., 2014). Further, the nucleation and crystal growth of W and O elements occur (Sharma et al., 2014), confirmed by the prominence of XRD peak intensities when heated at temperature of higher than 380 °C (see Fig. 4) (Kim and Kwak, 2007). These phenomena result in the heat excitation that was detected as an exothermic DTA peak. The phenomena in the heat excitation are in a good agreement with that discussed in reference (Fait et al., 2008).
In this range of temperature, no further loss of elements from the particle happens, verified by almost unchanged mass in the TG analysis (Fig. 1). Thus, the process is only re-structurizing elements and the crystal growth. As a consequence, identical mean final particle outer diameters were found for all samples heated with temperatures of more than 380 °C (Fig. 5 h). Although some cases show slight decreases in the outer diameter, the deviation is not significant and this is due to a sintering effect. In addition, the crystal growth phenomena due to the impact of temperature is confirmed by the changes in particle surface morphology (see high-magnified SEM images in Fig. 6d) as well as physical appearances from white, orange, to yellowish green (see Fig. 2).
4.2 Formation of monoclinic structure with controllable crystallite size
The present method is effective to create monoclinic-structured WO3 material, while other reports reported that the pure monoclinic phase is hardly to obtain (Salje, 1977; Szilágyi et al., 2008). The main reason for the possibility control of crystalline phase is due to the control of heating and cooling rate in the process. These heating and cooling rates must be also optimized with the particle outer diameter (Sharma et al., 2014).
It has been known that lower heating rate in the atmosphere condition promotes the formation of WO3 with monoclinic phase (Salje, 1977; De Wijs and De Groot, 1999). Low temperature rate leads to a relaxation in the interface structure, and the penetration of heat can reach the deepest position inside the particle. However, too low temperature rate can possibly allow the formation of other types of WO3 phase, instead of monoclinic. With this reason, to achieve homogenous heat transfer in the expected temperature, the present method used small amount of ATP sample, applied relatively rapid heating rate, and held the heating process at a specific temperature. As a consequence, the homogenous heat transfer can be maintained and the final particles contain similar phase and structure (Sharma et al., 2014). In addition to the important of heating rate, the regulation of cooling rate is crucial. Too slow cooling rate has a correlation to the formation of other stable WO3 crystalline phases (Salje, 1977; Szilágyi et al., 2008). However, to confirm this hypothesis, further analysis must be conducted in the other work.
In addition to the control of heating and cooling rates, the regulation of heating temperature is also crucial for managing the crystallite size (Luis et al., 2011). When the annealing temperature increases, the element inside the material is re-organized, forming crystal cluster. The crystal grain begins to grow, and the growth orientation exploits the vacancy position between the crystal clusters. Since this growth orientation absorbs energy from the heat (see step 5 in DTA analysis in Fig. 1), the more heating temperature permits the more possibility of crystal cluster to exploit vacancy position for growing the crystal (Ohtani et al., 1997). Thus, the crystallite size significantly increases with increasing temperature (Sharma et al., 2014). This hypothesis is in a good agreement with current literatures (Ohtani et al., 1997; Marotti et al., 2006; Sharma et al., 2014; Nandiyanto et al., 2016a; Armaković et al., 2019). Interestingly, we found that in the degree of crystallinity case, samples prepared at temperatures from 380 to 800 °C were completely crystalline. We believe that this phenomenon is due to the control of heating and cooling rate for making good heat transfer to all positions in the particle.
In addition, when heating ATP with temperature of between 380 and 800 °C, the WO3 materials display different physical colors. The larger crystal results in the more appearance of yellowish green color. The composition of material (i.e. WO3) and the outer diameter were the same, implying that the different colors are due to the different crystallite sizes. Analysis of the impact of heating temperature on color appearance will be discussed in our future report.
4.3 Influence of crystallite size on photocatalytic performance
The mechanism that constitutes the photocatalytic performance is illustrated in Fig. 11. When semiconductor material absorbs light energy (as photon; see route R1 in Fig. 11) that is equal to or greater than its bandgap energy (about 2.98 eV for WO3) (Arutanti et al., 2014a), electron (e−) is promoted from valence band (VB) to conduction band (CB) (see route R2 in Fig. 11).(Nagaveni et al., 2004). The migrating e− leaves an electron vacancy or hole (h+) in the VB. Once the charge separation is kept, e− as the light-generated carrier travels to the catalyst surface (see route R3 in Fig. 11) (De Wijs and De Groot, 1999; Zhang et al., 2007). As a counterpart to stabilize accumulation of the light-generated carriers on the surface, adsorbed species on the outer surface of catalyst such as water (H2O), hydroxide (OH−), and oxygen (O2) molecules interact and participate in the redox reaction with e− and h+ (Nagaveni et al., 2004). Specifically, h+ breaks apart the surface-bound H2O or OH− to form hydroxyl radical (OH∗) (see route R4 in Fig. 11), whereas e− picks up electron-accepting species (such as O2) to generate radical anion (e.g. superoxide (O2∗)) (see route R5 in Fig. 11). Then, the radical anion endorses the conversion of other H2O molecule into OH∗ (see route R6 in Fig. 11) (Vamvasakis et al., 2015). The existence of OH∗ leads to the conversion of organic molecule into smaller organic component, and further reaction can result in carbon dioxide and water (see route R7 in Fig. 11). This mechanism can be found for the bleaching color in the photocatalytic of dye as reported in elsewhere (Sakthivel et al., 2003; Nandiyanto et al., 2016b, 2017a; Alshammari et al., 2019).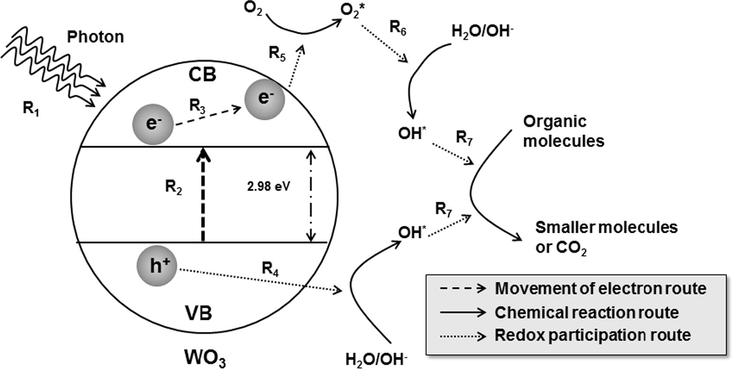
Illustration image of the phenomena happen during photocatalysis.
The activation of the e− and h+ depends on the energy band gap between VB and CB in the photocatalyst (Peiro et al., 2001). The band gap decides the acceptable wavelength and transferred energy (De Wijs and De Groot, 1999). To control e− and h+ movement, many strategies have been suggested (Abdullah et al., 2016; Alshammari et al., 2019; Arai et al., 2008; Armaković et al., 2019; Arutanti et al., 2014a, 2014b, 2015; Badli et al., 2017; Cheng et al., 2010; Nadarajan et al., 2018; Nagaveni et al., 2004; Nandiyanto et al., 2009a, 2013, 2016b; Radhika et al., 2019; Sakthivel et al., 2003; Vamvasakis et al., 2015; Zhang et al., 2007). However, this study only focuses on the degree of crystallinity and crystallite size, while other parameters will be discussed in other work.
The impact of the crystallite sizes on the photocatalytic performance was verified in Figs. 8 and 9. The blank test demonstrated that the degradation of curcumin is extremely slow without WO3 under light illumination (see Fig. 8 sample “curcumin only”), whereas the curcumin with WO3 gives responses in the decoloration. This confirms that the main degradation factor for the bleaching curcumin solution is due to the existence of WO3 catalyst (Zhang et al., 2007).
The decomposition of curcumin with various WO3 samples is different. The most degraded curcumin was found for samples with crystallite sizes of 42 nm, whereas the lowest was for ATP and amorphous WO3. Reaction parameters (e.g. outer diameter, and crystal phase of catalyst, as well as the concentration ratio of curcumin/WO3) were the same and the catalytic particles were classified as non-porous material. This implies that the fundamental reason behind the difference in photocatalytic performance is purely from the degree of crystallinity and the crystallite sizes. In short, the present study demonstrated that the larger crystallite size has a strong correlation to the improvement in the catalytic process, in which this trend was in a good agreement with other reports (Tanaka et al., 1991; Ohtani et al., 1997; Sharma et al., 2014; Armaković et al., 2019).
As mentioned above, the improving photocatalytic performance is due to the correlation of degree of crystallinity, crystallite size, and average diffusion time of the light-generated carriers to reach the surface of catalyst and interact with water molecules (De Wijs and De Groot, 1999; Zhang et al., 2007). The illustration of the movement of light-generated carriers to the surface of catalyst is explained in routes R3 and R4 in Fig. 11. The diffusion time (τ) can be simply described as
-
The more energy can be absorbed (De Wijs and De Groot, 1999; Marotti et al., 2006);
-
The opportunity for the recombination (i.e. re-position of light-generated carriers to its originated state) can be reduced (Tanaka et al., 1991; Kim and Kwak, 2007);
-
The light-generated carriers can easily transfer to the surface of particle (Tanaka et al., 1991; Zhang et al., 2007).
The above advantages can result in the accumulation of the carriers on the surface of the particle (Tanaka et al., 1991). Indeed, this accumulation promotes a more powerful redox reaction for the conversion of H2O, OH−, and O2 on the surface of catalyst (Kim and Kwak, 2007; Vamvasakis et al., 2015).
The impact of crystallite size was also evaluated by changing the initial amount of WO3 catalyst (See Fig. 10). Indeed, different rates of photodegradation were found, corresponding to the number of catalyst loading. More catalyst loading results in the more production of OH∗ species (Sakthivel et al., 2003), allowing the better photocatalytic performance. However, too much catalyst loading has a negative impact on the increases in the turbity that reduce the light transmission through the solution. Thus, the optimum initial catalyst loading must be investigated independently. However, interestingly, although various catalyst loadings were applied, the tendency regarding the crystallite size was consistent. All catalyst loading variations agree that the increases in the crystallite size have a positive correlation to the increases in the photocatalytic rate.
In addition, the above results showed that the photocatalytic rate of all WO3 samples was relative slower than that of other nanoparticle-typed WO3 samples (Arutanti et al., 2014b). Solid WO3 micrometer particles is limited by excessive light penetration on the outer surface of the particle only, preventing the WO3 activated site inside of the particle for absorbing photons (Nandiyanto et al., 2009a). However, micrometer-sized particle is the best particle for understanding the correlation between crystallite size and photocatalytic performance. Specifically, when employing the micrometer-sized particles, the obstacles that can disturb the measurement (i.e. the particle size and quantum effect (Marotti et al., 2006), as well as contamination from nano-catalyst to the characterized sample (Nandiyanto et al., 2009b)) can be minimized. However, further analysis for the optimization of catalytic particles such as analysis in detail about the surface area is still required in the future work. In addition, we believed that the use of micrometer-sized particles will give more advantages since they are reusable and effective in industrial applications.
5 Conclusion
The influence of crystallite sizes on the photocatalytic characteristics of monoclinic WO3 particles has been systematically investigated and discussed along with the theoretical consideration and the proposal of the particle formation as well as the phenomena that occur during the photocatalytic process. To ensure the analysis of crystallite size, the crystallite sizes were controlled independently in the constant particle outer diameters by changing the temperature of the thermal decomposition of ATP. The results showed that the crystallite size plays an important role in the photocatalytic process, where increases in the crystallite size have a direct impact on the enhancement catalytic performance. The tendency for the effect of crystallite size on the catalytic performance has been also confirmed by varying the amount of catalyst for the photocatalytic process.
Acknowledgements
RISTEK DIKTI (Grant-in-aid Penelitian Terapan Unggulan Perguruan Tinggi (PTUPT) and Penelitian Produk Terapan (PPT)) is acknowledged.
References
- Carbon/nitrogen-doped TiO2: new synthesis route, characterization and application for phenol degradation. Arab. J. Chem.. 2016;9(2):229-237.
- [Google Scholar]
- Alshammari, A., Bagabas, A., Assulami, M., 2019. Photodegradation of rhodamine B over semiconductor supported gold nanoparticles: the effect of semiconductor support identity. Arabian J. Chem. 12, 1406–1412.
- Particle size distribution and hydrodynamic characteristics of solid matter carried by runoff from motorways. Water Environ. Res.. 1999;71(4):398-407.
- [Google Scholar]
- Promotion effect of CuO co-catalyst on WO3-catalyzed photodegradation of organic substances. Catal. Commun.. 2008;9(6):1254-1258.
- [Google Scholar]
- Effect of annealing treatment on the photocatalytic activity of TiO2 thin films deposited by dc reactive magnetron sputtering. J. Phys.: Conf. Series. 2015;614:012008.
- [Google Scholar]
- Armaković, S.J., Grujić-Brojčin, M., Šćepanović, M., Armaković, S., Golubović, A., Babić, B., Abramović, B.F. 2019. Efficiency of La-doped TiO2 calcined at different temperatures in photocatalytic degradation of β-blockers. Arabian J. Chem. 12, 5355–5369.
- Synthesis of composite WO3/TiO2 nanoparticles by flame-assisted spray pyrolysis and their photocatalytic activity. J. Alloy. Compd.. 2014;591:121-126.
- [Google Scholar]
- Controllable crystallite and particle sizes of WO3 particles prepared by a spray-pyrolysis method and their photocatalytic activity. AIChE J.. 2014;60(1):41-49.
- [Google Scholar]
- Influences of porous structurization and Pt addition on the improvement of photocatalytic performance of WO3 particles. ACS Appl. Mater. Interf.. 2015;7(5):3009-3017.
- [Google Scholar]
- Role of heterojunction ZrTiO4/ZrTi2O6/TiO2 photocatalyst towards the degradation of paraquat dichloride and optimization study by Box-Behnken design. Arabian J. Chem.. 2017;10(7):935-943.
- [Google Scholar]
- Study of photocatalytic asset of the ZnSnO3 synthesized by green chemistry. Arabian J. Chem.. 2017;10(1):S404-S411.
- [Google Scholar]
- Synergistic effect of crystal and electronic structures on the visible-light-driven photocatalytic performances of Bi2O3 polymorphs. Phys. Chem. Chem. Phys.. 2010;12(47):15468-15475.
- [Google Scholar]
- Production of high-purity TeO2-ZnO and TeO2-WO3 glasses with the reduced content of OH-groups. J. Optoelect. Adv. Mater.. 2007;9(10):3229-3234.
- [Google Scholar]
- Structure and electronic properties of amorphous WO3. Phys. Rev. B. 1999;60(24):16463.
- [Google Scholar]
- Photocatalytic activity of TiO2 doped with Zn2+ and V5+ transition metal ions: influence of crystallite size and dopant electronic configuration on photocatalytic activity. Mater. Sci. Eng., B. 2010;166(1):1-6.
- [Google Scholar]
- Thermal decomposition of ammonium paratungstate tetrahydrate under non-reducing conditions: characterization by thermal analysis, X-ray diffraction and spectroscopic methods. Thermochim. Acta. 2008;469(1):12-22.
- [Google Scholar]
- Structural study of nanocrystalline tungsten trioxide. Integr. Ferroelectr.. 2011;123(1):81-86.
- [Google Scholar]
- Granqvist, C.G. (Ed.), 1995. Handbook of Inorganic Electrochromic Materials. Elsevier.
- Bright blue phosphors in ZnO–WO3 binary system discovered through combinatorial methodology. Appl. Phys. Lett.. 2003;82(9):1365-1367.
- [Google Scholar]
- Structure and thermal decomposition of ammonium metatungstate. J. Therm. Anal. Calorim.. 2014;116(1):329-337. http://www.tungsten-powder.com/AMT-APT-difference.html (retrieved on 29 September 2017)
- [Google Scholar]
- The hydrothermal synthesis of mesoporous TiO2 with high crystallinity, thermal stability, large surface area, and enhanced photocatalytic activity. Appl. Catal. A. 2007;323:110-118.
- [Google Scholar]
- Influence of crystallite structure of nanometer TiO2 catalysts on photocatalyst reaction. Sci. China B. 2002;45(1):60-67.
- [Google Scholar]
- Influence of calcination parameters on the TiO2 photocatalytic properties. Mater. Chem. Phys.. 2011;125(1):20-25.
- [Google Scholar]
- Comparative evolved gas analyses (TG-FTIR, TG/DTA-MS) and solid state (FTIR, XRD) studies on thermal decomposition of ammonium paratungstate tetrahydrate (APT) in air. J. Anal. Appl. Pyrolysis. 2004;72(2):197-201.
- [Google Scholar]
- Crystallite size dependence of band gap energy for electrodeposited ZnO grown at different temperatures. Solar Energ. Mater. Solar Cells. 2006;90(15):2356-2361.
- [Google Scholar]
- Nadarajan, R., Bakar, W.A.W.A., Ali, R., Ismail, R., 2018. Photocatalytic degradation of 1, 2-dichlorobenzene using immobilized TiO2/SnO2/WO3 photocatalyst under visible light: application of response surface methodology. Arabian J. Chem. 11, 34–47.
- Synthesis and structure of nanocrystalline TiO2 with lower band gap showing high photocatalytic activity. Langmuir. 2004;20(7):2900-2907.
- [Google Scholar]
- Macroporous anatase titania particle: aerosol self-assembly fabrication with photocatalytic performance. Chem. Eng. J.. 2009;152(1):293-296.
- [Google Scholar]
- Synthesis of spherical mesoporous silica nanoparticles with nanometer-size controllable pores and outer diameters. Micropor. Mesopor. Mater.. 2009;120(3):447-453.
- [Google Scholar]
- Synthesis of spherical macroporous WO3 particles and their high photocatalytic performance. Chem. Eng. Sci.. 2013;101:523-532.
- [Google Scholar]
- Influences of temperature on the conversion of ammonium tungstate pentahydrate to tungsten oxide particles with controllable sizes, crystallinities, and physical properties. Indonesian J. Chem.. 2016;16(2):124-129.
- [Google Scholar]
- Photodecomposition profile of organic material during the partial solar eclipse of 9 March 2016 and its correlation with organic material concentration and photocatalyst amount. Indonesian J. Sci. Technol.. 2016;1(2):132-155.
- [Google Scholar]
- Decomposition behavior of curcumin during solar irradiation when contact with inorganic particles. IOP Conf. Series: Mater. Sci. Eng.. 2017;180:012135.
- [Google Scholar]
- Extraction of curcumin pigment from Indonesian local turmeric with its infrared spectra and thermal decomposition properties. IOP Conf. Series: Mater. Sci. Eng.. 2017;180:012136.
- [Google Scholar]
- Photocatalytic activity of amorphous-anatase mixture of titanium (IV) oxide particles suspended in aqueous solutions. J. Phys. Chem. B. 1997;101(19):3746-3752.
- [Google Scholar]
- Low-temperature deposition of TiO2 thin films with photocatalytic activity from colloidal anatase aqueous solutions. Chem. Mater.. 2001;13(8):2567-2573.
- [Google Scholar]
- Synthesis of titanium dioxide nanoparticles with mesoporous anatase wall and high photocatalytic activity. J. Phys. Chem. B. 2005;109(11):4947-4952.
- [Google Scholar]
- Radhika, N., Selvin, R., Kakkar, R., Umar, A., 2019. Recent advances in nano-photocatalysts for organic synthesis. Arabian J. Chem. 12, 4550–4578.
- Solar photocatalytic degradation of azo dye: comparison of photocatalytic efficiency of ZnO and TiO2. Solar Energ. Mater. Solar Cells. 2003;77(1):65-82.
- [Google Scholar]
- Crystallographically oriented mesoporous WO3 films: synthesis, characterization, and applications. J. Am. Chem. Soc.. 2001;123(43):10639-10649.
- [Google Scholar]
- Sharma, J., Vashishtha, M., Shah, D., 2014. Crystallite size dependence on structural parameters and photocatalytic activity of microemulsion mediated synthesized ZnO nanoparticles annealed at different temperatures. Global J. Sci. Front. Res. 14(5).
- Singh, P., Priya, B., Shandilya, P., Raizada, P., Singh, N., Pare, B., Jonnalagadda, S., 2019. Photocatalytic mineralization of antibiotics using 60% WO3/BiOCl stacked to graphene sand composite and chitosan. Arabian J. Chem. 12, 4627–4645.
- Synthesis of tungsten oxide nanoparticles by acid precipitation method. Ceram. Int.. 2007;33(6):931-936.
- [Google Scholar]
- Stability and controlled composition of hexagonal WO3. Chem. Mater.. 2008;20(12):4116-4125.
- [Google Scholar]
- Low-energy bead-milling dispersions of rod-type titania nanoparticles and their optical properties. Adv. Powder Technol.. 2014;25(5):1492-1499.
- [Google Scholar]
- Effect of crystallinity of TiO2 on its photocatalytic action. Chem. Phys. Lett.. 1991;187(1–2):73-76.
- [Google Scholar]
- Synthesis of WO3 catalytic powders: evaluation of photocatalytic activity under NUV/visible light irradiation and alkaline reaction pH. J. Sol-Gel. Sci. Technol.. 2015;76(1):120-128.
- [Google Scholar]
- Crystallisation and processing of ammonium paratungstate (APT) Int. J. Refract Metal Hard Mater.. 1995;13(1–3):61-76.
- [Google Scholar]
- Nanocrystalline TiO2 films studied by optical, XRD and FTIR spectroscopy. J. Non-Cryst. Solid.. 2002;303(1):134-138.
- [Google Scholar]
- Bi2WO6 nano and microstructures: shape control and associated visible-light-driven photocatalytic activities. Small. 2007;3(9):1618-1625.
- [Google Scholar]
- Designed highly effective photocatalyst of anatase TiO2 codoped with nitrogen and vanadium under visible-light irradiation using first-principles. Catal. Lett.. 2008;124(1–2):111-117.
- [Google Scholar]


