

Translate this page into:
Corrosion of underground pipelines in clay soil with varied soil layer thicknesses and aerations
⁎Corresponding author. fcheng@ucalgary.ca (Y. Frank Cheng)
-
Received: ,
Accepted: ,
This article was originally published by Elsevier and was migrated to Scientific Scholar after the change of Publisher.
Peer review under responsibility of King Saud University.
Abstract
Underground pipelines suffer from corrosion in the soil. In this work, weight-loss testing, electrochemical measurements and surface analysis techniques were used to investigate the pipeline steel corrosion in a Regina clay soil with varied soil layer thicknesses and gassing conditions (i.e., aerobic, CO2-containing and anaerobic). Results demonstrate that the steel corrosion is dependent on the soil layer thickness, where a maximum corrosion rate is recorded under the 5 mm thick soil due to the competitive impact of the blocking effect of the soil layer and its moisture-retaining ability on the corrosion. In thin soil layers, the corrosion is accelerated with the increasing soil thickness due to more water contained in the soil. With the further increase of the soil layer thickness, the blocking effect of the soil on diffusion of corrosive species is dominant. The corrosion of the steel also depends heavily on the gassing condition in the soil. Under the specific soil layer thickness, the steel suffers from the highest corrosion rate in aerobic soil, which is followed by the 5% CO2/N2-containing soil. The steel corrosion is negligible (0.006 mm/y only) when the soil is purged with N2. In addition to uniform corrosion, localized corrosion occurs on the steel under soil due to its heterogeneous nature at a much greater rate than the uniform corrosion. The maximum localized corrosion rates in 5% CO2/N2-containing 5 mm thick soil layer and in the 3 mm thick soil that is open to air are 1.03 mm/y and 0.72 mm/y, respectively. As a comparison, the uniform corrosion rates are 0.05 mm/y and 0.04 mm/y under the two conditions.
Keywords
Corrosion
Pipelines
Soil
Soil layer thickness
Aeration

1 Introduction
Corrosion has been considered as one of primary reasons leading to failures of various industry facilities such as pipelines, concretes structures, bridges, etc., resulting in huge economic loss (Wang et al., 2019; Dai et al., 2019). External corrosion has been identified as one of the primary mechanisms causing failures of oil/gas transmission pipelines in soil, and potentially, adverse impact to the environment and communities (Canadian Energy Pipeline Association, 2015; Cheng, 2016). Generally, underground pipelines have a minimum depth of earth cover to reduce the risk of external damage to them and the risk to people and properties nearby. Corrosion occurs at coating failures, where the applied cathodic protection (CP) current is shielded from reaching the steel for corrosion prevention (Cheng and Norsworthy, 2017). Pipeline corrosion is complex, and the complexity is associated with the unique properties of the soil, as well as interaction of multiple variables, such as pH, moisture, porosity, aeration, temperature, redox potential, microbiological activity, etc., in the environment. Although major efforts have been made to investigate the pipeline corrosion phenomenon, there are still many issues remaining unclear in terms of the unique role of soil in the steel corrosion.
The external corrosion of pipelines depends heavily on the type and properties of the soil where they are buried (Dang et al., 2015; He et al., 2015; Liu and Cheng, 2017). The structure and chemical composition of the soil change with the buried locations of the pipelines. At low elevations in poorly drained disturbed soils, such as clays and tidal marshes, there may be severe corrosion occurring due to soil shrinkage causing a large differential-aeration and the accumulation of salts increasing the electrical conductivity (El-Shamy et al., 2015). The soils with a pH range of 6–8 can result in an increased corrosion, as compared to the soils with alkaline pH values (Benmoussa et al., 2006). Corrosion products would remain on the steel surface in soils, providing somewhat protection to the steel for the further corrosion (Yan et al., 2014). The corrosion products, which are usually iron oxides, would change the potential of the pipeline steel. It is thus suggested that this be taken into consideration when applying CP for corrosion protection, while avoiding overprotection (López et al., 2011). Moreover, the rate of oxygen diffusion towards the steel surface is low in clay soils, which would greatly influence corrosion as oxygen serves as the cathodic depolarizer in aerobic soils (Gadala et al., 2016).
Of various factors affecting pipeline corrosion in soil, some important ones that have been identified include the soil layer thickness, moisture and aeration. The authors’ previous work (Liu and Cheng, 2018) found that the corrosion rate of steels increased with the moisture content in the soil due to the increased conductivity. In the presence of microorganism in the soil, the moisture favors the growth of bacterial community, facilitating the so-called microbiologically influenced corrosion. However, there has been limited work to investigate the soil corrosion of steels under various gassing conditions. Generally, the presence of air in the soil due to its porous structure can lead to oxygen corrosion. Another important gas present in the soil is CO2, which is generally generated by decay of organic matters and can decrease the electrolyte pH, resulting in the so-called CO2 corrosion. The synergism of porous corrosion products and CO2 corrosion can considerably facilitate localized corrosion, especially in the presence of microorganism, causing pipeline leaking (Zhang and Cheng, 2011; Liu et al., 2016). Thus, the aeration of the soil would affect the corrosion rate and corrosion mechanism. Furthermore, the soil can act as a barrier hindering the diffusion of O2 and CO2 to the steel surface. The thickness of the soil layer is expected to affect the aeration and moisture content of the soil, and thus, the corrosion of the steel. The soil layer thickness can alter the environmental condition such as the moisture content and nutrients to affect the microbiological growth and the microbial corrosion (Hongwei Liu, 2018). Up to date, most work investigating pipeline corrosion have been conducted in either extracted or simulated soil solutions (Gadala and Alfantazi, 2014; Kuang and Cheng, 2014; Wang et al., 2015), lacking essential understanding of the corrosion process occurring in soils.
The authors’ previous work investigated the pipeline corrosion in soils with varied moisture contents. This work focused on the mechanistic aspects of the effect of soil layer thickness and aeration on corrosion of an X52 pipeline steel using weight-loss testing, electrochemical measurements and surface analysis techniques. Particularly, the occurrence of localized corrosion on the steel in the soil was paid much attention.
2 Experimental
2.1 Specimens and soil
Test specimens were cut from an X52 steel sheet with a dimension of 10 mm × 10 mm × 3 mm. The chemical composition of the steel contained (wt.%): C 0.24, Mn 1.40, Si 0.45, P 0.025, S 0.015, V 0.10, Nb 0.05, Ti 0.04 and Fe balance. The yield and tensile strengths of the steel are 360 MPa and 468 MPa, respectively. The steel specimens for electrochemical measurements were sealed in epoxy resin, leaving a working face of 10 mm × 10 mm. The specimens used for weight-loss testing had a dimension of 20 mm × 10 mm × 2 mm. In preparation of the surface condition of the specimens, the work face of the specimen for electrochemical measurements and all faces of the weight-loss testing specimens were ground with 120, 200, 400, 600, 800 and 1200 grit silicon carbide papers, cleaned in distilled water and acetone, and dried in high-purity nitrogen (99.999%).
The soil used in this work was sampled from the burial depth of the pipeline under investigation located in Regina, Canada. The soil was thus named Regina clay soil. The chemical composition of the soil-extracted solution contained (wt. %): NaHCO3 0.076, NaCl 0.0089, NaNO3 0.0014, Na2SO4 0.0773, K2SO4 0.0619, CaSO4−2H2O 0.8823, MgSO4-7H2O 0.3226, and H2O balance. The soil was ground by hand, and filtered through a sieve with a dimeter of 0.4 mm. The soil particles were smaller than or equal to 0.4 mm in diameter. Prior to testing, the soil was dried and sterilized at 100 °C for 4 h. The processed soil and distilled water were mixed in a 5:3 ratio to prepare the wet soil. Authors’ previous work (Liu and Cheng, 2017) demonstrated that the water content in the soil affected the steel corrosion. When the water content was low, the steel corrosion was slow and non-uniform. In this work, a relatively high water content in the soil (i.e., the soil:water ratio of 5:3) was selected in order to maintain a stable corrosion status on the steel, while studying the influences of the soil layer thickness and aeration on the corrosion behavior.
To investigate corrosion in the soil with varied aerations, the water was purged with gases such as air, N2 or 5% CO2/N2 for 4 h, and then the wet soil was prepared in a closed chamber with the controlled gassing condition. The dissolved oxygen contents in the presence of air, N2 and 5% CO2/N2 were 7.7 ppm, 1.3 ppm and 0.4 ppm, respectively, as measured by an oxygen sensor (Model ExStik DO600).
2.2 Weight-loss testing
In this work, ASTM G102 standard was followed for weight-loss testing and electrochemical measurements to determine the uniform corrosion rate (ASTM G102, 1989). Weight-loss testing was conducted on the X52 steel coupons after 10 days of burial in the prepared wet soil. After testing, the soil was removed from the specimen surface by cleaning with distilled water. The corrosion products were removed using a pickling solution containing corrosion inhibitor (i.e., imidazoline derivative) for 3 min. The coupons were immediately rinsed with distilled water, cleaned in acetone and absolute ethanol, and dried using high-purity N2. The weight of the coupon was measured by an electronic balance with a precision of 10 mg. The corrosion rate (mm/y) of the steel was calculated by (Liu et al., 2017):
To ensure the repeatability of the testing results, three steel coupons were used under each test condition.
2.3 Corrosion morphology observation
After 10 days of burial in the wet soil, the steel specimens were washed with distilled water to remove soil from the surface. The specimen was then coated with a platinum film (0.5 µm thick) with a sputter coater to increase the electrical conductivity, and then observed by scanning electron microscopy (SEM). The corrosion morphology after removing the corrosion products was characterized using a Zeta 3D stereoscopic microscope to obtain the corrosion depth data to derive the localized corrosion rate.
2.4 Electrochemical measurements
Electrochemical measurements including open-circuit potential (OCP), electrochemical impedance spectroscopy (EIS) and potentiodynamic polarization curves, were performed using a Solartron 1280C electrochemical workstation on a three-electrode cell, where the steel specimen was the working electrode, a platinum plate was the counter electrode, and a saturated calomel electrode (SCE) was the reference electrode. The schematic of diagram of the experimental setup is shown in Fig. 1, where x represents the soil layer thickness, and CE, WE and RE refer to counter electrode, working electrode and reference electrode, respectively. The soil layer with the thicknesses of 3 mm, 5 mm, 10 mm and 15 mm were selected to investigate the effect of the soil thickness on corrosion. The exact soil thickness was maintained through a home-made cylindrical PVC pipe with the heights of 3 mm, 5 mm, 10 mm and 15 mm, which was full of the soil and placed on the surface of the steel electrode. The gassing conditions, including air, N2 and 5% CO2/N2 were used to study the steel corrosion under varied aerations in the soil.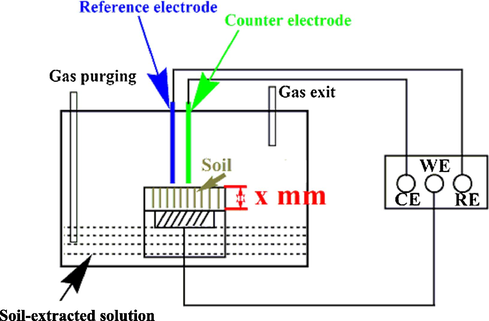
Schematic diagram of the experimental setup for electrochemical measurements.
After the OCP of the steel reached a steady state, the EIS was measured by applying a sinusoidal voltage signal of 10 mV in a frequency range of 10−2 to 2 × 10⁴ Hz at the corrosion potential of the steel. The impedance data were analyzed and fitted with the Zview software (Scribner, Inc.). Potentiodynamic polarization curves were measured on the steel specimen at a potential sweep rate of 0.5 mV/s over the potential range of −250 mV vs. OCP to +300 mV vs. OCP at the last day of the testing. The Cview software (Scribner, Inc.) was used to analyze the electrochemical corrosion parameters. The corrosion rate derived from the electrochemical measurements is mainly for uniform corrosion. All measurements were performed at room temperature of ∼22 °C. To ensure the reproducibility of the testing results, all tests were repeated at least three times.
3 Results
3.1 Morphological characterization of corrosion products
The SEM images of the steel coupons after 10 days of burial in 5% CO2/N2-containing soil with varied thicknesses are shown in Fig. 2. It is seen that porous corrosion products are present the steel surface when the soil layer is 3 mm thick (Fig. 2a). For the soil thickness of 5 mm, some large corrosion product particles are observed (Fig. 2b), with more corrosion products present. With the increase of the soil layer thickness to 10 mm and 15 mm, the corrosion products tend to show reduced amount, with some corrosion product particles (Fig. 2c and 2d). The results show that, generally, with the increased soil layer thickness, the amount of the generated corrosion products reduces.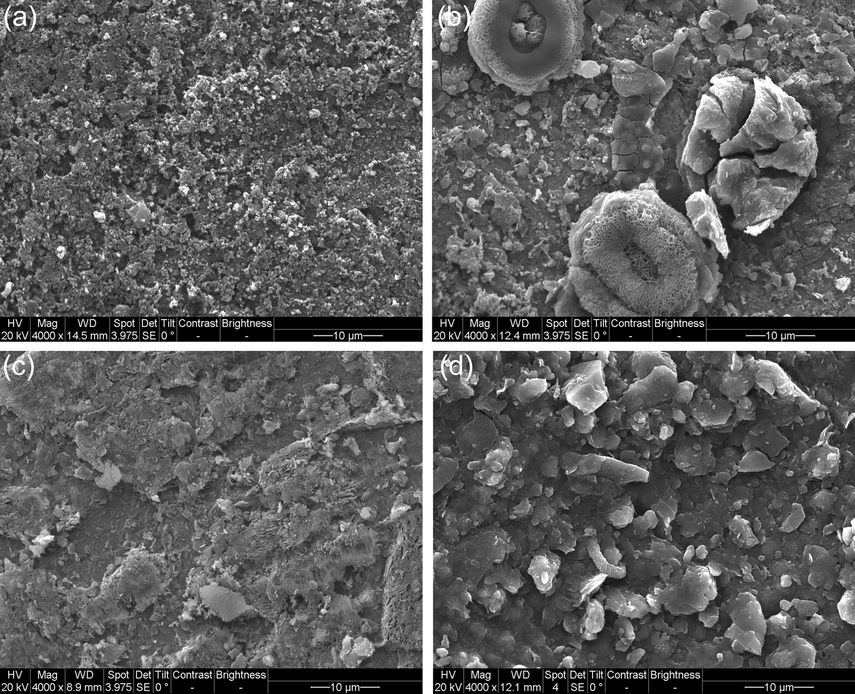
SEM images of the steel coupons after 10 days of burial in 5% CO2/N2-containing soil with varied thicknesses (a) 3 mm, (b) 5 mm, (c) 10 mm, (d) 15 mm.
The SEM images of the steel coupons after 10 days of burial in the 3 mm thick soil under various gassing conditions are shown in Fig. 3. There are few corrosion products generated on the steel coupon in the presence of N2 (Fig. 3a). When the wet soil is open to air, the corrosion product film is cracked, which is usually the feature of a thick film formation. Many corrosion product particles are present on the surface (Fig. 3b). When the soil contains 5% CO2/N2, the corrosion products are porous (Fig. 3c). Obviously, the gassing condition in the soil affects the steel corrosion in terms of the corrosion product morphology.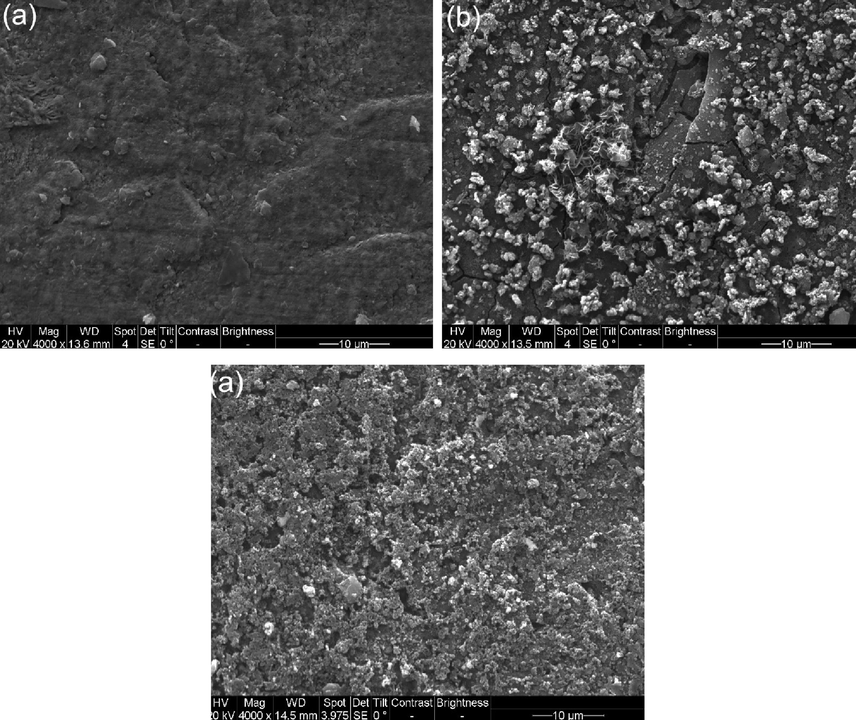
SEM images of the steel coupons after 10 days of burial in the 3 mm thick soil under various gassing conditions (a) N2; (b) air; (c) 5% CO2/N2.
3.2 Weight-loss testing
Fig. 4 shows the corrosion rates of the steel calculated from the weight-loss testing after 10 days of burial in 5% CO2/N2-containing wet soil with varied thicknesses and in 3 mm thick soil layer under different gassing conditions. It is noted that the corrosion rate determined after 10 days of testing in soil may not represent the long-term corrosion behavior of the pipeline steel in the field. It is seen that, initially, the corrosion rate of the steel increases as the soil layer increases from 3 mm to 5 mm. The maximum corrosion rate of 0.050 ± 0.010 mm/y is recorded in the 5 mm thick soil (Fig. 4a). The corrosion rate then decreases as the soil layer thickness further increases. In this work, the smallest corrosion rate of 0.016 ± 0.006 mm/y is found in the soil layer of 15 mm in thickness.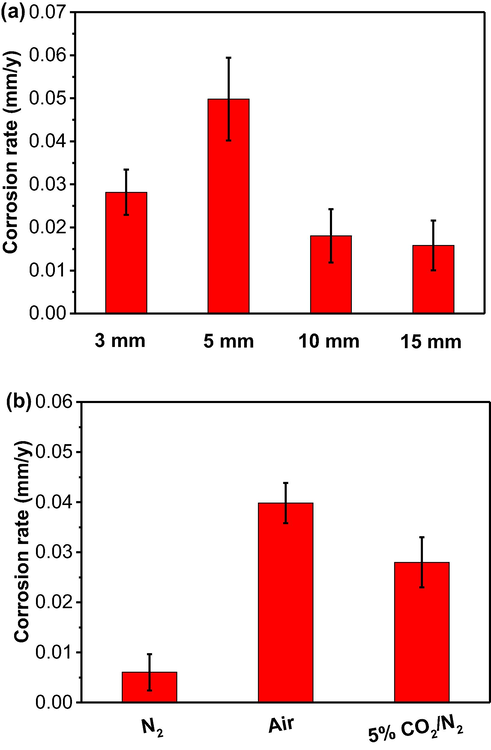
Corrosion rates of the steel calculated from the weight-loss testing after 10 days of burial in (a) 5% CO2/N2-containing wet soil with varied thicknesses, and (b) 3 mm thick soil under different gassing conditions.
The gassing condition also affects the corrosion rate in the soil layer with a fixed thickness of 3 mm. Generally, the gassing condition affects the steel corrosion under soil by diffusing through the soil layer and reaching the steel surface. The blocking effect against the gas diffusion increases with the increase in the soil layer thickness. In order to conveniently and firmly recognize the role of gassing condition in corrosion of the steel, the soil layer with a small thickness (i.e., 3 mm) is selected in this work. In the presence of N2, the corrosion of the steel is negligible, with a corrosion rate of 0.006 ± 0.004 mm/y only (Fig. 4b). When air is available, the corrosion rate increases to 0.040 ± 0.004 mm/y. In the presence of 5% CO2/N2, the corrosion rate of the steel is 0.028 ± 0.005 mm/y, indicating that the oxygen corrosion is more serious than the corrosion caused by 5% CO2 in the soil layer. The weight-loss testing results show that the soil layer thickness affects the corrosion rate of the steel, with the maximum corrosion rate in the 5 mm thick soil layer in this work. Moreover, the steel corrosion is faster in aerobic soil than that containing 5% CO2 at the fixed soil thickness of 3 mm.
3.3 OCP and EIS measurements
The OCP of the steel electrode in 5% CO2/N2-containing soil with varied thicknesses and in the 3 mm thick soil under different gassing conditions as a function of time is shown in Fig. 5. It is seen that, after 10 days of testing, the OCP has achieved relatively steady values, indicating that the steel corrosion is under a stable condition. In 3 mm and 5 mm thick soil layers, the OCP increases first, and then gradually stabilizes after 3 days of testing (Fig. 5a). When the soil layers are 10 mm and 15 mm in thickness, the OCP drops initially, and then increases and keeps at steady values after 3 days of testing (Fig. 5a). The OCP values usually have a big scatter and do not have a clear dependence on the soil layer thickness. The steady values of the OCP recorded under the four thicknesses of the soil layer are between −0.740 V (SCE) and −0.730 V (SCE). For the steel specimen in the 3 mm soil layer in the presence of N2, the OCP is relatively steady at about −0.750 V (SCE) (Fig. 5b). In the presence of air, the steady state OCP is slightly less negative of about −0.746 V (SCE). When the soil contains 5% CO2/N2, the OCP is about −0.736 V (SCE).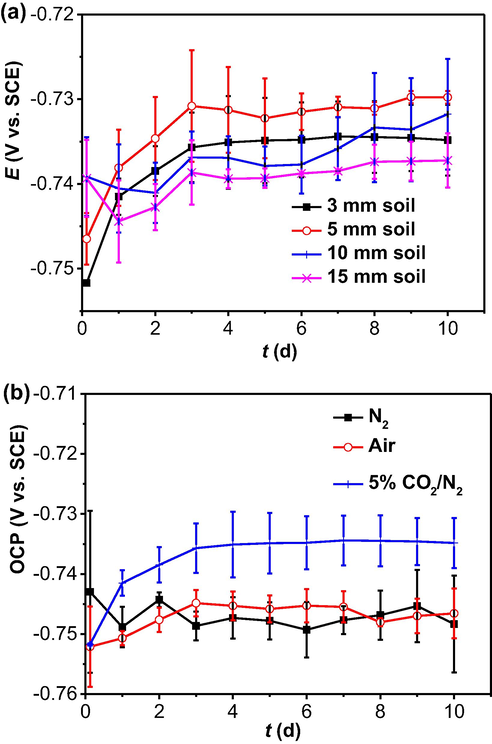
OCP of the steel electrode in (a) 5% CO2/N2-containing wet soil with varied thicknesses and (b) in the 3 mm thick soil layer under different gassing conditions as a function of time.
The Nyquist diagrams and Bode plots of the steel electrode in 5% CO2/N2-containing wet soil with varied thicknesses as a function of time are shown in Fig. 6. It is seen that all impedance plots feature of one semicircle over the measuring frequency range, which, combining with one maximum phase angle in Bode plots, indicates the impedance behavior with one time constant. Generally, the size of the semicircle is inversely proportional to corrosion rate of the steel. At the thin soil layer such as 3 mm in thickness, the diameter of the semicircle increases gradually with time. After 3 days of testing, the semicircle increases its size only slightly with time (Fig. 6a). When the soil layer is 5 mm, the semicircle increases its size with time, and does not change apparently after 3 days of testing (Fig. 6c). In the thick soil layers of 10 mm and 15 mm, the largest semicircles are recorded after 3 days and 1 day of testing, respectively. The diameter of the semicircle then reduces with time (Fig. 6e and g).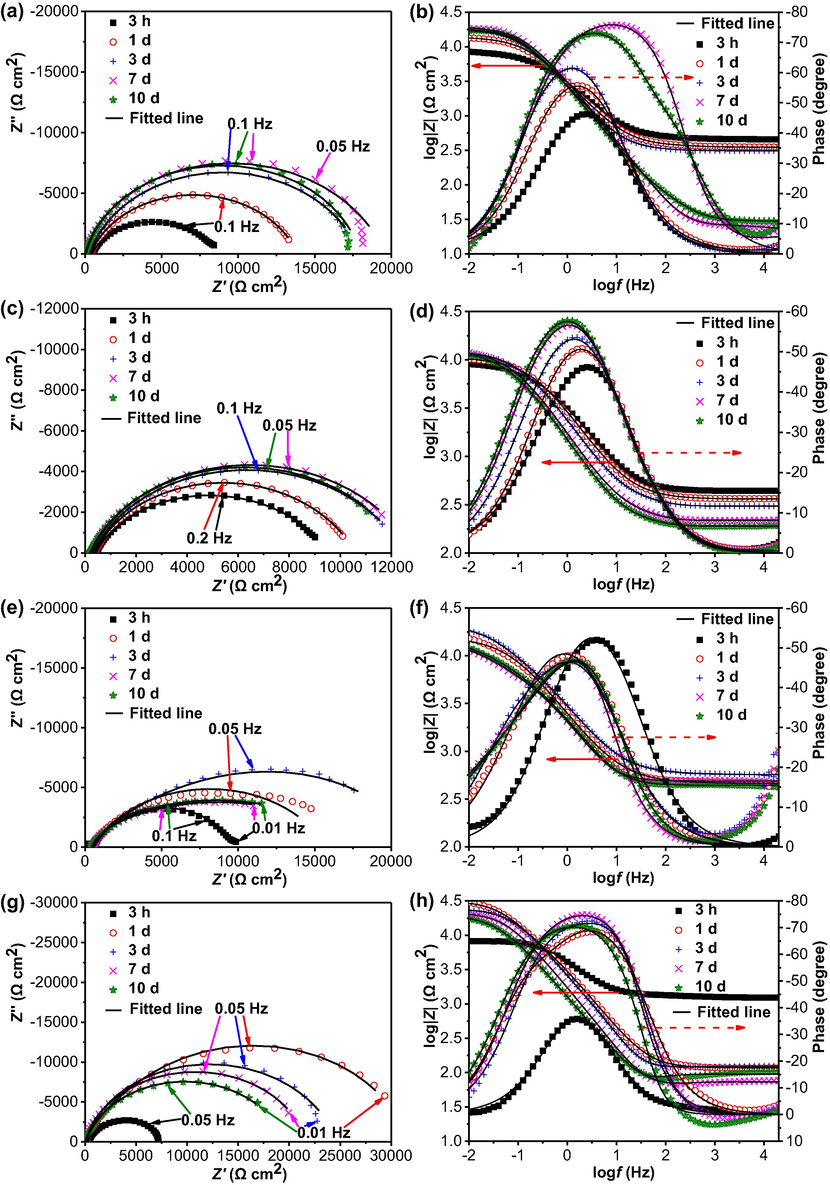
Nyquist diagrams and Bode plots of the steel electrode in 5% CO2/N2-containing wet soil with varied thicknesses (a, b) 3 mm, (c, d) 5 mm, (e, f) 10 mm, (g, h) 15 mm. The black lines represent the fitted results.
The EIS data are fitted using an equivalent circuit which includes a solution resistance (Rs) connected with the parallel connection of a constant-phase element of double-charge layer capacitor (Qdl) and a charge-transfer resistance (Rct). Fig. 7 shows the time dependence of Rct, where Rct is inversely proportional to corrosion rate. Quantitative comparisons of the effect of time on corrosion of the steel under varied soil layer thicknesses can thus be given. It is seen that there is the smallest and largest Rct values in 5 mm and 15 mm thick soil layers in specific testing time, indicating that the corrosion rates of the steel are the highest and the lowest in the soil layers of 5 mm and 15 mm thick, respectively. The EIS results are consistent with the weight-loss testing results in Fig. 4a. Moreover, the Rct values usually increases with time in thin soil layers (3 mm and 5 mm thick). When the soil layer is thick (10 mm and 15 mm), the Rct values increases first, and then decreases with time.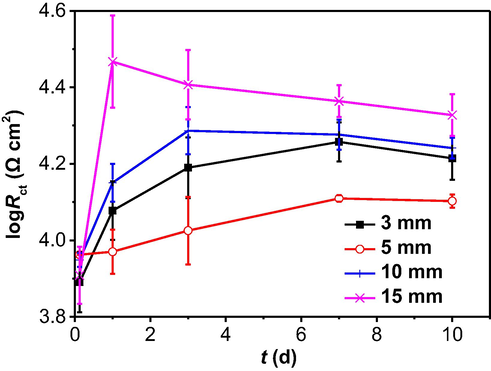
Time dependence of Rct fitted from the measured EIS data in the soil with varied thicknesses.
Fig. 8 shows the Nyquist diagrams and Bode plots of the steel electrode in the 3 mm thick soil layer with varied gassing conditions as a function of testing time. Identical to those in Fig. 6, all impedance plots are featured of one incomplete or complete semicircle over the measuring frequency range. There is one maximum phase angle in the Bode plots. In the presence of N2, the diameter of the semicircle increases with time. After 10 days, the incomplete semicircle is indicative of the approximately capacitive behavior (Fig. 8a). When air is present, the semicircles measured at specific testing days are smaller than those in the presence of N2, indicating that the oxygen accelerates the steel corrosion. After 1 day of testing, the size of the semicircle does not change greatly (Fig. 8c). In the presence of 5% CO2/N2, the diameter of the semicircle increases gradually with time. After 3 days of testing, the semicircle increases its size only slightly with time (Fig. 8e).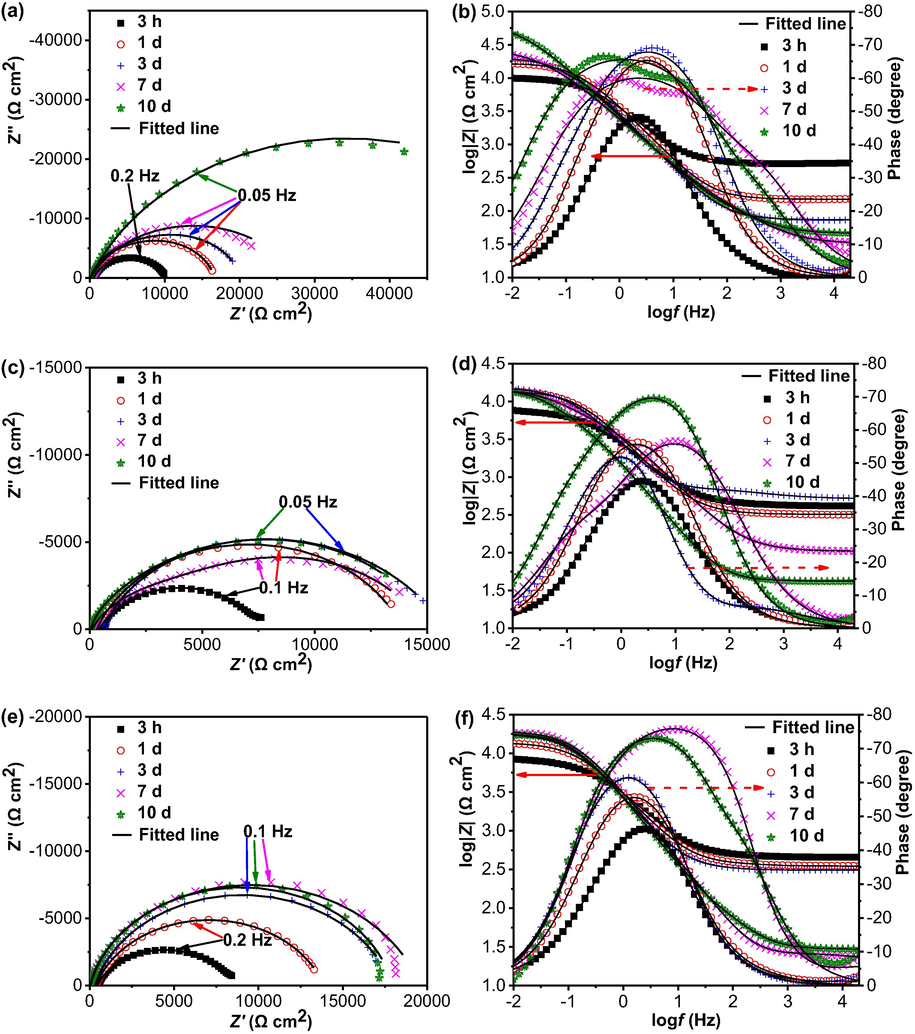
Nyquist diagrams and Bode plots of the steel electrode in the 3 mm thick soil layer with varied gassing conditions as a function of testing time (a, b) N2, (c, d) air, (e, f) 5% CO2/N2.
The measured impedance data in Fig. 8 are fitted using the same equivalent circuit as that for Fig. 6, and the time dependence of charge-transfer resistance is shown in Fig. 9. It is seen that, at specific testing times, there are the largest Rct values in the presence of N2, indicating the smallest corrosion rate under the condition. The Rct measured in the presence of air is larger than that with 5% CO2/N2, which means that the oxygen-accelerated corrosion is more apparent than 5% CO2 in this work. The result is consistent with the weight-loss testing in Fig. 4b.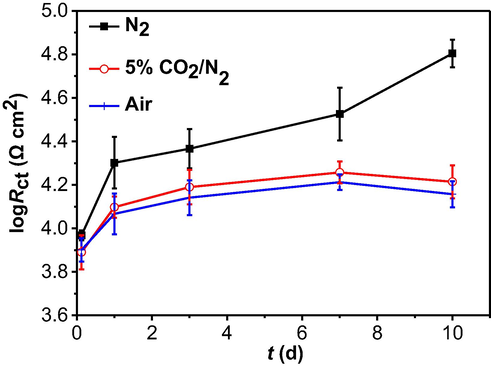
Time dependence of Rct fitted from the measured EIS data in the 3 mm thick soil layer with varied gassing conditions.
3.4 Potentiodynamic polarization measurements
After 10 days of testing in 5% CO2/N2-containing wet soil with varied thicknesses and in the 3 mm thick soil layer under different gassing conditions, potentiodynamic polarization curves are measured on the steel electrode, as shown in Fig. 10. It is seen that, in the 5% CO2-containing soil with varied thicknesses, both the anodic and cathodic reactions are activation controlled. The thick soil layers (10 mm and 15 mm thick) are associated with the decreased anodic and cathodic current densities at individual potentials. While there is the largest cathodic current density in the soil layer of 5 mm thick, the anodic branch is overlapped with that measured in the 3 mm thick soil layer.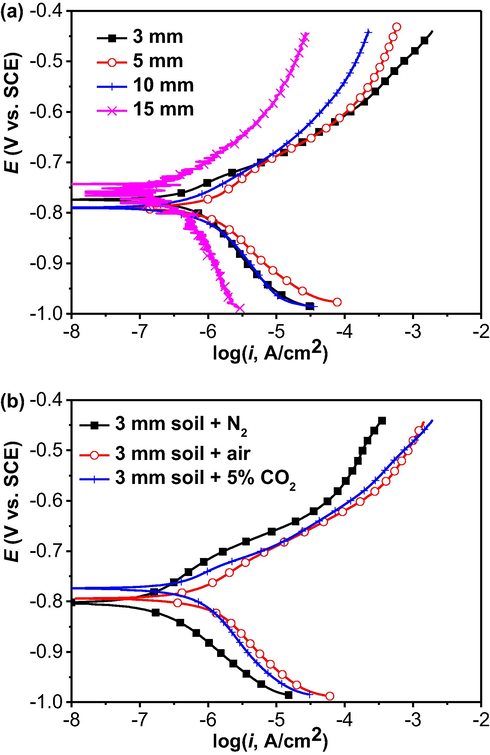
Potentiodynamic polarization curves of the steel electrode after 10 days of testing in (a) 5% CO2/N2-containing wet soil with varied thicknesses and (b) in the 3 mm thick soil layer under different gassing conditions.
For the polarization curves measured in the 3 mm thick soil layer under various gassing conditions, both the anodic and cathodic reactions are also activation controlled. The anodic and cathodic current densities are the smallest and the largest in the presence of N2 and air, respectively.
The electrochemical corrosion parameters are fitted from the measured data, and the results are shown in Table 1, where ba and bc are anodic and cathodic Tafel slopes, respectively, Ecorr is corrosion potential and icorr is corrosion current density. The largest icorr value of (8.92 ± 1.21) × 10−7 A/cm2 is measured in 5 mm thick soil layer in the presence of 5% CO2/N2. With the increasing soil layer thickness, the icorr decreases. When various gases are contained in the soil layer of 3 mm in thickness, there is the largest icorr value of (7.10 ± 0.87) × 10−7 A/cm2 in the presence of air. When 5% CO2/N2 is contained, the icorr decreases to (6.24 ± 1.27) × 10−7 A/cm2, which is higher than the icorr of (2.13 ± 0.59) × 10−7 A/cm2 measured in the presence of N2. The potentiodynamic polarization results are also consistent with the weight-loss testing (Fig. 4) and the EIS reuslts (Figs. 7 and 9).
ba (V/dec)
bc (V/dec)
Ecorr (V, SCE)
icorr (µA/cm2)
Corrosion rate (mm/y)
3 mm soil
0.074 ± 0.004
−0.155 ± 0.004
−0.774 ± 0.008
6.24 ± 1.27
0.072 ± 0.015
5 mm soil
0.089 ± 0.006
−0.108 ± 0.011
−0.805 ± 0.008
8.92 ± 1.21
0.103 ± 0.014
10 mm soil
0.094 ± 0.021
−0.135 ± 0.011
−0.772 ± 0.011
5.29 ± 1.25
0.061 ± 0.015
15 mm soil
0.115 ± 0.024
−0.147 ± 0.083
0.770 ± 0.017
4.15 ± 0.71
0.048 ± 0.008
3 mm soil + N2
0.102 ± 0.038
−0.107 ± 0.028
0.794 ± 0.009
2.13 ± 0.59
0.025 ± 0.007
3 mm soil + air
0.085 ± 0.012
−0.119 ± 0.014
0.793 ± 0.012
7.10 ± 0.87
0.082 ± 0.010
3 mm soil + 5% CO2/N2
0.074 ± 0.004
−0.155 ± 0.004
0.774 ± 0.008
6.24 ± 1.27
0.072 ± 0.015
3.5 Localized corrosion profile of the specimen after removal of corrosion products
Fig. 11 shows the corrosion morphology of the steel specimen after removing corrosion products after 10 days of testing in 5% CO2/N2-containing soil with varied thicknesses. Localized corrosion is observed, and the maximum corrosion depth in the 3 mm thick soil layer is about 16 μm (Fig. 11b). In the 5 mm thick soil, the maximum corrosion depth is up to about 30 μm (Fig. 11d). With the increase of the soil layer thickness to 10 mm and 15 mm, the maximum corrosion depths decrease to about 12 μm and 8 μm, respectively.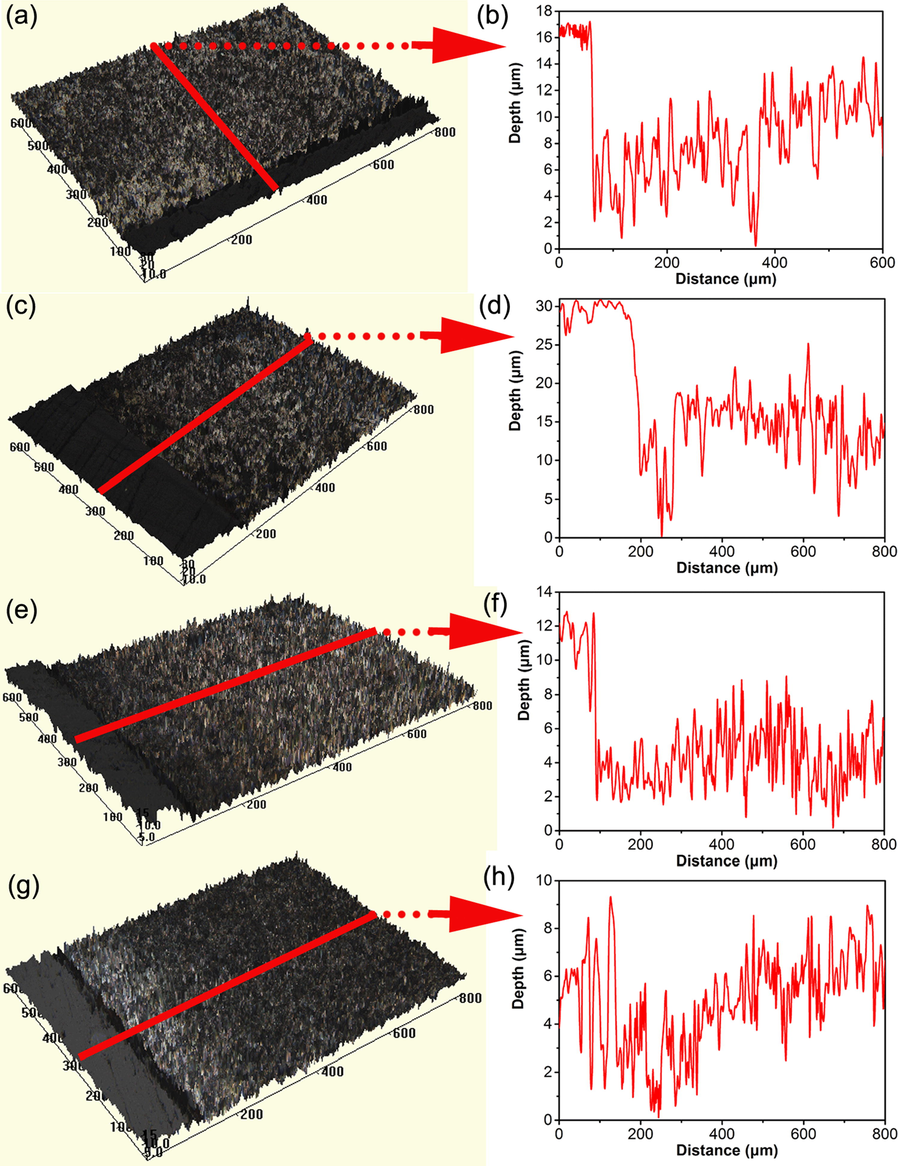
Corrosion morphology of the steel specimen after removing corrosion products after 10 days of testing in 5% CO2/N2-containing soil with varied thicknesses (a, b) 3 mm, (c, d) 5 mm, (e, f) 10 mm, (g, h) 15 mm.
The corrosion morphology of the steel specimen after removing corrosion products after 10 days of testing in the 3 mm thick soil layer with varied gassing conditions is shown in Fig. 12. It is seen that the surface of the specimen is relatively smooth in the presence of N2 (Fig. 12a), with the maximum corrosion depth of 4 μm only. In the presence of air, the maximum corrosion depth is about 20 μm (Fig. 12d). In the presence of 5% CO2/N2, the maximum corrosion depth of the specimen is about 16 μm (Fig. 12f).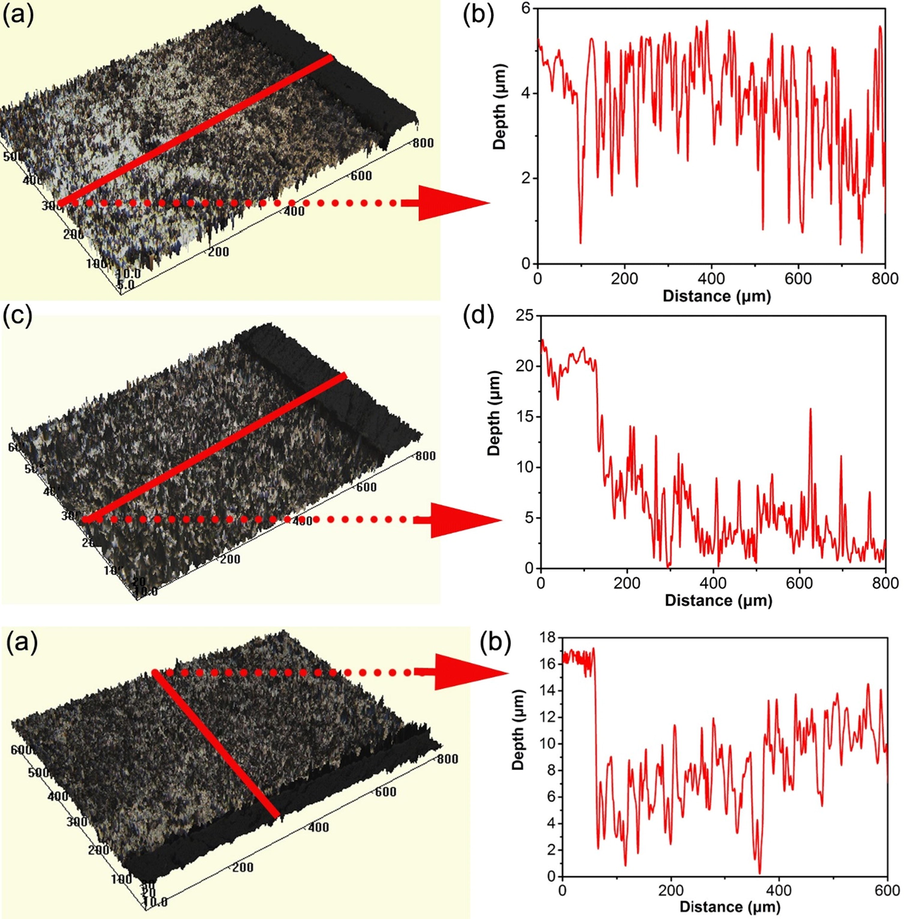
Corrosion morphology of the steel specimen after removing corrosion products after 10 days of testing in the 3 mm thick soil layer under varied gassing conditions (a) N2, (b) Air; (c) 5% CO2/N2.
The localized corrosion rate of the specimen over the imaged areas in Figs. 11 and 12 is calculated by the topographic software and the results are shown in Fig. 13. It is seen that the localized corrosion rates are considerably higher than the uniform corrosion rates obtained from the weigh-loss testing (Fig. 4) and potentiodynamic polarization measurements (Table 1). Particularly, in 5% CO2/N2-containing soil layers, the specimen in the 5 mm thick soil has the highest localized corrosion rate of (1.03 ± 0.25) mm/y. In the 3 mm thick soil layer under the different gassing conditions, there are the highest and lowest localized corrosion rates of (0.72 ± 0.14) mm/y and (0.18 ± 0.04) mm/y in the presence of air and N2, respectively.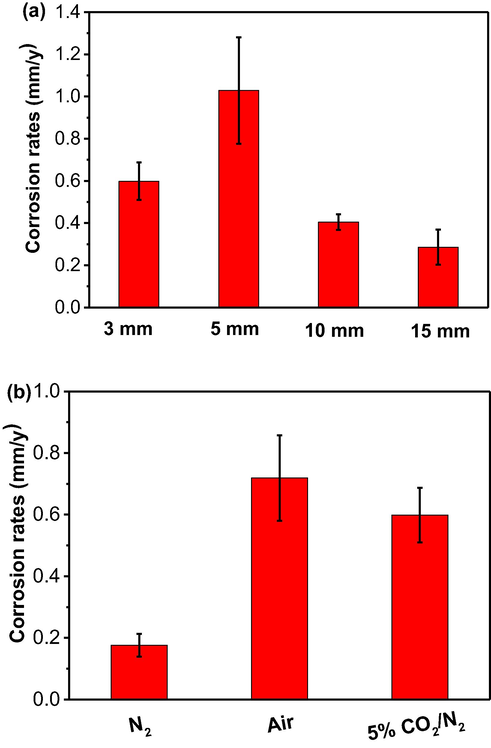
Localized corrosion rate of the steel over the imaged areas in Figs. 11 and 12 calculated by the topographic software in (a) 5% CO2/N2-containing soil with varied thicknesses, (b) the 3 mm thick soil layer under different gassing conditions.
4 Discussion
4.1 Pipeline corrosion in 5% CO2-containing soil and the effect of soil layer thickness
During corrosion of pipeline steels in 5% CO2-containing wet soil with a pH of 6.0, the anodic and cathodic reactions are the iron oxidation and the reduction of H2CO3 or bicarbonate ions, respectively (Zhang and Cheng, 2009):
Due to the blocking effect of the soil layer, the corrosion products, e.g., Fe2+, cannot leave the steel surface. As a result, the corrosion scale, FeCO3, can be generated either chemically or electrochemically: (Zhang and Cheng, 2009)
It is noted that the FeCO3 scale formed at low temperatures such as room temperature is not sufficiently compact compared to the scale formed at high temperatures, and thus, the protective ability of the scale is limited.
This work demonstrates that the soil layer thickness affects the steel corrosion, as confirmed by the results obtained from multiple measurement methods including weight-loss testing, EIS, potentiodynamic polarization and the 3D topographic profile mapping. Moreover, all results show that, of the four soil layer thicknesses under testing, there is the largest corrosion rate for the steel in the soil layer of 5 mm in thickness.
Corrosion of steels in the CO2-containing soil is dependent on the competitive impact of the blocking effect of the soil layer and its moisture-retaining ability (Usher et al., 2014; Alvarez and Steinbach, 2009). Generally, with the increase in the soil layer thickness, the blocking effect of the soil on diffusion of corrosive species or gases (such as CO2 in this work) towards the steel surface is enhanced, which would inhibit the steel corrosion. However, the content of water in the soil tends to accumulate to cause corrosion. In thin soil layers such as 3 mm in thickness, the 5% CO2/N2 purged in the test chamber diffuses through the soil layer and dissolves in water contained in the soil. The generated species such as H2CO3 and HCO-3 are relatively easy to reach the steel for cathodic reduction, accompanying the iron oxidation. The corrosion products, i.e., Fe2+, HCO-3 and CO2-3, would not leave the steel with the coverage of the soil layer. Instead, the porous corrosion scale, i.e., FeCO3, generates and deposits on the steel surface, as shown in Fig. 2a. When the soil layer thickness increases to 5 mm, the blocking effect is not apparently increased, but more water is contained in the soil to result in generation of more corrosive species, facilitating the steel corrosion. As a result, more corrosion products generate on the steel surface (Fig. 2b). Therefore, in thin soil layers, the steel corrosion is accelerated with the increase of the soil thickness due to more water contained in the soil. With the further increase of the soil layer thickness to 10 mm and 15 mm, the blocking effect of the soil layer on the diffusion of corrosive specie becomes dominant, where there is reduced amount of CO2 diffusing and reaching the steel surface for corrosion reaction. Thus, the corrosion rate of the steel decreases, as evidenced with the reduced amount of corrosion products (Fig. 2c and d).
Consistent with the above analysis on the role of the soil layer thickness in steel corrosion, the weight-loss results (Fig. 4) shows clearly that a maximum of corrosion rate is recorded in the soil thickness of 5 mm. The dependence of the corrosion rate on the soil layer thickness is also supported by the EIS results (Fig. 7) and potentiodynamic polarization measurements (Table 1). Mechanistically, the anodic polarization curves in Fig. 10a show the active dissolution state of the steel at specific potentials, which is consistent with the assumption that the iron carbonate scale generated at low temperatures is not sufficiently protective to make the steel “passivated”. Moreover, at specific cathodic potentials, there is the smallest cathodic current density in the soil layer thickness of 15 mm, indicating the reduced amount of species participating in the cathodic reaction due to the blocking effect of the soil. The highest cathodic current density is observed in the soil layer of 5 mm in thickness, which is attributed to the fact that more CO2 get dissolved in water in the soil, while the blocking effect of the soil layer is not significant.
4.2 Effect of the gassing condition of soil on the steel corrosion
This work shows that the corrosion of pipeline steel depends heavily on the gassing condition in the soil. The weight-loss testing, EIS and potentiodynamic polarization measurements confirm that, under the specific soil layer thickness, the steel suffers from the highest corrosion rate in aerobic soil, which is followed by the 5% CO2/N2-containing soil. The steel corrosion is negligible (0.006 mm/y only) in the presence of N2. The result is consistent with previous work (Cole and Marney, 2012; Berntsen et al., 2015).
In the presence of N2, the corrosion of the steel is marginal, with little corrosion products generated on the steel surface (Fig. 3a). In aerobic soil that is open to air, more corrosion products are generated, as indirectly supported by the cracks which are usually associated with thick films (Fig. 3b). The cathodic reaction is dominated by the reduction of dissolved oxygen:
In the measured cathodic polarization curve in Fig. 10b, the typical limiting diffusion current is not apparent in the presence of air. It is probably due to the thin soil layer (3 mm in thickness) where the diffusion-controlled cathodic reaction behavior is not important. However, at specific cathodic potentials, there is the highest cathodic current density in the soil layer open to air. Thus, when a soil contains CO2 at a limited concentration, such as 5% CO2 in this work, the CO2 accelerated corrosion is not as serious as the oxygen corrosion.
4.3 Localized corrosion of steel in the soil
This work also shows that the corrosion rates of the steel in wet soil with varied thicknesses and various gassing conditions usually do not exceed 0.05 mm/y by the weight-loss testing (Fig. 4). Thus, uniform corrosion does not constitute a big threat to the pipeline integrity. While the potentiodynamic polarization measurements show a bit higher value, the uniform corrosion rate of the steel is up to 0.10 mm/y in 5% CO2-containing soil layer of 3 mm thick (Table 1). However, localized corrosion occurs on the steel in soil at a much greater rate than the uniform corrosion. As analyzed by the topographic profiles in Fig. 13, the maximum localized corrosion rates recorded in 5% CO2/N2-containing 5 mm thick soil layer and in the 3 mm thick soil open to air are 1.03 mm/y and 0.72 mm/y, respectively. Apparently, localized corrosion is really an essential problem to result in the pipeline failure.
It has been accepted (Zhang and Cheng, 2011) that, in CO2-containing aqueous solutions, the localized corrosion of the steel is resulted from the galvanic effect between the iron carbonate scale-covered area and the pores, where the bare steel is exposed to the solution for continuous corrosion. In soils, the porous and heterogeneous structure of the soil layer is believed to cause a non-uniform blocking effect on the diffusion of corrosive species. Localized corrosion tends to occur and continues to grow at the locations where the pores exist to expose the steel to the corrosion species. The similar phenomenon was also reported by others’ work (Caleyo et al., 2009; Valor et al., 2014), where the heterogeneous nature of soils is usually associated with the localized corrosion occurrence.
5 Conclusions
Corrosion of pipeline steel in the 5% CO2/N2-containing soil is dependent on the soil layer thickness, where a maximum corrosion rate is recorded in the 5 mm thick soil layer. This is attributed to the competitive impact of the blocking effect of the soil layer and its moisture-retaining ability on the steel corrosion. In thin soil layers such as 3 and 5 mm in thickness, the corrosion is accelerated with the increasing soil thickness due to more water contained in the soil. With the further increase of the soil layer thickness to 10 mm and 15 mm, the blocking effect of the soil layer on diffusion of corrosive species is dominant. Thus, the corrosion rate of the steel decreases. The steel shows an active dissolution behavior in 5% CO2/N2-containing soil layers. The dependence of corrosion rate on the soil layer thickness is convinced by weight-loss testing, EIS and potentiodynamic polarization measurements.
The corrosion of pipeline steel also depends heavily on the gassing condition in the soil. Under the specific soil layer thickness, the steel suffers from the highest corrosion rate in aerobic soil, which is followed by the 5% CO2/N2-containing soil. The steel corrosion is negligible (0.006 mm/y only) when the soil is purged with N2.
The corrosion rates of the steel in soil with varied thicknesses and various gassing conditions usually do not exceed 0.05 mm/y by the weight-loss testing. Thus, uniform corrosion does not constitute a big threat to the pipeline integrity. However, localized corrosion occurs on the steel in soil, due to its heterogeneous nature, at a much greater rate than the uniform corrosion. The maximum localized corrosion rates recorded in 5% CO2/N2-containing 5 mm thick soil layer and in the 3 mm thick soil that is open to air are 1.03 mm/y and 0.72 mm/y, respectively. As a comparison, the uniform corrosion rates are 0.05 mm/y and 0.04 mm/y under the two conditions, respectively.
Acknowledgements
This work was supported by the University of Calgary.
References
- Concrete cracking prediction under combined prestress and strand corrosion. Struct. Infrastruct. Eng.. 2019;15:285-295.
- [Google Scholar]
- Prestress loss diagnostics in pre-tensioned concrete structures with corrosive cracking. J. Struct. Eng. 2019
- [CrossRef] [Google Scholar]
- Canadian Energy Pipeline Association, 2015 Pipeline Industry Performance Report. Calgary, AB, Canada, 2015.
- Pipeline Coatings. Houston, TX, USA: NACE International; 2017.
- Influence of soil moisture on the residual corrosion rates of buried carbon steel structures under cathodic protection. Electrochim. Acta. 2015;176:1410-1419.
- [Google Scholar]
- Effect of soil particle size on the corrosion behavior of natural gas pipeline. Eng. Fail. Analy.. 2015;58:19-30.
- [Google Scholar]
- Mechanism of microbiologically influenced corrosion of X52 pipeline steel in a wet soil containing sulfate-reduced bacteria. Electrochim. Acta. 2017;253:368-378.
- [Google Scholar]
- Effect of moisture contents of bentonitic clay on the corrosion behavior of steel pipelines. Appl. Clay Sci.. 2015;114:461-466.
- [Google Scholar]
- Corrosion behavior of API 5L X-60 pipeline steel exposed to near-neutral pH soil simulating solution. Mater. Corros.. 2006;57:771-777.
- [Google Scholar]
- Role of Fe oxides in corrosion of pipeline steel in a red clay soil. Corros. Sci.. 2014;80:309-317.
- [Google Scholar]
- Corrosion process of API X52 carbon steel immersed in an aqueous solution simulating a clay soil. Corros.. 2011;67 116001/1-10
- [Google Scholar]
- Numerical simulations of soil physicochemistry and aeration influences on the external corrosion and cathodic protection design of buried pipeline steels. Mater. Des.. 2016;97:287-299.
- [Google Scholar]
- Microbial corrosion of X52 pipeline steel under soil with varied thicknesses soaked with a simulated soil solution containing sulfate-reducing bacteria and the associated galvanic coupling effect. Electrochim. Acta. 2018;266:312-325.
- [Google Scholar]
- Localized corrosion of carbon steel in a CO2-saturated oilfield formation water. Electrochim. Acta. 2011;56:1676-1685.
- [Google Scholar]
- Corrosion inhibition of carbon steel in CO2-containing oilfield produced water in the presence of iron-oxidizing bacteria and inhibitors. Corros. Sci.. 2016;105:149-160.
- [Google Scholar]
- Frank Cheng, Mechanistic aspects of microbially influenced corrosion of X52 pipeline steel in a thin layer of soil solution containing sulphate-reducing bacteria under various gassing conditions. Corros. Sci.. 2018;133:178-189.
- [Google Scholar]
- Electrochemical behavior of API-X100 pipeline steel in NS4, near-neutral, and mildly alkaline pH simulated soil solutions. Corros. Sci.. 2014;82:45-57.
- [Google Scholar]
- Understand the AC induced pitting corrosion on pipelines in both high pH and neutral pH carbonate/bicarbonate solutions. Corros. Sci.. 2014;85:304-310.
- [Google Scholar]
- Relationship between dissolved oxygen and corrosion characterization of X80 steel in acidic soil simulated solution. Int. J. Electrochem. Sci.. 2015;10:4393-4404.
- [Google Scholar]
- ASTM G102, Standard Practice for Calculation of Corrosion Rates and Related Information from Electrochemical Measurements, ASTM, USA, 1989.
- Corrosion inhibition and anti-bacterial efficacy of benzalkonium chloride in artificial CO2-saturated oilfield produced water. Corros. Sci.. 2017;117:24-34.
- [Google Scholar]
- Corrosion of X65 steel in CO2-saturated oilfield formation water in the absence and presence of acetic acid. Corros. Sci.. 2009;51:1589-1595.
- [Google Scholar]
- Critical review: microbially influenced corrosion of buried carbon steel pipes. Int. Biodeterior. Biodegrad.. 2014;93:84-106.
- [Google Scholar]
- A review of the effects of tillage systems on some soil physical properties, water content, nitrate availability and crops yield in the Argentine Pampas. Soil Till. Res.. 2009;104:1-15.
- [Google Scholar]
- The science of pipe corrosion: A review of the literature on the corrosion of ferrous metals in soils. Corros. Sci.. 2012;56:5-16.
- [Google Scholar]
- Uncovering carbide on carbon steels by use of anodic galvanostatic polarization and its effect on CO2 corrosion. Corros.. 2015;72:534-546.
- [Google Scholar]
- Probability distribution of pitting corrosion depth and rate in underground pipelines: A Monte Carlo study. Corros. Sci.. 2009;51:1925-1934.
- [Google Scholar]
- Statistical analysis of pitting corrosion field data and their use for realistic reliability estimations in non-piggable pipeline systems. Corros.. 2014;70:1090-1100.
- [Google Scholar]


