

Translate this page into:
CPMAS 13C NMR characterization of humic acids from composted agricultural Saudi waste
⁎Tel.: +966 35899554. yalfayz@kfu.edu (Yasair S.S. Al-Faiyz) yalfayz@kfu.edu.sa (Yasair S.S. Al-Faiyz)
-
Received: ,
Accepted: ,
This article was originally published by Elsevier and was migrated to Scientific Scholar after the change of Publisher.
Peer review under responsibility of the King Saud University.

Abstract
CPMAS 13C NMR spectroscopy was used to characterize humic acid (HA) extracted from three types of composted agricultural Saudi waste of different origins, including agricultural crop plants (P), date palm fronds (D), and animal waste (A).
The intensity of each region was estimated by the CPMAS spectrum indicating that HA (P) has a lower carbohydrate content than the other two samples. There was a greater presence of aromatic carbon substituted by oxygen or nitrogen in HA (A) than in HA (D), while HA (P) contained the highest content of aliphatic compounds. All samples exhibited strong peaks for a carbonyl of the carboxyl group. However, there was no absorbance for the carbonyl carbon in any of them. The lowest carboxyl group content among the samples was in HA (D) while HA (P), and HA (A) had very similar carboxyl contents. For all samples, the total aliphaticity was higher than the total aromaticity, with HA (P) having the highest total aliphaticity, and HA (A) having the lowest total aliphaticity. The composition and functional groups of the investigated samples did not exactly match those of any previously reported HA models, however, some similarity was noted between the Dragunov's model and HAs extracted from plant PEMs.
Keywords
Compost
Humic acids
CPMAS-13C NMR

1 Introduction
Humic acids (HAs) are very common naturally-occurring molecules in terrestrial and aquatic ecosystems. These natural polymers are widely believed to be important precursors or components of most organic materials, such as kerogen (Xiao et al., 2004; Song et al., 2002), bitumen (Kotlyar et al., 1988), petroleum (Golovin et al., 2004; Majid and Ripmeester, 1990; Majid et al., 1993), lignite (Jiang et al., 2011a,b; Nasir et al., 2011; Gonzalez-Vila et al., 1992), peats (Kukharenko, 1980; Sivakova et al., 2011; Minderlein and Blodau, 2010), and coal (Kukharenko, 1980; Sivakova et al., 2011; Minderlein and Blodau, 2010). They are extracted from the soil (Pospíšilová and Fasurova, 2009; Palazzo et al., 2008; Kholodov et al., 2009), river (Botero et al., 2011; Peiris et al., 2011; Luo et al., 2011;Liu et al., 2010; Nagao et al., 2003) and lake sediments (He et al., 2008; Tsai et al., 2008; Greis et al., 2008), coal (Proidakov, 2009; Petersen and Nytoft, 2006), fresh water (Vlaicu et al., 2011; Huang and Zhou, 2010; Bartoszek et al., 2010), plants (Adani et al., 2007; Davies et al., 1997), and coral skeletons (Susic et al., 1991).
HAs have a significant role in the environment (Peña-Méndez et al., 2005; Lesage et al., 2001; Xing et al., 1994; Xing and Pignatello, 1997; Von Wandruszka, 2000; Van Stempvoort et al., 2005; Linnik and Vasilchuk, 2005) and agriculture (Shehata et al., 2011; Piccolo et al., 1992), by increasing soil fertility (Mugwe et al., 2009; Selim et al., 2009; Moreira, 2007; Fontana et al., 2006), transferring micronutrients to plants (García-Mina et al., 2004), accelerating the photodegradation of pesticides (Tajeddine et al., 2010; Kamiya and Kameyama, 2001; Kamiya et al., 2001; Jensen-Korte et al., 1987), stimulating the microflora population in soils (Chernikov, 1992; Ulasevich et al., 1977; De Barjac, 1952), and decreasing the toxicity of some toxic and heavy metals (Stathi and Deligiannakis, 2010; Capasso and De Martino, 2010; Wang et al., 2010; Haghighi et al., 2010; Ge et al., 2007).
HAs are thought to have formed via microbial and chemical transformation processes that include the decomposition of plant and animal residues under certain environmental abiotic factors (Wershaw et al., 1996; Aiken et al., 1985). Hence, various structural units of different sizes and lengths link together in a random manner to form these complex molecules (Aiken et al., 1985; Myneni et al., 1999). Therefore, their structure and physicochemical characteristics are affected by their origins, geographic location, and climate zones (Peña-Méndez et al., 2005; Stevenson, 1994; Sohn and Weese, 1986; Conrad and Seiler, 1985; Hatcher et al., 1981).
Although the first recorded studies of HA date back to 1761 (Wallerius, 1761), their chemical structure has never been completely elucidated and it is widely believed that no two HA structures are identical. Several different structural models of HA have been suggested. One of the first HAs, a structural model was presented by Fuchs. This model comprised a condensed ring system to which COOH and OH groups were attached. Alkyl chains, carbohydrates, proteins, and nitrogen atoms were not represented in this model (Swain, 1963; Jackson et al., 1978) (Fig. 1).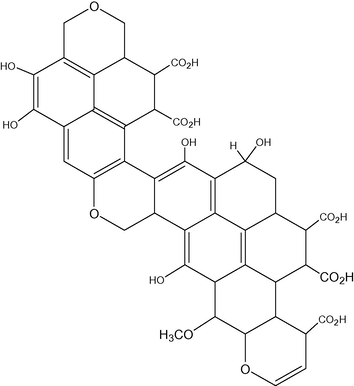
Fuchs structure of humic acid.
Another famous HA model was Dragunov’s structure. This HA structure contains aromatic rings of the di- and trihydroxybenzene types, part of which has the double linkage of a quinone group. The aromatic rings in this model are bridged by –O–, –(CH2)n–, –NH–, and –N– (Fig. 2), and the model shows a nitrogen atom as part of the ring or peripheral chains and proteins and carbohydrates, but no carboxyl groups, linked to the aromatic ring (Jackson et al., 1978; Manskaya and Drozdova, 1968; Kononova, 1966) .
Dragunov’s structure of humic acid.
Another well-known model of HA is the Flaig’s model, which is based on lignin monomer units. It is highly aromatic due to the substituted benzene ring content. This model comprises many linked aromatic, phenolic, or quinonic rings, but contains only a few COOH and aliphatic groups. This model contains carbohydrate residues and nitrogen atoms as part of its structure, but no protein residues. Flaig’s model has been revised, however, to include a protein or peptide unit (Flaig, 1960) (Fig. 3). Both Dragunov’s and Flaig’s models contain an insufficient number of carboxyl groups relative to the number of phenolic groups (Manskaya and Drozdova, 1968; Kononova, 1966; Flaig, 1960).
Flaig’s model of humic acid.
Another highly documented model is the Steelink’s model. In this model, HA contains aromatic rings, phenols, and quinones linked by aliphatic units with many OH groups. The carboxyl groups in this model are only linked to the aliphatic part (Aiken et al., 1985; Mao et al., 2000; Steelink, 1985) (Fig. 4).
Steelink's structure of humic acid.
Jansen modified this model to contain seven chiral centers and, instead of quinones, ketones or aldehydes (Jackson et al., 1978; Mao et al., 2000; Steelink, 1985; Jansen et al., 1996).
One of the most common models of HA is the Stevenson’s model. This model has a high aromatic content. It has a number of phenolic groups, both free and linked as bridge units, and also contains carboxyl groups, which are mostly attached to aromatic rings. This model contains oxidized lignin, a phenol–amino acid complex, a hydroxyl-quinone, and a C6–C3 structural unit of lignin. Similar to Dragunov’s structure, carbohydrate and protein are also part of Stevenson's model structure (Stevenson, 1994; Swain, 1963; Mao et al., 2000) (Fig. 5).
Stevenson’s model of humic acid.
In Schulten and Schnitzer’s model, the structure of HA is formed by aromatic rings linked by long-chain alkyl structures and there are many hydroxyl and carboxyl groups on both the aromatic rings and aliphatic side chains (Stevenson, 1994; Mao et al., 2000; Schulten and Schnitzer, 1993; Schulten and Leinweber, 2000) (Fig. 6).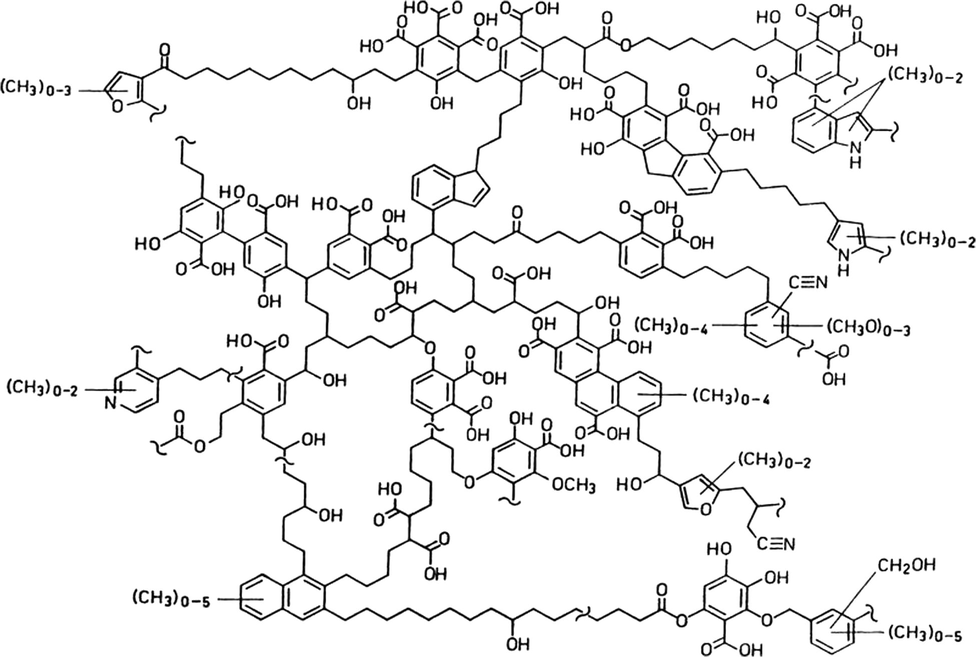
Schulten and Schnitzer’s model of humic acid.
HA-like materials are also found in plants and algae with little or even no lignin content at all (Kolla et al., 1998). These HA aponomers have fused rings. The structure of plant-derived HA is very similar to those of the (Fig. 7) models. This model has very high nitrogen content due to the existence of purine, imino, and amino groups. Also, it has high oxygen content due to the existence of carboxyl and phenol groups. This model also contains a paraffinic part (Mao et al., 2000; Kolla et al., 1998) (Fig. 7).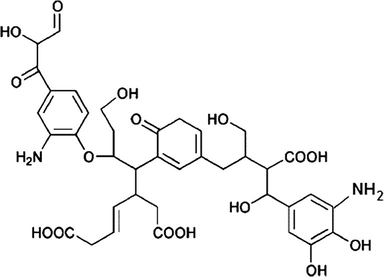
HA-like materials are also found in plants and algae.
HAs are also a major product of recycling of agricultural waste. Recycling waste by composting is a common practice all over the world (Li et al., 2011; Sanmanee et al., 2010; Brighenti et al., 2010; Amir et al., 2010; Montoneri et al., 2008; Chang Chien et al., 2007; Huang et al., 2009; Flis-Bujak and Zukowska, 2002). In this paper, I report the extraction of HAs from composted agricultural Saudi waste and their characterization by cross polarization magic angle spinning nuclear magnetic resonance (CPMAS NMR).
There is currently no statistically accurate information regarding the agricultural waste in Saudi Arabia. Saudi Arabia is considered to be a major producer of dates with nearly 22.6 million date palm trees, a number that gradually increases every year (Yacob et al., 2010; Mohammad et al., 2008). These trees produce large quantities of waste that are usually burned in the fields, causing serious harm to the environment (Yacob et al., 2010; Mohammad et al., 2008). Agricultural waste burning is very common in the Al-Hassa region. In fact, this is the main agricultural region in Saudi Arabia and the biggest oasis in the Arabian Peninsula. Therefore, an investigation of the recycling of agricultural waste in this region and the possible extraction of some useful compounds, such as HA is of great interest both economically and scientifically.
2 Experimental
2.1 Sample collection
Three types of organic waste of different origins and nature, including agricultural crop plants (P), date palm fronds (D), and animal waste (A), were collected, sampled, and composted on site from different farms in the Al-Hassa region. The plant parts and date palm fronds were cut and chopped using a cutting machine at a rate of 3 tons per hour. Animal manure was collected from the Training and Research Station of the Agricultural and Veterinary of the King Faisal University. Each of these three types of waste was placed into plastic bags and transported to the composting site.
The composting process was conducted on 10-kg amounts of each material after mixing with ammonium nitrate (34%) as a source of nitrogen. The mixtures were composted separately for 90 days in wooden boxes with holes for ventilation. Ground and dried organic waste (0.25 m) was added to a layer of sand approximately 5 cm high at the bottom of each box. The mixtures were composted for 3 months and moisturized with water whenever necessary to keep the humidity level at approximately 25–60%.
2.2 Extraction of HA
At the end of the composting period, HA was extracted according to the methods of the International Humic Substance Society, as described by Schnitzer and Skinner (1968) with some modification. One volume of the composting mixture was mixed with 10 volumes of 0.5 mol/L NaOH under nitrogen. The mixture was stirred for 12 h at room temperature, filtered through a fabric cloth, and washed with distilled water. The resulting filtrate was collected, acidified by an excess of acid chloride, centrifuged at 5000 rpm for 15 min, and dried at 40°C in an electric oven. The product was then mixed with 10 volumes of a diluted mixture of HF–HCl (1:1) for 24 h at room temperature.
The mixture was then filtered and repeatedly washed with a diluted mixture of HF–HCl (1:1). After centrifugation at 5000 rpm for 15 min, the sample was repeatedly washed with water and dried under vacuum.
2.3 Solid NMR spectroscopy
Solid-state CPMAS 13C NMR spectroscopy was recorded at room temperature on a Bruker Avance 400 MHz NMR.
3 Results and discussion
3.1 Sample characterization
CPMAS NMR is a powerful technique for elucidating the structure of HA (Preston, 1996; Wilson, 1987; Bronnimann et al., 1992; Chefetz et al., 1998; Hatcher et al., 1983; Poutanen and Morris, 1985; Mao et al., 1998; Robert et al., 1998; Gamble et al., 1996; Leyden and Cox, 1977; Wooten, 1995; Schnitzer et al., 1991). CPMAS 13C NMR provides carbon fingerprints of solid samples. There are several advantages of this technique over other spectroscopy techniques. For example, it is not necessary to dissolve the samples, it is less time-consuming than liquid-state 13C NMR, and it provides direct information on the carbon skeleton. Additionally, the large chemical shifts associated with this technique allow for the resolution of signals of carbon atoms with a slightly different structure (Schnitzer and Skinner, 1968; Preston, 1996; Wilson, 1987).
Also, the CPMAS NMR technique allows for quantitative evaluation. Hence, measurement of peak areas in the spectra and their comparison provide valuable information about the structure of the HA and its origin (Preston, 1996; Bronnimann et al., 1992).
The 13C NMR spectra indicated the presence of many types of carbons, including aliphatic, carbohydrate, aromatic, and carboxyl carbons, with a wide variation in the relative abundance of aliphatic vs. aromatic carbons in HA. The relative concentration of various groups was calculated by integrating the areas of corresponding peaks in the solid NMR spectrum. Hence, for data analysis, the CPMAS 13C NMR spectra of these HA were divided into five regions according to their organic functional groups. These regions were the aliphatic region (0–50 ppm), the carbohydrate region (51–110 ppm), the aromatic region (111–160 ppm), the carboxyl region (161–190 ppm), and the carboxyl group (191–200 ppm) (Chefetz et al., 1998; Hatcher et al., 1983) (Fig. 8, Table 1).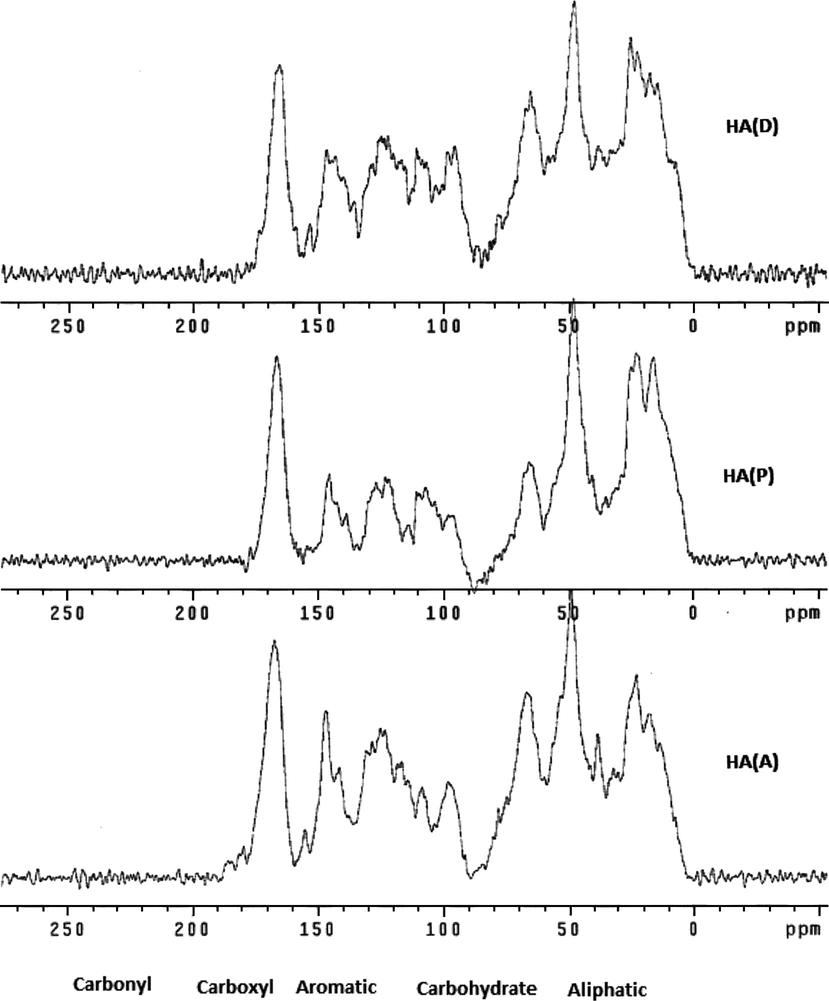
Differences in spectral intensity in the entire chemical shift regions.
Samples (HA)
Carbonyl shift range (191–220 ppm)
Carboxyl shift range (161–190 ppm)
Aromatic shift range (111–160 ppm)
Carbohydrate shift range (51–110 ppm)
Aliphatic shift range (0–50 ppm)
HA (A)
–
167.30
155.05, 146.63, 125.20, 117.0
108.50, 98.30, 66.70
49.00, 38.50, 23.00
HA (P)
–
166.60
145.50, 123.23
107.20, 66.00,
48.32, 23.20, 16.10
HA (D)
–
166.00
147.00, 125.20, 111.1
96.00, 66.00
48.32, 25.70
Generally, the CPMAS 13C NMR spectra of all three samples exhibited common major peaks at the same positions: at 48.00 ppm (alkyl C), 66.00 ppm (alkyl O-carbon), 146.00 ppm (aromatic carbon), and 166 ppm (carbonyl carbon) (Fig. 8). On the other hand, there were also some common peaks between the three samples in slightly varied positions (Fig. 8). Hence, all three samples exhibited a strong peak near 24 ppm due to a methyl carbon (CH3) and methylene carbon (CH2)n (Mao et al., 2000: Chefetz et al., 1998; Hatcher et al., 1983; Poutanen and Morris, 1985; Mao et al., 1998; Robert et al., 1998). Also, all samples exhibited a peak near 15 ppm due to an aliphatic (CH and CH2) peak (Fig. 8). The strongest of these peaks appeared near 16 ppm in the HA (P) sample (Fig. 9). Bands in the aliphatic region near 17 ppm correspond to terminal methyl groups.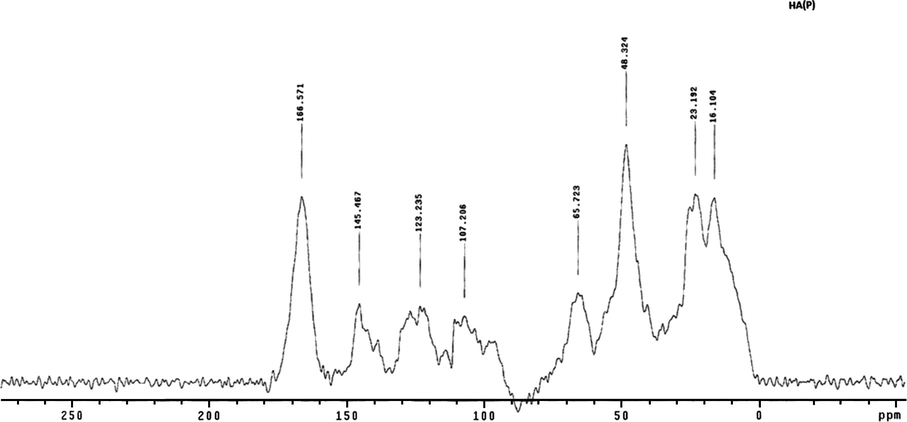
CPMAS 13C NMR spectra of humic acid extracted from composted agricultural crop plants HA (P).
The aliphatic region (0–50 ppm) was intense in all three spectra (Figs. 9–11). This region corresponds mainly to aliphatic carbons or carbons bound to carbon only. The spectra for all three samples exhibited absorbance centered near 38 ppm, with HA (A) having the strongest peak near 38.50 ppm for the alkyl carbon (Fig. 11). The peaks near this area (39–40 ppm) correspond to methylene groups near points of carbon branching (Mao et al., 2000; Chefetz et al., 1998; Hatcher et al., 1983; Poutanen and Morris, 1985).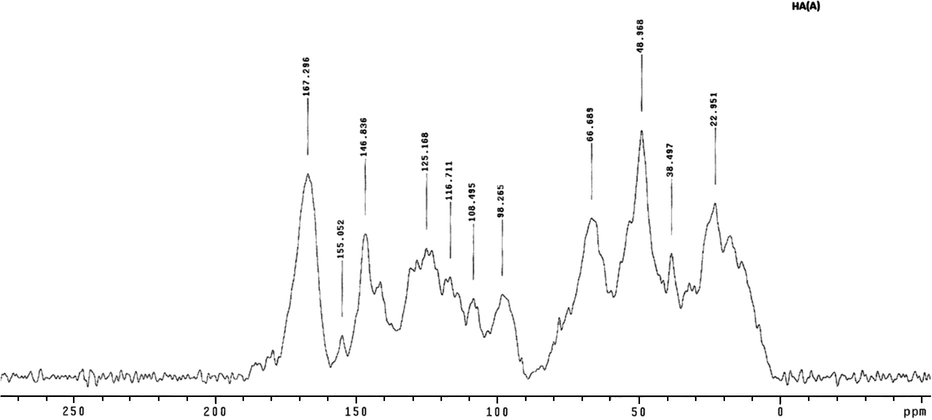
CPMAS 13C NMR spectra of humic acid extracted from composted animal waste HA (A).
The region between 50 and 112 ppm is called the carbohydrate region or aliphatic alcohol and ether region. In this region, resonances between 60 and 110 ppm are characteristic of carbon atoms singly bonded to oxygen or nitrogen in alcoholic, etheric, or amine carbons (Poutanen and Morris, 1985). All the samples showed a chemical shift between 60 and 90 ppm, mainly due to carbohydrates (Figs. 9–11).
The spectra of all three samples (Figs. 9–11) exhibited a strong peak centered near 65 ppm that corresponded to bands for C6 atoms, which are generally between 63 and 65 ppm for all carbohydrates (Gamble et al., 1996).
Both HA (D) (Fig. 10) and HA (A) (Fig. 11) exhibited peaks for O-alkyl at 96.0 ppm and 98.30 ppm, respectively. The strongest peak was for HA (D), and the weakest was for HA (P) (Figs. 9 and 10). This chemical shift corresponds to the anomeric carbon atoms of carbohydrates, which usually have a band between 90 and 105 ppm (Robert et al., 1998) and could also be due to aliphatic carbon atoms attached to protonated carbon atoms of phenols (Gamble et al., 1996). The relatively weak bands between 60 and 96 ppm in HA (P) indicated that this sample had lower carbohydrate content (Fig. 9).
CPMAS 13C NMR spectra of humic acid extracted from composted date palm fronds HA (D).
HA (A) and HA (P) exhibited a peak at 108 ppm, while HA (D) exhibited a peak near 111 ppm (Figs. 9–11). The bands between 112–163 ppm are aromatic and phenolic carbons and the peaks in this region mainly correspond to aromatic and olefinic carbons (Wooten, 1995). The intensity of the peaks varied, but generally weaker peaks were centered near 130 ppm in the spectra of all three samples, indicating ring carbons in which the ring contains a strong electron donor such as oxygen or nitrogen (Figs. 9–11).
In addition, HA (A) exhibited peaks near 117 ppm and 125 ppm, indicating that an alkyl aromatic carbon was substituted by a nitrogen or oxygen (Fig. 11). Similarly, HA (D) exhibited peaks near 125 ppm and 111 ppm (Fig. 10). On the other hand, HA (P) exhibited relatively weak peaks near 117 ppm and 123.23 ppm (Fig. 9). This region indicates a substituted aromatic carbon ortho to oxygen. Hence, HA (P) was less aromatic than the other samples.
In the aromatic region, HA (A) and HA (D) also exhibited peaks at 147 ppm and 155 ppm (Figs. 10 and 11). In HA (D), however, the peak at 155 ppm was weak, while HA (P) exhibited no peaks in this position (Figs. 9 and 10). The chemical shift corresponds to aromatic carbons substituted by functional groups containing oxygen and nitrogen, such as –OCH, –OH, –OR, or –NH2. (Poutanen and Morris, 1985). Thus, these findings clearly indicate that aromatic carbons, substituted by oxygen or nitrogen, such as aromatic ethers, phenols, and aromatic amines, are more common in HA (A) than HA (D), and this sort of carbon is not contained in HA (P) (Figs. 9–11).
The carbonyl region is between 160 and 220 ppm, and there is a considerable overlap of the chemical shifts in this region due to the huge number of chemical components that contain a carbonyl group (Robert et al., 1998). In fact, all three spectra showed chemical shifts of the bands between 160 and 190 ppm (Figs. 9–11). The spectra for HA (D), HA (P), and HA (A) exhibited strong peaks at 165.70, 166.60, and 167.30 ppm, respectively (Figs. 9–11). The peaks in this region correspond to carbonyls of carboxylic acids or carboxylate salts esters or peptides (Robert et al., 1998), but the region between 163 and 170 ppm most likely corresponds to ester linkages (Wooten, 1995), and is expected to indicate an aromatic ester because aliphatic esters usually have a band at 171 ppm (Schnitzer et al., 1991), which was not observed for any of the samples investigated (Figs. 9–11).
On the other hand, no peaks were observed in the region between 190 and 220 ppm for any of the three samples, further confirming the absence of carbonyl groups in this region (Figs. 9–11). This region is the chemical shift of carbonyl carbon of aldehydes, ketones, and quinines (Robert et al., 1998).
The intensity for each region estimated via the CPMAS spectrum indicated that HA (P) contained the highest amount of aliphatic compounds (41.63%), while HA (D) and HA (A) exhibited an aliphatic compound content of 36.39% and 31.39%, respectively. HA (P) contained the lowest amount of carbohydrate compounds (24.89%) among the samples, while HA (D) and HA (A) contained a similar amount of carbohydrate compounds (29.05% and 29.0%, respectively) (Fig. 12).
A comparison of functional groups intensity of investigated Humic acids.
In the aromatic region, HA (D), and HA (A) exhibited an aromatic compound content of 23.85% and 25.45%, respectively, while HA (P) exhibited the lowest aromatic compound content (19.31%) (Fig. 12). Finally, HA (D) had the lowest carboxyl group content among the samples (10.70%), while HA (P) and HA (A) had very similar carboxyl contents (14.16% and 14.33%, respectively) (Fig. 12).
Total aromaticity was calculated by expressing aromatic carbon (112–163 ppm) as a percentage of aliphatic carbon (0–112 ppm) plus aromatic carbon. Therefore, the total intensity of aromaticity and aliphaticity of each sample was calculated using the following equations:
The results calculated from the above equations indicated that HA (P) had the lowest total aromaticity among these samples (32.72%), while HA (D) had the highest total aromaticity among these samples (44.57%), and HA (P) had a total aromaticity of 39.59%. Generally, for all samples, the total aliphaticity was higher than the total aromaticity, and HA (P) had the highest aliphaticity (68.30%), HA (A) had the lowest total aliphaticity (55.42%), and HA (D) had 60.40% total aliphaticity (Fig. 13).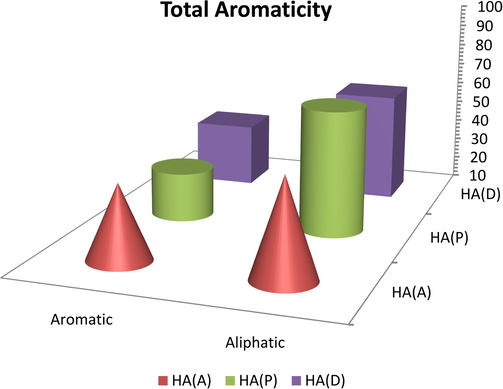
Comparison between major bands of 13C NMR of humic acids.
3.2 Comparisons with humic acid model structures
Various models of HA structures have been proposed over the years. None of these models, however, completely matches the composition of the three HAs investigated here.
To compare these HA structure models with the HAs studied here, NMR quantification was performed by calculating the chemical shifts and the spectra of these samples were divided into nine spectral ranges (Fig. 14).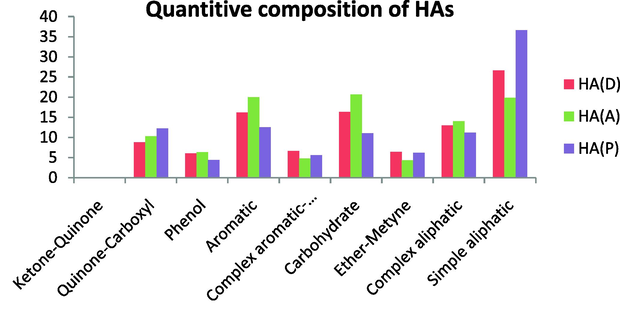
Quantitive composition of HAs.
The HAs studied here showed the lowest similarity with the Jansen’s model, which is a modification of the Steelink’s model. The Jansen’s model has a higher complex aliphatic content and a higher aromatic content and phenolic content than our samples. Further, the Jansen’s model has ketone–quinone carbonyl groups whereas the HAs studied here contained no ketone–quinone groups. In addition, this model has no simple aliphatic content (no signals below 35 ppm) and no anomeric carbon content. On the other hand, the quinine-carboxyl content was quite similar between the HAs studied here and the Jansen’s model (Fig. 15).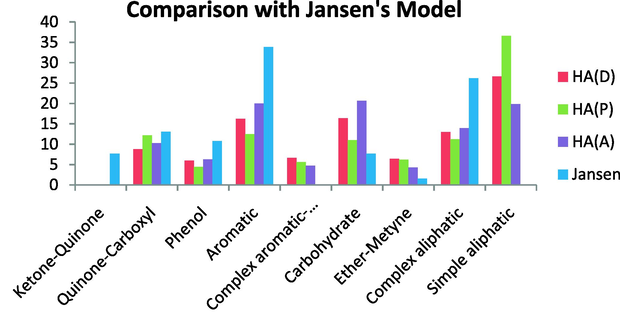
Comparison with Jansen’s model.
Generally, the Steelink’s model has a higher aromatic content than the HA studied here and a lower simple aliphatic content, whereas the carbohydrate content was very similar, especially with HA (A). The quinine-carboxyl content was also quite similar. On the other hand, the Steelink’s model contains fewer simple aliphatics and no ether-methine (OCH3) near 50 ppm or CH groups near 60 ppm, and also contains no complex aromatics or anomeric carbons; unlike the HAs we investigated (Fig. 16).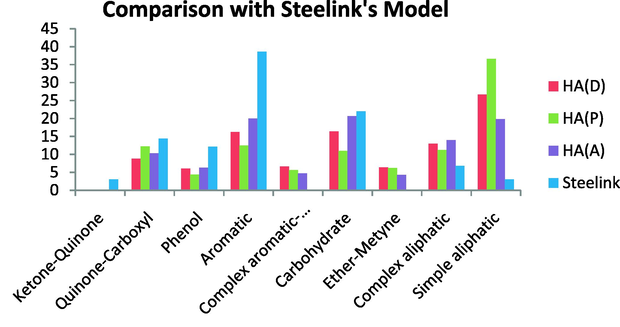
Comparison with Steelink’s model.
Comparison with the Stevenson’s model revealed a higher aromatic content than in the HAs studied here. The Stevenson’s model also contains more phenolics and more complex aromatics than the HAs we investigated. The quinine-carboxyl content is higher in the Stevenson’s model than in the HAs studied here and a lower ketone–quinone content, whereas our HAs contained no ketone–quinone. On the other hand, this model was less aliphatic than the HAs under investigation. This model has a lower content of simple aliphatics, complex aliphatics, ether-methine, and carbohydrates (Fig. 17).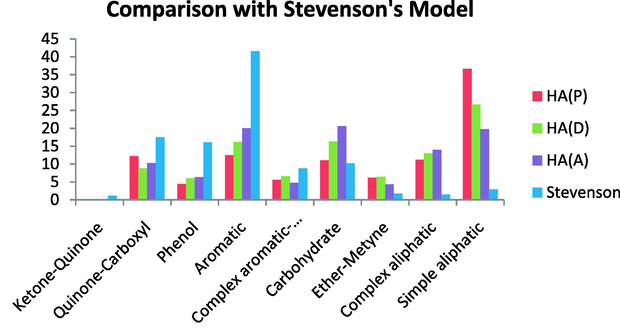
Comparison with Stevenson’s model.
Comparison with the Fuchs’s model demonstrated that this model is more aromatic and also more phenolic than the HAs we investigated. The ether-methine, complex aromatic, and quinine-carboxyl content, however, are very similar to the investigated HA. This model has low ketone–quinone content, but the HAs under investigation contained no ketone–quinone and lower carbohydrate content. On the other hand, this model contains no simple aliphatics, but has more complex aliphatics than the HAs investigated here (Fig. 18).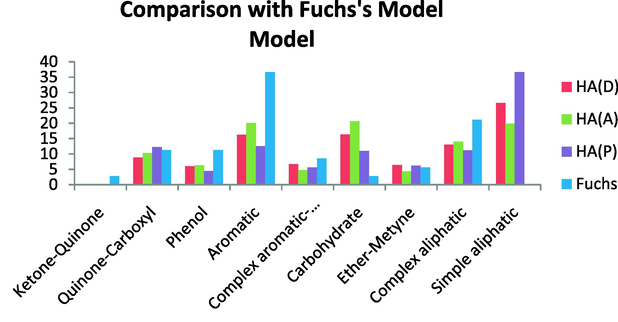
Comparison with Fuchs’s model.
Comparison with the Flaig’s model indicated that this model is more aromatic and also more phenolic, and less aliphatic than the investigated HA, and contained complex aromatics (anomeric carbon). This model has few simple aliphatics compared with the HAs under investigation. This model also has very low ether-methine content and very similar quinine-carboxyl content as the investigated HAs. Also this model has very small ketone–quinone content while the HAs studied here had no ketone–quinone. Also, this model has lower carbohydrate content (Fig. 19).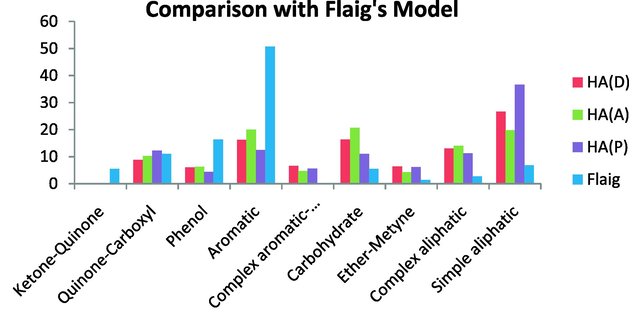
Comparison with Flaig’s model.
Comparison with the Dragunov’s model revealed that the composition of the Dragunov’s model matched that of the HAs under investigation. This model, however, contains a higher aromatic, carbohydrate content, and quinine-carboxyl content than the HA studied here. Similar to the HAs under investigation, this model has no ketone–quinone content. On the other hand, this model is less aliphatic than the HA in the present study. This model also has a lower content of both simple and complex aliphatics. In general, this model shows a similar ether-methine, complex aromatic, and phenol content as the HAs under investigation (Fig. 20).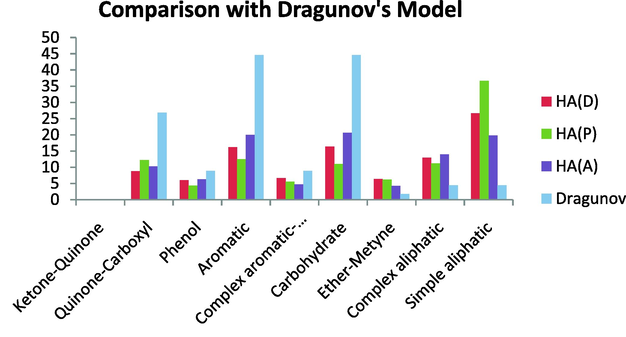
Comparison with the Dragunov’s model.
Comparison with the Schulten & Schnitzer’s model revealed that this model is more aromatic than the HAs studied here and this model contains no ether-methine. The content of the other groups of this model showed high similarity with the HAs investigated here. In fact, this sample showed a very similar content of simple aliphatic, especially with HA (D) and a similar content of complex aliphatics with all HA samples investigated. The quinine-carboxyl and phenolic contents were similar to those of all HA samples studied here. On the other hand, this model had a lower content of carbohydrates and a lower content of anomeric carbon compared with the HAs studied here (Fig. 21).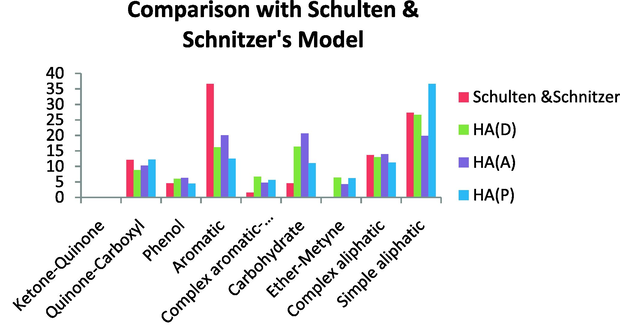
Comparison with the Schulten & Schnitzer’s model.
A comparison of samples investigated with HAs extracted from hyacinth plant materials (PEMs) (Mao et al., 2000) revealed some similarity in the composition and functional groups (Figs. 22 and 23).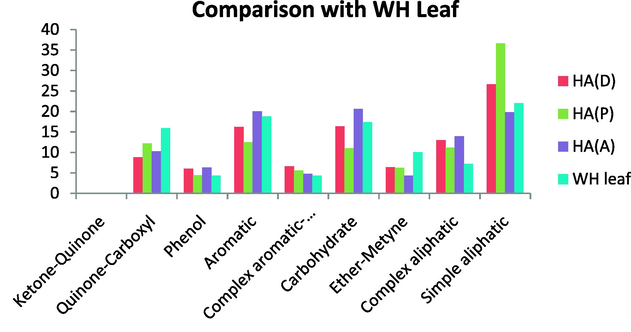
Comparison with WH Leaf.
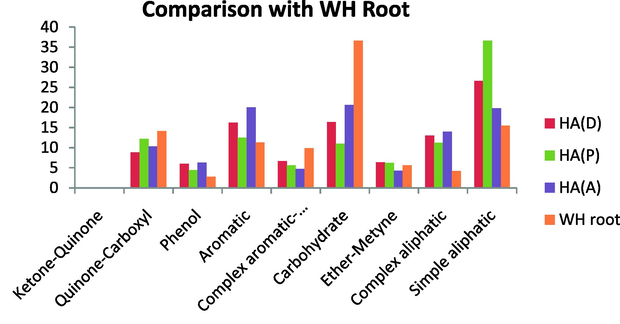
Comparison with WH Root.
The sp2/sp3 carbon ratio was calculated as follows:
(Mao et al., 2000). The ratio of the samples investigated was generally smaller than 1. The highest value was for HA (A) (0.60), the lowest was for HA (P) (0.41), and for HA (D) the value was 0.45. The previously published sp2/sp3 carbon ratio in HA models ranged from 1.1 to 6.8 ((Mao et al., 2000). Hence, the sp2/sp3 carbon ratio in the HAs investigated here did not match with any previously reported results. The carbon ratio in the present study, however, was very close to the sp2/sp3 carbon ratio of PEMs (Mao et al., 2000).
4 Conclusion
CPMAS 13C NMR spectroscopy was used to characterize three types of HAs extracted from composted agricultural Saudi waste. The three samples were slightly different with some common peaks. In the aliphatic region, all three samples exhibited a strong peak representing a methyl group or methylene group. All the samples also showed a peak for aliphatic (CH and CH2) and alkyl carbons. In the carbohydrate region, samples HA (A) and HA (P) exhibited a peak for an aromatic carbon near 108 ppm, whereas sample HA (D) exhibited a peak for aromatic carbon near 111 ppm; both HA (D), and HA (A) exhibited peaks for O-alkyl at 96.0 ppm and 98.30 ppm, respectively, whereas HA (P) exhibited a relatively weak peak near this region, indicating that HA (P) has a lower carbohydrate content than the other two samples. In the aromatic region, alkyl aromatic carbon substituted by nitrogen or oxygen was present in HA (A) and HA (D), but HA (P) had less alkyl aromatic carbon. In addition, there was a greater presence of aromatic carbon substituted by oxygen or nitrogen as an aromatic ether, phenol, or amine in HA (A) than in HA (D), while this carbon content for HA (P) was not determined. HA (D), HA (P), and HA (A) exhibited strong peaks for a carbonyl of the carboxyl group at 165.70, 166.60, and 167.30 ppm, respectively. Surprisingly, there was no absorbance spectrum for the carbonyl carbon in any of the samples. The intensity of each region estimated by the CPMAS spectrum indicated that HA (P) contained the highest content of aliphatic compounds (41.63%), and HA (D) and HA (A) had aliphatic compound contents of 36.39% and 31.39%, respectively. HA (P) exhibited the lowest total amount of carbohydrate compounds (24.89%) among the samples, but HA (D) and HA (A) exhibited very similar amounts of carbohydrate compounds (29.05% and 29.0%, respectively). In the aromatic region, HA (D) and HA (A) exhibited total aromatic compound contents of 23.85% and 25.45%, respectively, and HA (P) exhibited the lowest with 19.31%. Finally, the lowest carboxyl group content among the samples was in HA (D) (10.70%), while HA (P), and HA (A) had very similar carboxyl contents (14.16% and 14.33%, respectively). HA (P) had the lowest total aromaticity among these samples 32.72%, HA (D) had the highest total aromaticity (44.57%), and HA (P) had a total aromaticity of 39.59%. Generally, for all samples, the total aliphaticity was higher than the total aromaticity, with HA (P) having the highest total aliphaticity (68.30%), and HA (A) having the lowest total aliphaticity (55.42%), with HA (D) having 60.40% total aliphaticity. The sp2/sp3 carbon ratio values for HA (A), HA (D), and HA (P) were 0.60, 0.45, and 0.41, respectively. Although the composition and functional groups of the HA samples under investigation did not exactly match those of any previously reported HA models, some similarity was noted, especially between the Dragunov’s model and HAs extracted from plant PEMs.
Acknowledgements
I am grateful to the Department of Chemistry, King Faisal University for their help with these studies. Also, I would like to thank Dr. M.R.P. Reddy for running the CPMAS NMR.
References
- Biochemical origin and refractory properties of humic acid extracted from maize plants: the contribution of lignin. Int. J. Biogeochem.. 2007;82:55-65.
- [Google Scholar]
- An introduction to humic substance in soil, sediment, and water. In: Aiken G.R., McKnight D.M., Wershaw R.L., MacCarthy P., eds. Humic Substances in Soil, Sediment and Water: Geochemistry, Isolation, and Characterization. New York: Wiley-Interscience Publication; 1985. p. :1-9.
- [Google Scholar]
- Structural study of humic acids during composting of activated sludge-green waste: elemental analysis, FTIR and 13C NMR. J. Hazard. Mater.. 2010;177:524-529.
- [Google Scholar]
- Spectroscopic study of humic substances isolated from sediment and water. Fresenius Environ. Bull.. 2010;19:1260-1264.
- [Google Scholar]
- Characterization of the interactions between endocrine disruptors and aquatic humic substances from tropical rivers. J. Braz. Chem. Soc.. 2011;22:1103-1110.
- [Google Scholar]
- Physical-chemical characteristics of humic acids in different stages of vermicomposting. Ecletica Quimica. 2010;35:69-82.
- [Google Scholar]
- 2D 1H–13C heteronuclear correlation spectra of representative organic solids. J. Mag. Res.. 1992;97:522-534.
- [Google Scholar]
- Polymerin and lignimerin, as humic acid-like sorbents from vegetable waste, for the potential remediation of waters contaminated with heavy metals, herbicides, or polycyclic aromatic hydrocarbons. J. Agric. Food Chem.. 2010;58:10283-10299.
- [Google Scholar]
- Characterisation and properties of humic substances originating form an activated sludge waste water treatment plant. In: Davies G., Ghabbour E.A., eds. Humic Substances: Structures, Properties, and Uses. Cambridge: Royal Society of Chemistry; 1998. p. :69-78.
- [Google Scholar]
- Characterization of humic substances derived from swine manure-based compost and correlation of their characteristics with reactivities with heavy metals. J. Agric. Food Chem.. 2007;55:4820-4827.
- [Google Scholar]
- Transformation of humic acids by autochthonous microflora. Eurasian Soil Sci.. 1992;24:75-83.
- [Google Scholar]
- Characteristics of a biological carbon monoxide formation from soil organic matter, humic acids, and phenolic compounds. Environ. Sci. Tech.. 1985;19:1165-1169.
- [Google Scholar]
- Isolation of humic acid from the terrestrial plant Brugmansia sanguinea. Sci. Total Environ.. 1997;201:79-87.
- [Google Scholar]
- Humic acids in the preparation of media for the ecological study of the microflora of acid soils. Ann. Inst. Pasteur.. 1952;83:279-281.
- [Google Scholar]
- The characteristics of the properties of humic acids extracted from sewage sludge. Pol. J. Soil Sci.. 2002;35:87-95.
- [Google Scholar]
- Fertility properties and humic fractions in a rhodic ferralsol in Brazilian cerrado. Pesquisa Agropecuaria Brasileira. 2006;41:847-853.
- [Google Scholar]
- Biological degradation of tannins in Sericea lespedeza (Lespedeza cuneata) by the white rot fungi Ceriporiopsis subvermispora and Cyathus stercoreus analyzed by solid-state 13C nuclear magnetic resonance spectroscopy. Appl. Environ. Microbiol.. 1996;62:3600-3604.
- [Google Scholar]
- Metal-humic complexes and plant micronutrient uptake: a study based on different plant species cultivated in diverse soil types. Plant Soil. 2004;258:57-68.
- [Google Scholar]
- Removal of bromide by aluminium chloride coagulant in the presence of humic acid. J. Hazard. Mater.. 2007;147:457-462.
- [Google Scholar]
- Structural characteristics and geochemical significance of humic acids isolated from three Spanish lignite deposits. Sci. Total Environ.. 1992;117–118:335-343.
- [Google Scholar]
- Plutonium remobilization in a humic-rich lake. J. Radioanal. Nucl.. 2008;277:265-268.
- [Google Scholar]
- Humic acid decreased hazardous of cadmium toxicity on lettuce (Lactuca sativa L.) Vegetable Crops Res. Bull.. 2010;72:49-61.
- [Google Scholar]
- Solid state 13C NMR of sedimentary humic substances: new revelations on their chemical composition. In: Christman R.F., Gjessing E.T., eds. Aquatic and Terrestrial Humic Materials. Michigan: Ann Arbor Science; 1983. p. :37-82.
- [Google Scholar]
- Aliphatic structure of humic acids: a clue to their origin. Org. Geochem.. 1981;3:43-48.
- [Google Scholar]
- Characterization of humic acids extracted from the sediments of the various rivers and lakes in China. J. Environ. Sci.. 2008;20:1294-1299.
- [Google Scholar]
- Adsorption behaviors of humic acid absorbing by activated carbon from natural water. In: Zhu Z., ed. International Conference on Environmental Science and Information Application Technology (ESIAT). Changsha: Central South Univ.; 2010. p. :525-528.
- [Google Scholar]
- Fluorescence spectroscopy characteristics of humic acid by inoculating white-rot fungus during different phases of agricultural waste composting. J. Cent. S. Univ. Technol.. 2009;16:440-443. (English edition)
- [Google Scholar]
- The nature of metals-sediment-water interactions in freshwater bodies, with emphasis on the role of organic matter. Earth Sci. Rev.. 1978;14:97-146.
- [Google Scholar]
- Improving extraction yield of humic substances from lignite with anthraquinone in alkaline solution. J. Cent. S. Univ. Technol.. 2011;18:68-72. (English edition)
- [Google Scholar]
- Photodegradation of pesticides in the presence of humic substances. Sci. Total Environ.. 1987;62:335-340.
- [Google Scholar]
- Experimental study on extracting humic acid from lignite. Adv. Mater. Res.. 2011;158:56-63.
- [Google Scholar]
- Effects of selected metal ions on photodegradation of organophosphorus pesticides sensitized by humic acids. Chemosphere. 2001;45:231-235.
- [Google Scholar]
- Effects of cyclodextrins on photodegradation of organophosphorus pesticides in humic water. Chemosphere. 2001;42:251-255.
- [Google Scholar]
- Structure of humic acids isolated by sequential alkaline extraction from a typical chernozem. Eurasian Soil Sci.. 2009;42:1095-1100.
- [Google Scholar]
- Humic acid as a substrate for alkylation. In: Geofferey D., Ghabbour A.E., Khaled K.A., eds. Humic Substances: Structures, Properties, and Uses. Cambridge: Royal Society of Chemistry; 1998. p. :215-225.
- [Google Scholar]
- Soil organic matter (first ed.). New York: Pergamon Elmsford; 1966.
- Characterization of oil sands solids closely associated with Athabasca bitumen. Fuel. 1988;67:808-814.
- [Google Scholar]
- Methods of isolating humic acids from peats and coal. Solid Fuel Chem.. 1980;14:75-81.
- [Google Scholar]
- Humic acids enhanced removal of aromatic hydrocarbons from contaminated aquifers: developing a sustainable technology. J. Environ. Sci. Health, Part A: Toxic/Hazard. Subst. Environ. Eng.. 2001;36:1515-1533.
- [Google Scholar]
- Analytical applications of NMR (first ed.). New York: Wiley; 1977.
- Compositional and functional features of humic acid-like fractions from vermicomposting of sewage sludge and cow dung. J. Hazard. Mater.. 2011;185:740-748.
- [Google Scholar]
- Role of humic substances in the complexation and detoxification of heavy metals: case study of the Dnieper Reservoirs. In: Perminova I.V., Hatfield K., Hertkorn N., eds. The Use of Humic Substances to Remediate Polluted Environments: From Theory to Practice. The Netherlands: Springer; 2005. p. :135-154.
- [Google Scholar]
- Comparative characterization of two natural humic acids in the Pearl river basin, China and their environmental implications. J. Environ. Sci.. 2010;22:1695-1702.
- [Google Scholar]
- Studies on characterization of humic acids extracted from sediments in Chongqing section of the Jialingjiang river. Spectrosc. Spectral Anal.. 2011;31:1663-1667.
- [Google Scholar]
- Isolation and characterization of humic acids from Alberta oil sands and related materials. Fuel. 1990;69:1527-1536.
- [Google Scholar]
- Characterization of solvent-insoluble organic matter associated with mineral matter from oil sands. Fuel Sci. Technol. Int.. 1993;11:279-292.
- [Google Scholar]
- Geochemistry Organic Substances (first ed.). Oxford: Pergamon Press; 1968.
- Quantitative characterization of humic substances by solid-state carbon-13 nuclear magnetic resonance. Soil Sci. Soc. Am. J.. 2000;64:873-884.
- [Google Scholar]
- Structural and elemental composition of humic acids comparison solid stated 13C NMR calculations and chemical analysis. In: Davies G., Ghabbour E.A., eds. Humic Substances: Structures, Properties, and Uses. Cambridge: Royal Society of Chemistry; 1998. p. :78-80.
- [Google Scholar]
- Humic-rich peat extracts inhibit sulfate reduction, methanogenesis, and anaerobic respiration but not acetogenesis in peat soils of a temperate bog. Soil Biol Biochem.. 2010;42:2078-2086.
- [Google Scholar]
- Composting a mixture of date palm wastes, date palm pits, and shrimp and crab shell wastes in vessel system. Saudi J. Biol. Sci.. 2008;15:199-205.
- [Google Scholar]
- Humic acid-like matter isolated from green urban wastes. Part I: Structure and surfactant properties. BioResources. 2008;3:123-141.
- [Google Scholar]
- Soil fertility, organic matter and humic compounds in anthropogenic soils of western Amazon. Bragantia. 2007;66:307-315.
- [Google Scholar]
- Effect of selected organic materials and inorganic fertilizer on the soil fertility of a humic nitisol in the central highlands of Kenya. Soil Use Manage.. 2009;25:434-440.
- [Google Scholar]
- Imaging of humic substance macromolecular structures in water and soils. Science. 1999;286:1335-1337.
- [Google Scholar]
- Characteristics of humic substances in the Kuji river waters as determined by high-performance size exclusion chromatography with fluorescence detection. Water Res.. 2003;37:4159-4170.
- [Google Scholar]
- Structural elucidation of humic acids extracted from Pakistani lignite using spectroscopic and thermal degradative techniques. Fuel Process. Technol.. 2011;92:983-991.
- [Google Scholar]
- Isolation and characterization of humic acids in Idaho slickspot soils. Soil Sci.. 2008;173:375-386.
- [Google Scholar]
- Identification of humic acid-like and fulvic acid-like natural organic matter in river water using fluorescence spectroscopy. Water Sci. Technol.. 2011;63:2427-2433.
- [Google Scholar]
- Humic substance – compounds of still unknown structure: applications in agriculture, industry, environment, and biomedicine. J. Appl. Biomed.. 2005;3:13-24.
- [Google Scholar]
- Oil generation capacity of coals as a function of coal age and aliphatic structure. Org. Geochem.. 2006;37:558-583.
- [Google Scholar]
- Structural characteristics of humic substances as related to nitrate uptake and growth regulation in plant systems. Soil Biol. Biochem.. 1992;24:373-380.
- [Google Scholar]
- Spectroscopic characteristics of humic acids originated in soils and lignite. Soil Water Res.. 2009;4:168-175.
- [Google Scholar]
- Comparison of the structures of humic acids from marine sediments and degraded field atoms by l3C and 1H NMR spectroscopy. Mar. Chem.. 1985;117:115-126.
- [Google Scholar]
- Applications of NMR to soil organic matter analysis: history and prospects. Soil Sci.. 1996;161:144-166.
- [Google Scholar]
- Humic acids from mechanically treated coals: a review. Solid Fuel Chem.. 2009;43:9-14.
- [Google Scholar]
- Use of l3C NMR and FTIR for elucidation of degradation pathways during natural litter decomposition and composting plant. In: Davies G., Ghabbour E.A., eds. Humic Substances: Structures, Properties, and Uses. Cambridge: Royal Society of Chemistry; 1998. p. :29-45.
- [Google Scholar]
- The study of humification process of compost using humic acid and its functional groups. In: International Conference on Chemistry and Chemical Engineering Proceedings. Kyoto: IEEE; 2010. p. :372-374.
- [Google Scholar]
- Determination of the aromaticity of humic substances by X-ray diffraction analysis. Soil Sci. Soc. Am. J.. 1991;55:745-750.
- [Google Scholar]
- New insights into organic-mineral particles: composition, properties, and models of molecular structure. Biol. Fertil. Soils. 2000;30:399-432.
- [Google Scholar]
- A state of the art structural concept for humic substances. Naturwissenschaften. 1993;80:29-30.
- [Google Scholar]
- Beneficial effects of humic substances ferrtigation on soil fertility to potato grown on sandy soil. Aust. J. Basic Appl. Sci.. 2009;3:4351-4358.
- [Google Scholar]
- Influence of compost, amino and humic acids on the growth, yield and chemical parameters of strawberries. J. Med. Plant Res.. 2011;5:2304-2309.
- [Google Scholar]
- Physicochemical properties of the humic substances of peat and brown coal. Solid Fuel Chem.. 2011;45:1-6.
- [Google Scholar]
- 13C NMR spectra and Cu(II) formation constants for humic acids from fluvial, estuarine and marine sediments. Mar. Chem.. 1986;20:61-72.
- [Google Scholar]
- Black carbon and kerogen in soils and sediments. Quantification and characterization. Environ. Sci. Technol.. 2002;36:3960-3967.
- [Google Scholar]
- Humic acid-inspired hybrid materials as heavy metal absorbents. J. Colloid Interface Sci.. 2010;351:239-247.
- [Google Scholar]
- Implication of elemental characteristics of humic substances. In: Aiken G.R., McKnight D.M., Wershaw R.L., MacCarthy P., eds. Humic Substances in Soil, Sediment and Water: Geochemistry, Isolation, and Characterization. New York: Wiley-Interscience Publication; 1985. p. :457-476.
- [Google Scholar]
- Humus Chemistry: Genesis, Composition, Reactions (second ed.). London: John Wiley & Sons; 1994.
- Fluorescent humic acid bands in coral skeletons originate from terrestrial runoff. Mar. Chem.. 1991;33:91-104.
- [Google Scholar]
- Geochemistry of humus. In: Bregor I.A., ed. Organic Geochemistry. New York: Pergamon Press; 1963. p. :87-147.
- [Google Scholar]
- Effect of iron and humic acid on photodegradation of some pesticides adsorbed on clay surfaces. Arabian J. Chem.. 2010;3:73-78.
- [Google Scholar]
- Seasonal dynamics, typhoons and the regulation of lake metabolism in a subtropical humic lake. Freshwater Biol.. 2008;53:1929-1941.
- [Google Scholar]
- Effect of different doses of metachlor on the microflora of deep low-humic chernozem. Mikrobiol Zh.. 1977;39:88-92.
- [Google Scholar]
- The use of aqueous humic substances for in-situ remediation of contaminated aquifers. In: Perminova I.V., Hatfield K., Hertkorn N., eds. Use of Humic Substances to Remediate Polluted Environments: From Theory to Practice. The Netherlands: Springer; 2005. p. :233-256.
- [Google Scholar]
- Degradation of humic acid from water by advanced electrochemical oxidation method. Water Sci. Technol: Water Supply. 2011;11:85-95.
- [Google Scholar]
- Humic acids: their detergent qualities and potential uses in pollution remediation. Geochem. Trans.. 2000;1:10-15.
- [Google Scholar]
- Agriculturae Fundamenta Chemical Spez. De. Humo. Diss. (first ed.). Sweden: Uppsala University; 1761.
- Effects of fulvic acid and humic acid on aluminum speciation in drinking water. J. Environ. Sci.. 2010;22:211-217.
- [Google Scholar]
- Use of 13C NMR and FTIR for elucidation of degradation pathways during natural litter decomposition and composting 1. Early stage leaf degradation. Soil Sci.. 1996;161:667-679.
- [Google Scholar]
- NMR Techniques and Applications in Geochemistry and Soil Chemistry (first ed.). Oxford: Pergamon Press; 1987.
- Black carbon and kerogen in soils and sediments. Their roles in equilibrium sorption of less-polar organic pollutants. Environ. Sci. Technol.. 2004;38:5842-5852.
- [Google Scholar]
- Cross-correlation of polarity curves to predict partition coefficients of nonionic organic contaminants. Environ. Sci. Technol.. 1994;28:1929-1933.
- [Google Scholar]
- Dual-mode sorption of low-polarity compounds in glassy poly (vinyl chloride) and soil organic matter. Environ. Sci. Technol.. 1997;31:792-799.
- [Google Scholar]
- Physical activation of Saudi Arabia date palm tree’s foliar, frond and thorn. In: Proceedings of the 2010 International Conference on Mechanical, Industrial, and Manufacturing Technologies. Sanya: IACSIT; 2010. p. :511-518.
- [Google Scholar]


